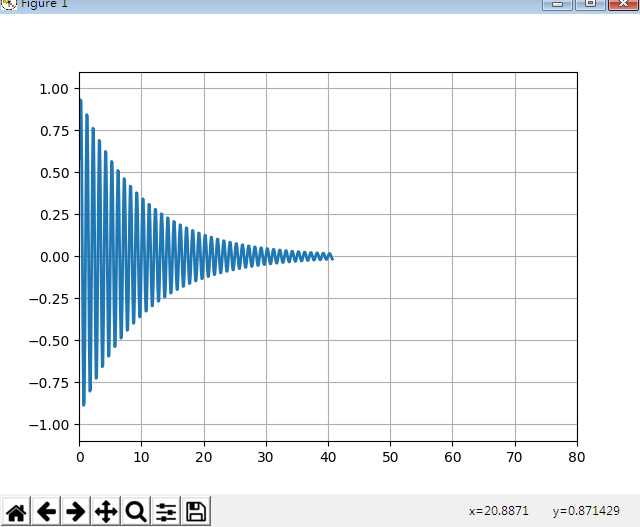
mathplotlib-Animation1:Sin函数衰减
Posted
tags:
篇首语:本文由小常识网(cha138.com)小编为大家整理,主要介绍了mathplotlib-Animation1:Sin函数衰减相关的知识,希望对你有一定的参考价值。
一 代码
参考:官网API-Example
"""
衰减效果-Decay
Sin衰减

FuncAnimation()函数参考http://matplotlib.org/api/_as_gen/matplotlib.animation.FuncAnimation.html?highlight=funcanimation

matplotlib.animation.FuncAnimation(fig, func, frames=None, init_func=None, fargs=None, save_count=None, **kwargs)
    fig:图像
    func:每一帧都会调用及时更新函数,下一帧的数据。函数要求def func(fr: object, *fargs) -> iterable_of_artists:
    frames:func的帧数据
    init_func:第一帧前初始化,例如清空数据
    fargs :元组,为调用参数增加参数
    save_count :int,缓存帧的数量
    interval:number,两帧之间的时延,默认为200 ms
    repeat_delay:number,重复animation的时延
    repeat:bool ,是否重复animation,默认True
    blit:bool ,位块传输是否,默认False

"""

import numpy as np
import matplotlib.pyplot as plt
import matplotlib.animation as animation

def data_gen(t=0):
    cnt = 0
    while cnt < 1000:
        cnt += 1
        t += 0.1
        yield t, np.sin(2*np.pi*t) * np.exp(-t/10.)


def init():
    ax.set_ylim(-1.1, 1.1)
    ax.set_xlim(0, 10)
    del xdata[:]
    del ydata[:]
    line.set_data(xdata, ydata)
    return line,


def run(data):
    # update the data
    t, y = data
    xdata.append(t)
    ydata.append(y)
    xmin, xmax = ax.get_xlim()

    if t >= xmax:
        ax.set_xlim(xmin, 2*xmax)
        ax.figure.canvas.draw()
    line.set_data(xdata, ydata)

    return line


fig, ax = plt.subplots()#matplotlib.figure.Figure 画图设置大小事件等实例
line, = ax.plot([], [], lw=2)#描线
ax.grid()
xdata, ydata = [], []

ani = animation.FuncAnimation(fig, run, data_gen, blit=False, interval=10, repeat=False, init_func=init)
plt.show()
二效果

以上是关于mathplotlib-Animation1:Sin函数衰减的主要内容,如果未能解决你的问题,请参考以下文章
The Preliminary Contest for ICPC Asia Nanjing 2019 F.Greedy Sequence(主席树上二分)