机器学习聚类算法(实战)
Posted 酱懵静
tags:
篇首语:本文由小常识网(cha138.com)小编为大家整理,主要介绍了机器学习聚类算法(实战)相关的知识,希望对你有一定的参考价值。
聚类算法(实战)
目录
实战部分将结合着 理论部分 进行,旨在帮助理解和强化实操(以下代码将基于 jupyter notebook 进行)。
一、不同聚类算法的执行效果和所用时间

二、准备工作(设置 jupyter notebook 中的字体大小样式等)
import numpy as np
import os
%matplotlib inline
import matplotlib
import matplotlib.pyplot as plt
plt.rcParams['axes.labelsize'] = 14
plt.rcParams['xtick.labelsize'] = 12
plt.rcParams['ytick.labelsize'] = 12
import warnings
warnings.filterwarnings('ignore')
np.random.seed(43)
三、Kmeans 算法
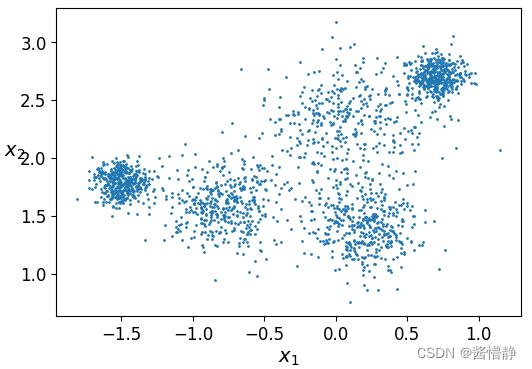
1、构建样本数据
# 绘制以一个区域,包含多个簇
from sklearn.datasets import make_blobs

# 构造 5 个点,并以这 5 个点发散出 5 个簇
blob_centers = np.array(
    [[-1.5,1.8],
     [-0.8,1.6],
     [0.1,2.3],
     [0.2,1.4],
     [0.7,2.7]])

# 选择 0-1 的值,以指示每个中心点发散的大小
blob_std = np.array([0.1,0.2,0.3,0.2,0.1])

# 下面的代码将根据前面指定的参数,返回指定数量的数据点
X, y = make_blobs(n_samples = 2000, centers = blob_centers, cluster_std = blob_std, random_state = 7)

# 查看返回的 X
print("X 中的数据")
print(X)
print()

# 查看返回的 y(由于 Kmeans 是无监督的聚类,所以这里的 y 的取值其实是用不上的,最多当作一个参考)
print("y 中的数据")
print(y)
Out
	[[ 0.80176059  2.7454702 ]
	 [-0.12379505  2.32927249]
	 [-1.30980719  1.51761694]
	 ...
	 [ 0.19392915  1.25896231]
	 [-1.4898566   1.82525777]
	 [ 0.58576697  2.76863195]]

	[4 2 0 ... 3 0 2]
# 定义一个基于二维数据绘制散点图的函数
def plot_clusters(X,y = None) :
    # 传递二维数据在两个维度上的值、数据点大小、颜色
    plt.scatter(X[:,0], X[:,1], s=1, c=y)

    # 设置坐标轴标签
    plt.xlabel("$x_1$", fontsize=14)
    plt.ylabel("$x_2$", fontsize=14, rotation=0)

# 画图展示
plt.figure(figsize=(6, 4))
plot_clusters(X)
plt.show()

2、基于样本数据构建分类器
# 导入相关包
from sklearn.cluster import KMeans

# 设置最初的簇数(可随机指定,但通过观察上图我们可以认为其可分为 5 簇,因此设置 k = 5 )
k = 5

# 实例化一个 KMeans 聚类工具
kmeans = KMeans(n_clusters = k, random_state = 43)

# fit_predict() 函数将对传入的数据样本进行训练并返回预测结果
y_pred = kmeans.fit_predict(X)

# 展示 (数组中的数字即代表对应数据被划归到的类别)
print(y_pred)

# 上面的结果与调用 kmeans.labels_ 属性的结果是一致的
print(kmeans.labels_)
Out
	[3 0 4 ... 2 4 3]
	[3 0 4 ... 2 4 3]
# 得到算法结束后,最终各簇的中心点(指定的 k 为多少,这就有多少个元素)
kmeans.cluster_centers_
Out
	array([[ 0.00555392,  2.32870063],
	       [-0.76285141,  1.59224003],
	       [ 0.19589571,  1.41934638],
	       [ 0.67865059,  2.67700524],
	       [-1.48717074,  1.78811617]])
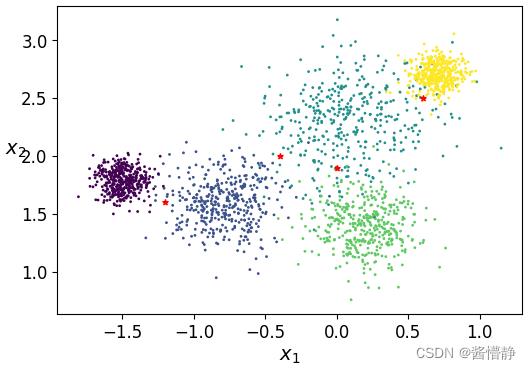
# 接下来就可以用这基于最初构建的数据而建立的分类器对任意数据进行预测
# 构建待预测样本数据
X_new = np.array([[-1.2,1.6],[-0.4,2],[0,1.9],[0.6,2.5]])

# 用图像的方式来直观感受这些点的位置
plt.figure(figsize=(6, 4))
plt.scatter(X[:,0], X[:,1], s=1, c=y)
plt.scatter(X_new[:,0], X_new[:,1], s=15, c='r', marker='*')
plt.xlabel("$x_1$", fontsize=14)
plt.ylabel("$x_2$", fontsize=14, rotation=0)
plt.show()

# 对指定的数据进行预测
kmeans.predict(X_new)
Out
	array([4, 0, 0, 3])
3、绘制决策边界
# 定义函数

# 展示数据
def plot_data(X):
    plt.plot(X[:,0], X[:,1], 'k.', markersize = 2)

# 绘制中心点
def plot_centroids(centroids,weights=None, circle_color='w', cross_color='r'):
    if weights is not None:
        centroids = centroids[weights > weights.max() / 10]
    plt.scatter(centroids[:,0],centroids[:,1],
                marker = 'o', s = 100, linewidths = 2,
                color = circle_color, zorder = 10, alpha = 1)
    plt.scatter(centroids[:,0], centroids[:,1],
                marker = 'x', s = 50, linewidths = 2,
                color = cross_color, zorder = 10, alpha = 1)

# 绘制决策边界
def plot_decision_boundaries(clusterer, X, resolution = 1000, show_centroids=True,
                             show_xlabels=True, show_ylabels=True):
    # 指定棋盘的边界
    mins = X.min(axis = 0) - 0.1
    maxs = X.max(axis = 0) + 0.1

    # 组合边界值构成二维边界
    xx, yy = np.meshgrid(np.linspace(mins[0], maxs[0], resolution),
                         np.linspace(mins[1], maxs[1], resolution))
    Z = clusterer.predict(np.c_[xx.ravel(), yy.ravel()])
    Z = Z.reshape(xx.shape)

    # 绘制等高线
    plt.contourf(Z, extent = (mins[0], maxs[0], mins[1], maxs[1]), cmap="Pastel2")
    plt.contour(Z, extent = (mins[0], maxs[0],mins[1], maxs[1]), linewidths=1, colors='k')

    # 绘制基本数据点
    plot_data(X)

    # 是否展示类簇中心点
    if show_centroids:
        plot_centroids(clusterer.cluster_centers_)

    # 是否展示横坐标标签
    if show_xlabels:
        plt.xlabel("$x_1$", fontsize = 14)
    else:
        plt.tick_params(labelbottom = 'off')

    # 是否展示纵坐标标签
    if show_ylabels:
        plt.ylabel("$x_2$", fontsize = 14, rotation = 0)
    else:
        plt.tick_params(labelleft = 'off')
# 绘制图像
plt.figure(figsize = (7,5))
plot_decision_boundaries(kmeans, X)
plt.show()

4、演示 k-means 算法的不稳定性
# 定义绘图函数
def plot_cluster_comparison(c1, c2, X):
    c1.fit(X)
    c2.fit(X)

    plt.figure(figsize = (10,3))
    plt.subplot(121)
    plot_decision_boundaries(c1,X)
    plt.subplot(122)
    plot_decision_boundaries(c2,X)
# KMeans()函数的参数解释:
# 1、n_clusters 指定最终要分类出的个数
# 2、init 表示算法初始点的位置
# 3、n_init 表示算法会跑几次。在理论部分提到,k-means 算法在选取不同初始点时,最终得到的类簇中心
#    都是不同的。因此, KMeans()函数在设计时会对数据样本默认跑 n_init 次,并选择其中效果最好的
#    那一次作为最终的模型返回
# 4、max_iter 最大迭代次数(接下来的实验分别将这个值设置为 1、2、3 以查看 k-means 的执行流程)
# 5、random_state 随机数种子
c1 = KMeans(n_clusters = k, init = 'random', n_init = 1, max_iter = 1, random_state = 2)
c2 = KMeans(n_clusters = k, init = 'random', n_init = 1, max_iter = 1, random_state = 5)
plot_cluster_comparison(c1, c2, X)

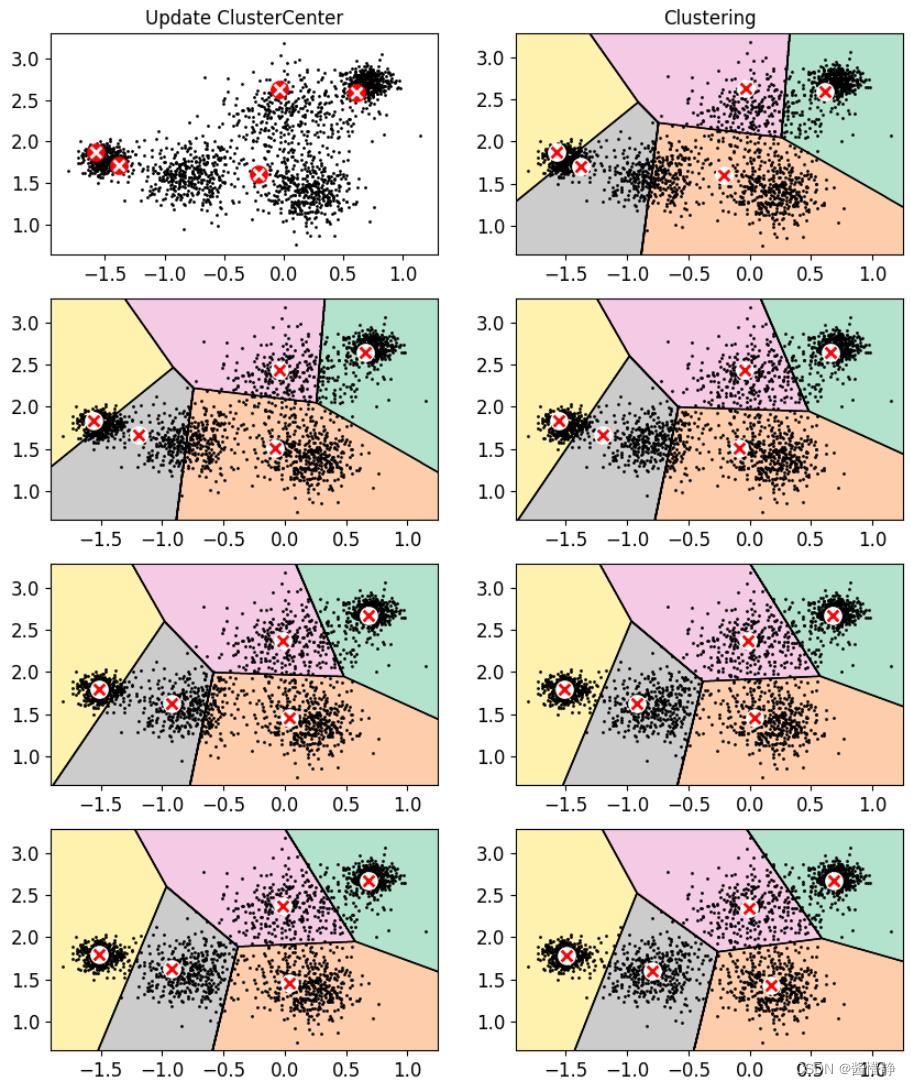
5、演示 k-means 算法的执行流程
kmeans_iter1 = KMeans(n_clusters = k, init = 'random', n_init = 1, max_iter = 1, random_state = 2)
kmeans_iter2 = KMeans(n_clusters = k, init = 'random', n_init = 1, max_iter = 2, random_state = 2)
kmeans_iter3 = KMeans(n_clusters = k, init = 'random', n_init = 1, max_iter = 3, random_state = 2)
kmeans_iter4 = KMeans(n_clusters = k, init = 'random', n_init = 1, max_iter = 4, random_state = 2)

kmeans_iter1.fit(X)
kmeans_iter2.fit(X)
kmeans_iter3.fit(X)
kmeans_iter4.fit(X)

# 对比实验:画图对比不同迭代次数时 KMeans 聚类的效果
plt.figure(figsize = (10,12))

plt.subplot(421)
plot_data(X)
plot_centroids(kmeans_iter1.cluster_centers_, circle_color='r', cross_color='w')
plt.title('Update ClusterCenter')

plt.subplot(422)
plot_decision_boundaries(kmeans_iter1, X, show_xlabels = False, show_ylabels = False)
plt.title('Clustering')

plt.subplot(423)
plot_decision_boundaries(kmeans_iter1, X, show_centroids=False, show_xlabels = False, show_ylabels = False)
plot_centroids(kmeans_iter2.cluster_centers_)

plt.subplot(424)
plot_decision_boundaries(kmeans_iter2, X, show_xlabels = False, show_ylabels = False)

plt.subplot(425)
plot_decision_boundaries(kmeans_iter2, X, show_centroids=False, show_xlabels = False, show_ylabels = False)
plot_centroids(kmeans_iter3.cluster_centers_)

plt.subplot(426)
plot_decision_boundaries(kmeans_iter3, X, show_xlabels = False, show_ylabels = False)

plt.subplot(427)
plot_decision_boundaries(kmeans_iter3, X, show_centroids=False, show_xlabels = False, show_ylabels = False)
plot_centroids(kmeans_iter3.cluster_centers_)

plt.subplot(428)
plot_decision_boundaries(kmeans_iter4, X, show_xlabels = False, show_ylabels = False)

plt.show()

6、评估方法
inertia 指标:每个样本到其簇中心的欧氏距离之和
# 取 2 中基于数据 X 构建好的分类器 kmeans,查看其 inertia_ 值
kmeans.inertia_
Out
	123.72148498489219
下面通过 transform() 函数查看数据集 X 中,各个数据点到各类簇中心的欧氏距离,并基于这些数据手动计算 inertia_ 值
# 查看数据集 X 中,各个数据点到各类簇中心的欧氏距离
X_dist = kmeans.transform(X)
print("各个数据点到各类簇中心的欧氏距离:")
print(X_dist)
print()

# 查看数据集 X 中,各个数据点的所属类簇
print("各个数据点的所属类簇:")
print(kmeans.labels_)
print()

# 通过上述两个参数,就能查看每个数据点到其所属类簇的簇中心距离
print("每个数据点到其所属类簇的簇中心距离:")
X_dist[np.arange(len(X_dist)),kmeans.labels_]
Out
	各个数据点到各类簇中心的欧氏距离:
	[[0.89868901 1.94369506 1.45797004 0.14086704 2.48107503]
	 [0.12935023 0.97550493 0.96445202 0.87454964 1.46684813]
	 [1.54532572 0.55202285 1.50890633 2.30177009 0.32346199]
	 ...
	 [1.08619764 1.01316488 0.16039612 1.49859955 1.7624133 ]
	 [1.57788065 0.76343554 1.73393337 2.32978479 0.03723859]
	 [0.72813924 1.78960037 1.40448252 0.13047154 2.29313801]]

	各个数据点的所属类簇:
	[3 0 4 ... 2 4 3]

	每个数据点到其所属类簇的簇中心距离:
	array([0.14086704, 0.12935023, 0.32346199, ..., 0.16039612, 0.03723859,
       		0.13047154])
可进行对比查看:
transform(X)第一行数据 [0.89868901 1.94369506 1.45797004 0.14086704 2.48107503] 中的最小值正好为 0.14086704;
transform(X)第二行数据 [0.12935023 0.97550493 0.96445202 0.87454964 1.46684813] 中的最小值正好为 0.12935023;
transform(X)第三行数据 [1.54532572 0.55202285 1.50890633 2.30177009 0.32346199] 中的最小值正好为 0.32346199;
……
# 接下来计算各个数据点到其所属类簇中心的欧氏距离之和
np.sum(X_dist[np.arange(len(X_dist)), kmeans.labels_]**2)
Out
	123.72148498489243
可以看出,计算出的值就等于前面 kmeans.inertia_ 的值
# 还有一种查看 inertia 值的方法,但是这方法返回的值是 inertia 的相反数
kmeans.score(X)
Out
	-123.72148498489219
# 查看前面仅执行一次 k-means 聚类的 inertia_ 值
print("c1 的inertia值:",c1.inertia_)
print("c2 的inertia值:",c2.inertia_)
Out
	c1 的inertia值: 288.16607006680323
	c2 的inertia值: 225.32848318532416
7、如何找到最佳簇数
对于 k-means 算法而言,显然当 k 越大时,得到的 inertia_ 值会越小(考虑极限情况:所有样本都单独作为一个类别,则此时这个分类器的 inertia_ 值为0)。因此,最佳簇数的评判标准一定不能仅靠 inertia_ 值。inertia_ 最好的适用场景是评判 k 值一致时,不同算法的优劣。
下面介绍一些寻找最佳簇数的算法:
方法1:找拐点
注:这里的拐点不是数学中“二阶导异号(或不存在)的点”。 这里的拐点是指,某一点相较其前一单位点而言,数据的变化程度(斜率)降低了很多。若设该点位置为 𝑥 𝑖 𝑥_𝑖 xi,其前一单位点位置为 f ′ ( x i − 1 ) > > f ′ ( x i ) f^'(x_i-1) >> f^'(x_i) f′(xi−1)>>f′(xi) 。
# 构建 9 个进行 k-means 聚类后的分类器,每个分类器的分别将数据划分为 1-9 类
kmeans_per_k = [KMeans(n_clusters = k).fit(X) for k in range(1,10)]

# 将 9 个分类器的 inertia_ 值分别算出并放进一个列表中
inertias = [model.inertia_ for model in kmeans_per_k]

# 查看相关参数
print(len(inertias))
range(len(inertias)-1)
Out
	9
	range(0, 8)
# 下面算出这 9 个分类器的 inertia_ 差值
inertials_gap = []
for i in range(len(inertias)-1):
inertials_gap.append(inertias[i]-inertias[i+1])
# 将差值最大的那个数据所对应的 k 值(减数)输出
print("找拐点的方法认为,将原数据集划分为 %d 个簇是最合适的。" % (inertials_gap.index(max(inertials_gap))+1) )
# 画图直观观察 9 个分类器在 k 值不同时的 inertia_ 值(以及整体的变化率)
plt.figure(figsize = (6,3))
plt.plot(range(1,以上是关于机器学习聚类算法(实战)的主要内容,如果未能解决你的问题,请参考以下文章