Matlab在概率统计中的应用问题及解决方案集锦
Posted 文宇肃然
tags:
篇首语:本文由小常识网(cha138.com)小编为大家整理,主要介绍了Matlab在概率统计中的应用问题及解决方案集锦相关的知识,希望对你有一定的参考价值。
前言
关于MATLAB系列的精品专栏大家可参见
喜欢的小伙伴可自行订阅,你的支持就是我不断更新的动力哟!
Matlab在概率统计中的应用(0001)
问题:
假设已知 Rayleigh 分布的概率密度函数为
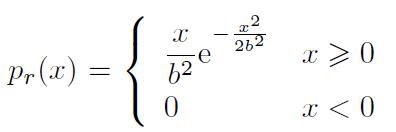
试用解析推导的方法求出该分布的分布函数、均值、方差、中心矩和原点矩。生成一组满足 Rayleigh 分布的伪随机数,用数值方法检验得出的解析结果是否正确。
解:
工具相应的数学定义的公式,所需的分布函数、均值、方差、中心矩和原点矩等可 以由下面的语句推导出来。
>> syms x;
syms b positive
p=x*exp(-x^2/2/b^2)/b^2*heaviside(x);
>> syms tau;
F=int(subs(p,x,tau),tau,-inf,x)
F =
-exp(-1/2*x^2/b^2)+1
>> Emean=int(x*p,x,-inf,inf)
Emean =
1/2/b^2*2^(1/2)/(1/b^2)^(3/2)*pi^(1/2)
>> Evar=int((x-Emean)^2*p,x,-inf,inf)
Evar =
-1/2*b^2*pi+2*b^2
>> Ev=int(x^r*p,x,0,inf)
Ev =
2^(1/2*r)*b^r*gamma(1/2*r+1)
>> Evm=int((x-Emean)^r*p,x,0,inf) % 不能得出解析解
注意:MATLAB 6.* 版本不支持 heaviside() 函数。
因为 x < 0 时 p = 0,所以,实际求解可以由下面的语句实现,得出的结果和前面一致。
>> syms x;
syms b positive
p=x*exp(-x^2/2/b^2)/b^2;
>> syms tau;
F=int(subs(p,x,tau),tau,0,x)
F =
-exp(-1/2*x^2/b^2)+1
>> Emean=int(x*p,x,0,inf)
Emean =
1/2/b^2*2^(1/2)/(1/b^2)^(3/2)*pi^(1/2)
>> Evar=int((x-Emean)^2*p,x,0,inf)
Evar =
-1/2*b^2*pi+2*b^2
假设 b = 1,则可以由下面语句
>> R=raylrnd(1,10000,1);
mean(R)
>> vpa(subs(Emean,b,1))
ans =
1.26374494951941
ans =
1.2533141373155003428507825447014
>> vpa(subs(Evar,b,1))
ans =
.42920367320510344200101826572791
>> cov(R-mean(R))
ans =
0.43460979618693
Matlab在概率统计中的应用(0002)
问题:
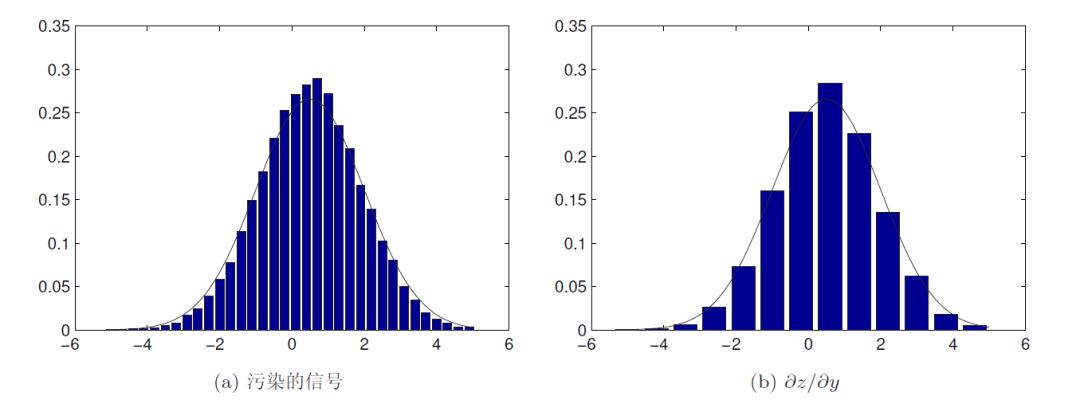
试生成满足正态分布 N (0.5, 1.42) 的 30000 个伪随机数,对其均值和方差进行验证,并用直方图的方式观察其分布与理论值是否吻合,若改变直方图区间的宽度会得出什么结论。
解:
用下面的语句可以生成随机数,并计算均值和方差,可见,其结果接近给定的数 值。
>> x=normrnd(0.5,1.4,30000,1);
m=mean(x),
s=std(x)
m =
0.49974242123102
s = 1.40033494141044
>> xx=-5:0.3:5;
yy=hist(x,xx);
bar(xx,yy/length(x)/0.3);
hold on x0=-5:0.1:5;
y0=normpdf(x0,0.5,1.5);
plot(x0,y0)
>> xx=-5:0.8:5;
yy=hist(x,xx);
bar(xx,yy/length(x)/0.8);
hold on;
plot(x0,y0)
Matlab在概率统计中的应用(0003)
问题:
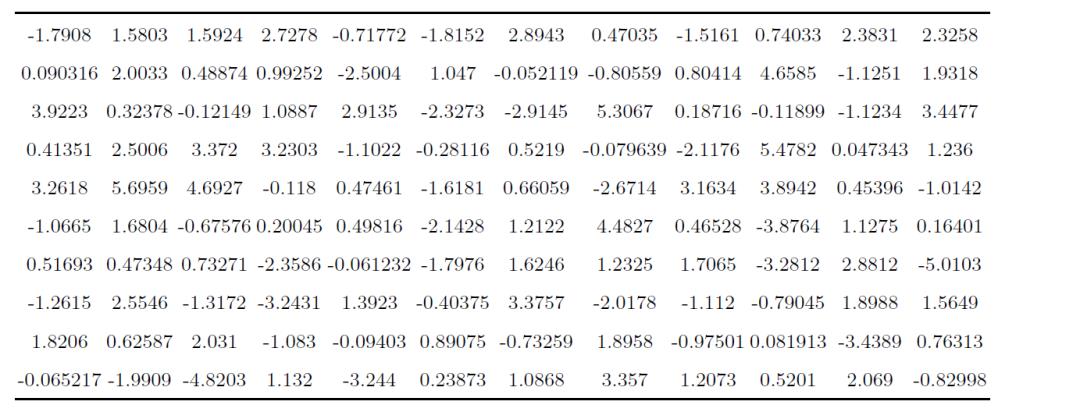
假设通过实验测出某组数据,试用MATLAB 对这些数据进行检验。
① 若认为该数据满足正态分布,且标准差为1.5,请检验该均值为0.5 的假设是否成立。
② 若未知其方差,试再检验其均值为0.5 的假设是否成立。
③ 试对给出数据的正态性进行检验。
解:
① 引入两个命题

这样
>> x=[-1.7908; 0.090316; 3.9223; 0.41351; 3.2618; -1.0665; 0.51693; -1.2615; 1.8206; -0.065217; 1.5803; 2.0033; 0.32378; 2.5006; 5.6959; 1.6804; 0.47348; 2.5546; 0.62587; -1.9909; 1.5924; 0.48874; -0.12149; 3.372; 4.6927; -0.67576; 0.73271; -1.3172; 2.031; -4.8203; 2.7278; 0.99252; 1.0887; 3.2303; -0.118; 0.20045; -2.3586; -3.2431; -1.083; 1.132; -0.71772; -2.5004; 2.9135; -1.1022; 0.47461; 0.49816; -0.061232; 1.3923; -0.09403; -3.244; -1.8152; 1.047; -2.3273; -0.28116; -1.6181; -2.1428; -1.7976; -0.40375; 0.89075; 0.23873; 2.8943; -0.052119; -2.9145; 0.5219; 0.66059; 1.2122; 1.6246; 3.3757; -0.73259; 1.0868; 0.47035; -0.80559; 5.3067; -0.079639; -2.6714; 4.4827; 1.2325; -2.0178; 1.8958; 3.357; -1.5161; 0.80414; 0.18716; -2.1176; 3.1634; 0.46528; 1.7065; -1.112; -0.97501; 1.2073; 0.74033; 4.6585; -0.11899; 5.4782; 3.8942; -3.8764; -3.2812; -0.79045; 0.081913; 0.5201; 2.3831; -1.1251; -1.1234; 0.047343; 0.45396; 1.1275; 2.8812; 1.8988; -3.4389; 2.069; 2.3258; 1.9318; 3.4477; 1.236; -1.0142; 0.16401; -5.0103; 1.5649; 0.76313; -0.82998];
>> u=sqrt(length(x))*(mean(x)-0.5)/1.5
u =
-0.18857874651686
因为 |u|< 1.96,所以可以接受其假设。
② 方差未知,则应该引入T 检验
>> [H,p,ci]=ttest(x,0.5,0.02)
H =
0
p =
0.89494112815610
ci =
0.01405637328924 0.93429921004409
因为H = 0,所以应该不能拒绝该检验,这时还可以得出置信区间为[0:014; 0:9343]。
③ 采用Jarque-Bera 假设检验,则可见该分布为正态分布。
>> [h,s]=jbtest(x,0.05)
h =
0
s =
0.99075654463354
拓展:
>> help ttest
ttest One-sample and paired-sample t-test.
ttest 单采样和配对采样 t 检验。
-
H = ttest(X) performs a t-test of the hypothesis that the data in the vector X come from a distribution with mean zero, and returns the result of the test in H. H=0 indicates that the null hypothesis ("mean is zero") cannot be rejected at the 5% significance level. H=1 indicates that the null hypothesis can be rejected at the 5% level. The data are assumed to come from a normal distribution with unknown variance.
-
X can also be a matrix or an N-D array. For matrices, ttest performs separate t-tests along each column of X, and returns a vector of results. For N-D arrays, ttest works along the first non-singleton dimension of X.
-
ttest treats NaNs as missing values, and ignores them.
H=ttest(X)对向量X中的数据来自平均值为零的分布的假设进行t检验,并返回H中的检验结果。
H=0表示在5%显著性水平上不能拒绝零假设(“均值为零”)。
H=1表示在5%的水平上可以拒绝零假设。假设数据来自方差未知的正态分布。
X也可以是矩阵或N-D数组。对于矩阵,ttest沿着X的每列执行单独的t-测试,并返回结果向量。
对于N-D数组,t-test沿着X的第一个非单重维度工作。
ttest将nan视为缺少的值,并忽略它们。
-
H = ttest(X,M) performs a t-test of the hypothesis that the data in X come from a distribution with mean M. M must be a scalar.
-
H = ttest(X,Y) performs a paired t-test of the hypothesis that two matched samples, in the vectors X and Y, come from distributions with equal means. The difference X-Y is assumed to come from a normal distribution with unknown variance. X and Y must have the same length. X and Y can also be matrices or N-D arrays of the same size.
-
[H,P] = ttest(...) returns the p-value, i.e., the probability of observing the given result, or one more extreme, by chance if the null hypothesis is true. Small values of P cast doubt on the validity of the null hypothesis.
-
[H,P,CI] = ttest(...) returns a 100*(1-ALPHA)% confidence interval for the true mean of X, or of X-Y for a paired test.
-
[H,P,CI,STATS] = ttest(...) returns a structure with the following fields:
-
'tstat' -- the value of the test statistic
-
'df' -- the degrees of freedom of the test
-
'sd' -- the estimated population standard deviation. For a paired test, this is the std. dev. of X-Y.
-
[...] = ttest(X,Y,'PARAM1',val1,'PARAM2',val2,...) specifies one or more of the following name/value pairs:
Parameter Value
'alpha' A value ALPHA between 0 and 1 specifying the significance level as (100*ALPHA)%. Default is 0.05 for 5% significance.
'dim' Dimension DIM to work along.
For example, specifying 'dim' as 1 tests the column means. Default is the first non-singleton dimension.
'tail' A string specifying the alternative hypothesis:
'both' -- "mean is not M" (two-tailed test)
'right' -- "mean is greater than M" (right-tailed test)
'left' -- "mean is less than M" (left-tailed test)
-
See also ttest2, ztest, signtest, signrank, vartest.
拓展:
>> help jbtest
jbtest Jarque-Bera hypothesis test of composite normality.
复合正态性的jbtest-Jarque-Bera假设检验。
H = jbtest(X) performs the Jarque-Bera goodness-of-fit test of composite normality, i.e., that the data in the vector X came from an unspecified normal distribution, and returns the result of the test in H. H=0 indicates that the null hypothesis ("the data are normally distributed") cannot be rejected at the 5% significance level. H=1 indicates that the null hypothesis can be rejected at the 5% level.
jbtest treats NaNs in X as missing values, and ignores them.
H=jbtest(X)执行复合正态性的Jarque-Bera拟合优度检验,即向量X中的数据来自未指定正态分布,并返回H中的检验结果。H=0表示在5%显著性水平上不能拒绝空假设(“数据正态分布”)。H=1表示在5%的水平上可以拒绝零假设。
jbtest将X中的nan视为缺少的值,并忽略它们。
The Jarque-Bera test is a 2-sided goodness-of-fit test suitable for situations where a fully-specified null distribution is not known, and its parameters must be estimated. For large sample sizes, the test statistic has a chi-square distribution with two degrees of freedom. Critical values, computed using Monte-Carlo simulation, have been tabulated for sample sizes N <= 2000 and significance levels 0.001 <= ALPHA <= 0.50.
jbtest computes a critical value for a given test by interpolating into that table, using the analytic approximation to extrapolate for larger sample sizes.
Jarque-Bera检验是一种双面拟合优度检验,适用于完全指定的零分布未知的情况,其参数必须估计。对于大样本,检验统计量具有两个自由度的卡方分布。利用蒙特卡罗模拟计算出的临界值已制成表格,用于样本大小N<=2000和显著性水平0.001<=ALPHA<=0.50。
jbtest通过插值到该表中来计算给定测试的临界值,使用解析近似值对较大的样本量进行外推。
The Jarque-Bera hypotheses and test statistic are:
-
Null Hypothesis: X is normally distributed with unspecified mean and standard deviation.
-
Alternative Hypothesis: X is not normally distributed. The test is specifically designed for alternatives in the Pearson family of distributions.
-
Test Statistic: JBSTAT = N*(SKEWNESS^2/6 + (KURTOSIS-3)^2/24), where N is the sample size and the kurtosis of the normal distribution is defined as 3.
-
H = jbtest(X,ALPHA) performs the test at significance level ALPHA. ALPHA is a scalar in the range 0.001 <= ALPHA <= 0.50. To perform the test at significance levels outside that range, use the MCTOL input argument.
-
[H,P] = jbtest(...) returns the p-value P, computed using inverse interpolation into the look-up table of critical values. Small values of P cast doubt on the validity of the null hypothesis. jbtest warns when P is not found within the limits of the table, i.e., outside the interval [0.001, 0.50], and returns one or the other endpoint of that interval. In this case, you can use the MCTOL input argument to compute a more accurate value.
-
[H,P,JBSTAT] = jbtest(...) returns the test statistic JBSTAT.
-
[H,P,JBSTAT,CRITVAL] = jbtest(...) returns the critical value CRITVAL for the test. When JBSTAT > CRITVAL, the null hypothesis can be rejected at a significance level of ALPHA.
-
[H,P,...] = jbtest(X,ALPHA,MCTOL) computes a Monte-Carlo approximation for P directly, rather than using interpolation of the pre-computed tabulated values. This is useful when ALPHA or P is outside the range of the look-up table. jbtest chooses the number of MC replications, MCREPS, large enough to make the MC standard error for P, SQRT(P*(1-P)/MCREPS), less than MCTOL.
-
See also lillietest, kstest, kstest2, cdfplot.
补充例子1:
某种电子元件的寿命X(以小时计)服从正态分布,、σ2均未知。现测得16只元件的寿命如下:
159 280 101 212 224 379 179 264 222 362 168 250
149 260 485 170
问是否有理由认为元件的平均寿命大于225(小时)?
解:
>> X=[159 280 101 212 224 379 179 264 222 362 168 250 149 260 485 170];
>> [h,sig,ci]=ttest(X,225,0.05,1)
结果显示为:
h =
0
sig =
0.2570
ci =
198.2321 Inf %均值225在该置信区间内
结果表明:
H=0表示在水平下应该接受原假设,即认为元件的平均寿命不大于225小时。
补充例子2:
在平炉上进行一项试验以确定改变操作方法的建议是否会增加钢的产率,试验是在同一只平炉上进行的。每炼一炉钢时除操作方法外,其他条件都尽可能做到相同。先用标准方法炼一炉,然后用建议的新方法炼一炉,以后交替进行,各炼10炉,其产率分别为:
(1)标准方法:78.1 72.4 76.2 74.3 77.4 78.4 76.0 75.5 76.7 77.3
(2)新方法: 79.1 81.0 77.3 79.1 80.0 79.1 79.1 77.3 80.2 82.1
设这两个样本相互独立,且分别来自两个正态总体。
问建议的新操作方法能否提高产率?(取α=0.05)
解:
两个总体方差不变时,
>> X=[78.1 72.4 76.2 74.3 77.4 78.4 76.0 75.5 76.7 77.3];
>>Y=[79.1 81.0 77.3 79.1 80.0 79.1 79.1 77.3 80.2 82.1];
>> [h,sig,ci]=ttest2(X,Y,0.05,-1)
结果显示为:
h =
1
sig =
2.1759e-004 %说明两个总体均值相等的概率很小
ci =
-Inf -1.9083
结果表明:
H=1表示在水平下,应该拒绝原假设,即认为建议的新操作方法提高了产率,因此,比原方法好。
Matlab在概率统计中的应用(0004)
问题:
假设在某固定气压下对水的沸点进行多次测试,得出一组数据
113.53, 120.25, 106.02, 101.05,116.46, 110.33, 103.95, 109.29, 93.93, 118.67,
并假设它们满足正态分布,试求出置信水平 0.05 的条件下,该气压下水沸点的总体方差的置信区间。
解:
采用normfit() 可以直接得出结果
>> x=[113.53,120.25,106.02,101.05,116.46,110.33,103.95,109.29,93.93,118.67];
[m1,s1,ma,sa]=normfit(x,0.05);
s1, sa
s1 =
8.31047638693341
sa =
5.71623824378902
15.17169031357411
补充例子:
假设测出某随机变量的12 个样本为9.78, 9.17, 10.06, 10.14, 9.43, 10.60, 10.59, 9.98, 10.16, 10.09, 9.91, 10.36,试求其方差及方差的置信区间。
解:
先假设该随机变量满足状态分布,则可以用下面的语句进行检验
>> x=[9.78,9.17,10.06,10.14,9.43,10.6,10.59,9.98,10.16,10.09,9.91,10.36];
[H,p,c,d]=jbtest(x,0.05);
H
H =
0
经确认满足正态分布,所以用normfit() 函数即可以求出方差及方差的置信区间
>> [m1,s1,ma,sa]=normfit(x,0.05);
s1,sa
s1 =
0.42203242012476
sa =
0.29896571992305
0.71655956889670
课后例子:
甲、乙两位化验员独立地对某种聚合物的含氮量用相同的方法各取了10 次测定,其测定值的修正样本方差
![]()
依次为0.5419 和0.6050,求总体方差比
![]()
置信度为0.90 的置信区间。
假定测定值总体服从正态分布。
Matlab在概率统计中的应用(0005)
问题:
假设测出一组输入值

和输出值y,且已知

试用线性回归方法估计出ai 的值及其置信区间。

解:
用下面的语句可以直接得出ai 参数的值为
>> X=[8.11,9.25,7.63,7.89,12.94,10.11,7.57,9.92,7.74,7.3,9.48,11.91;
2.13,2.66,0.83,1.54,1.74,0.79,0.68,2.93,2.01,1.35,2.81,2.23;
-3.98,0.68,-1.42,0.96,0.28,-3.37,-4.58,-2.15,-2.66,-3.69,-1,0.98;
-6.55,-6.85,-6.25,-5.34,-6.85,-7.2,-6.12,-6.07,-5.51,-6.6,-6.15,-6.43;
5.92,7.54,5.39,4.65,6.47,5.1,6.04,5.37,6.54,6.55,5.8,3.95];
Y=[27.676,38.774,23.314,23.828,35.154,21.779,25.516,29.845,...
32.642,28.443,31.5,23.554];
a=X'\\Y'
a =
1.00000000000000
2.00000000000000
0.30000000000000
2.00000000000000
5.00000000000000
拟合误差的最大值为
>> norm(X'*a-Y')
ans =
2.060573933704291e-013
拓展问题:

最小二乘拟合问题可以轻易由下面语句解出,拟合的效果如图所示。
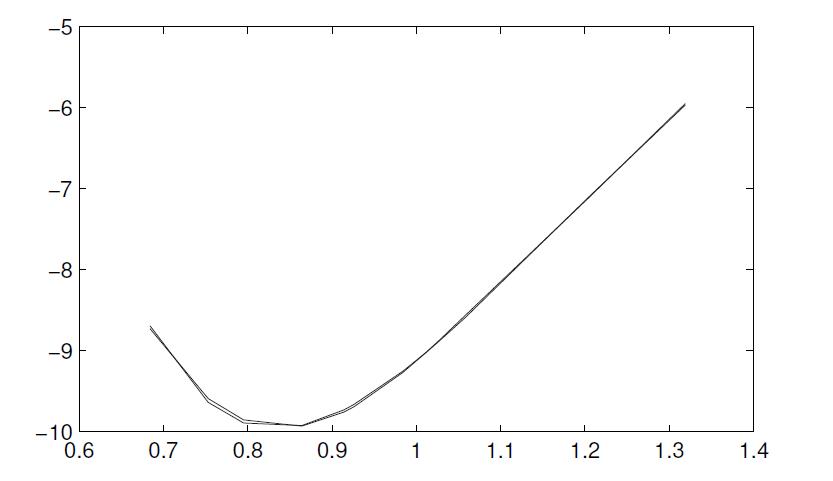
值得指出的是,拟合结果是不唯一的,可以验证,方程

也满足该数据。
>> x=[1.027,1.319,1.204,0.684,0.984,0.864,0.795,0.753,1.058,0.914,1.011,0.926];
y=[-8.8797,-5.9644,-7.1057,-8.6905,-9.2509,-9.9224,-9.8899,-9.6364,-8.5883,-9.7277,-9.023,-9.6605];
f=inline('a(1)*exp(-a(2)*x).*cos(a(3)*x+pi/3)+a(4)*exp(-a(5)*x).*cos(a(6)*x+pi/4)','a','x');
[c,ci]=nlinfit(x,y,f,[1;2;3;4;5;6])
c =
0.00040711158509
-5.06015593813225
-13.08432475592174
96.07498721640623
2.14471884660208
1.74002018682341
ci =
-0.00863222677865
-0.01657992037802
0.00867380595368
0.03572712081798
0.01634633374685
0.00721778662337
-0.03696112284095
-0.04648093944159
-0.02738558645155
0.02790393958794
0.00141502957354
0.02935899564930
>> [x1,ii]=sort(x);
y1=y(ii);
y2=f(c,x1);
plot(x1,y1,x1,y2)
拓展问题:
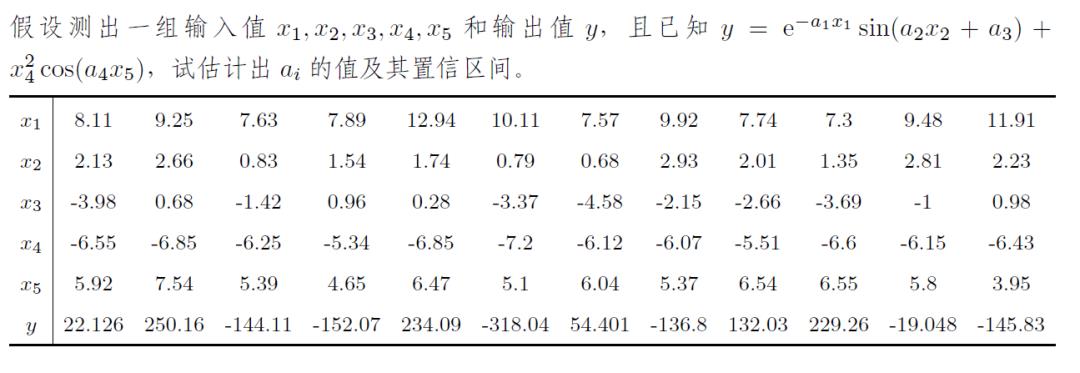
可以用下面的语句得出待定参数ai
>> X=[8.11,9.25,7.63,7.89,12.94,10.11,7.57,9.92,7.74,7.3,9.48,11.91;
2.13,2.66,0.83,1.54,1.74,0.79,0.68,2.93,2.01,1.35,2.81,2.23;
-3.98,0.68,-1.42,0.96,0.28,-3.37,-4.58,-2.15,-2.66,-3.69,-1,0.98;
-6.55,-6.85,-6.25,-5.34,-6.85,-7.2,-6.12,-6.07,-5.51,-6.6,-6.15,-6.43;
5.92,7.54,5.39,4.65,6.47,5.1,6.04,5.37,6.54,6.55,5.8,3.95];
Y=[22.1259,250.1646,-144.1066,-152.066,234.0853,-318.044,54.4014,...
-136.8012,132.0323,229.257,-19.0483,-145.8268];
f=inline('exp(-a(1)*X(1,:)).*sin(a(2)*X(2,:)+X(3,:))+X(4,:).^3.*cos(a(3)*X(5,:))','a','X');
c=lsqcurvefit(f,[1;2;3],X,Y)
Optimization terminated successfully:
Relative function value changing by less than OPTIONS.TolFun
c =
3.08179659583053
11.78076836387161
3.54384055825696
当然也可以由nlinfit() 函数就可以识别其参数
>> X=[8.11,9.25,7.63,7.89,12.94,10.11,7.57,9.92,7.74,7.3,9.48,11.91;
2.13,2.66,0.83,1.54,1.74,0.79,0.68,2.93,2.01,1.35,2.81,2.23;
-3.98,0.68,-1.42,0.96,0.28,-3.37,-4.58,-2.15,-2.66,-3.69,-1,0.98;
-6.55,-6.85,-6.25,-5.34,-6.85,-7.2,-6.12,-6.07,-5.51,-6.6,-6.15,-6.43;
5.92,7.54,5.39,4.65,6.47,5.1,6.04,5.37,6.54,6.55,5.8,3.95]';
Y=[22.1259,250.1646,-144.1066,-152.066,234.0853,-318.044,54.4014,...
-136.8012,132.0323,229.257,-19.0483,-145.8268]';
f=inline('exp(-a(1)*X(:,1)).*sin(a(2)*X(:,2)+X(:,3))+X(:,4).^3.*cos(a(3)*X(:,5))','a','X');
[c,ci]=nlinfit(X,Y,f,[1;2;3])
c =
1.0e+003 *
1.42608044284996
2.45760695798277
0.00354363113884
ci =
1.0e+002 *
-1.26653661438056
2.45201690149177
0.92407037128426
-2.61392947589151
0.43516910883431
-0.51920358880931
-1.36371019475582
0.83244279611730
0.68959652756177
1.30361787474512
-0.49826846521209
-1.08775930008078
Matlab在概率统计中的应用(0006)
问题:
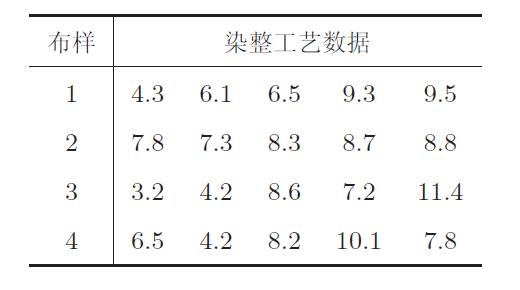
一批由同种原料织成的布,用不同的染整工艺处理,每台进行缩水串试验,目的是考察不同的工艺对布的缩水率是否有显著影响.现采用5 种不同的染整工艺,每种工艺处理4 块布样,测得缩水率的百分数见表1。
【解】
可以得出如下的方差检验结果:
>> A=[4.3,6.1,6.5,9.3,9.5; 7.8,7.3,8.3,8.7,8.8; 3.2,4.2,8.6,7.2,11.4;
6.5,4.2,8.2,10.1,7.8];
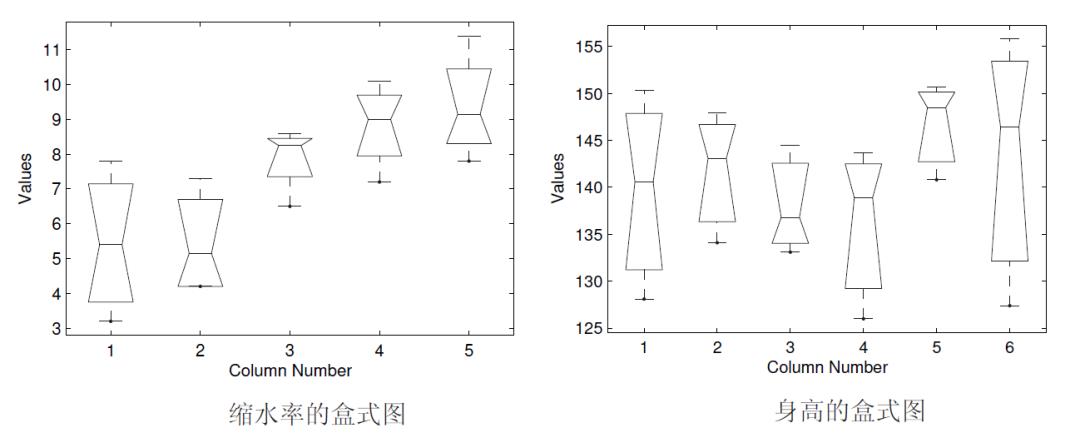
>> [p,tbl,stats]=anova1(A); p,tbl
p =
0.00414899690752
tbl =
'Source' 'SS' 'df' 'MS' 'F' 'Prob>F'
'Columns' [55.1450] [ 4] [13.7863] [6.0617] [0.0041]
'Error' [34.1150] [15] [ 2.2743] [] []
'Total' [89.2600] [19] [] [] []
1 2 3 4 5
类似问题:
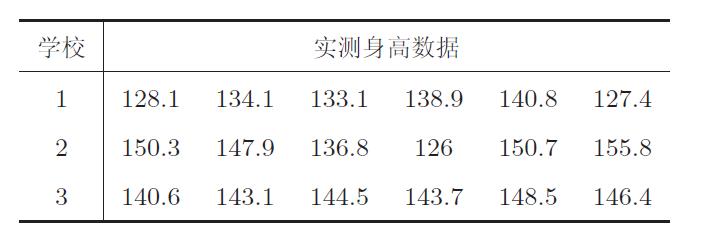
抽查某地区3 所小学五年级男学生的身高由表 2 给出,问该地区这3 所小学五年级男学生的平均身高是否有显著差别(alpha= 0.05)?
【解】
可以得出如下的方差检验结果:
>> A=[128.1,134.1,133.1,138.9,140.8,127.4; 150.3,147.9,136.8,126,150.7,155.8;
140.6,143.1,144.5,143.7,148.5,146.4];
>> [p,tbl,stats]=anova1(A);
p,tbl
p =
0.78379156988812
tbl =
'Source' 'SS' 'df' 'MS' 'F' 'Prob>F'
'Columns' [ 211.3361] [ 5] [42.2672] [0.4813] [0.7838]
'Error' [1.0538e+003] [12] [87.8167] [] []
'Total' [1.2651e+003] [17] [] [] []
以上是关于Matlab在概率统计中的应用问题及解决方案集锦的主要内容,如果未能解决你的问题,请参考以下文章
(建议收藏)matlab在线性代数问题中的计算机求解进阶问题及解决方案集锦
以MATLAB的方式实现微积分问题的计算机求解问题及解决方案集锦
以MATLAB的方式实现微积分问题的计算机求解问题及解决方案集锦