借助 mperf 进行矩阵乘法极致优化
Posted MegEngine
tags:
篇首语:本文由小常识网(cha138.com)小编为大家整理,主要介绍了借助 mperf 进行矩阵乘法极致优化相关的知识,希望对你有一定的参考价值。
作者:旷视 MegEngine 架构师 洪超
前言
单精度矩阵乘法(SGEMM)是非常典型的计算密集型算子,对 SGEMM 的优化也经常被当作算子优化从业人员的练手项目。本文将借助于 mperf,在 ARM A55 cpu 核心上对 SGEMM 的性能进行极致优化,过程中会展示 mperf 辅助性能优化工作的基本逻辑。希望本文的读者对计算机体系结构有一定了解,并且可以补充一些 TMA 的基础概念。另外,关于本文使用的 mperf 工具,更多详细介绍请参见之前的文章 mperf 介绍。
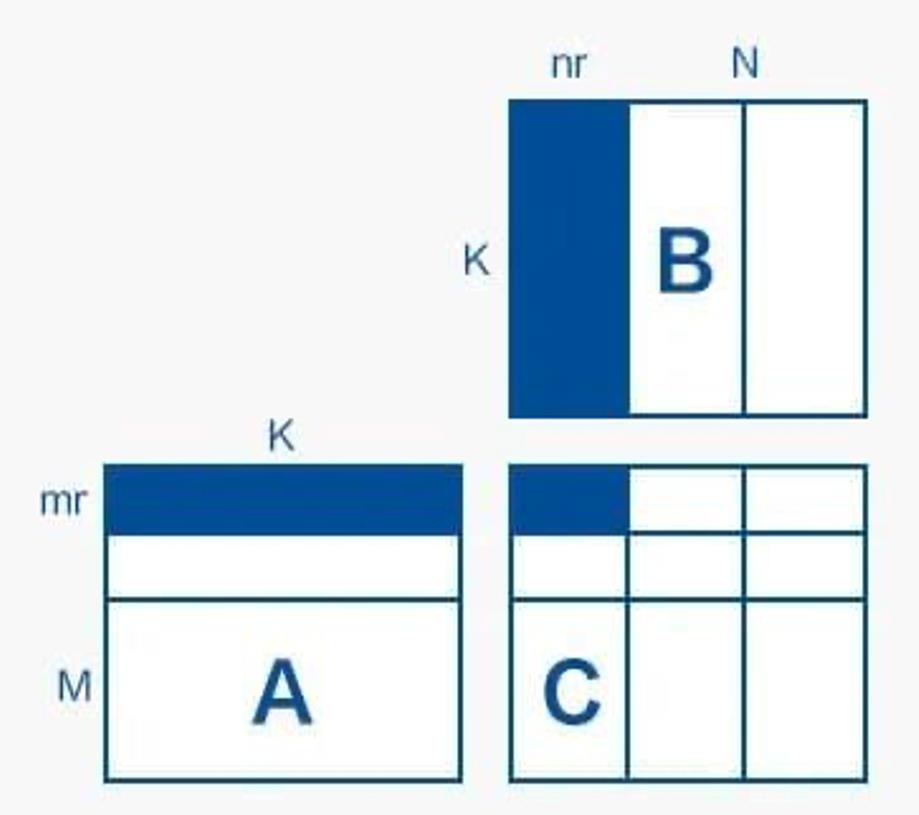
本文需要优化的计算目标是 C=AB,假设矩阵 A 大小为 MK,矩阵 B 大小为 KN,则得到矩阵 C 大小为 MN 。为了后文分块操作的方便,这里假设 M,N 是 4 的倍数,并选择 M=N=K 分别为 100,200,300,500,700,900 的矩阵尺寸,对不同优化版本进行性能测试。本文所有试验代码均在 mperf/apps/cpu_pmu_analysis 目录下。
矩阵乘法优化
寄存器和 FPU 优化——Naive 实现到循环展开
矩阵乘法的 Naive 实现为三层循环计算:
//lda:number of columns of A
//ldb:number of columns of B
//ldc:number of columns of C
#define A(i, j) a[(i)*lda + (j)]
#define B(i, j) b[(i)*ldb + (j)]
#define C(i, j) c[(i)*ldc + (j)]
void my_matmul_naive(int m, int n, int k, float* a, int lda, float* b, int ldb,
              float* c, int ldc)
    int i, j, p;
    for (i = 0; i < m; i++)
        for (j = 0; j < n; j++)
            for (p = 0; p < k; p++)
                C(i, j) = C(i, j) + A(i, p) * B(p, j);
此时,测试 M=N=K 分别为100,200,300 时的 mperf 性能数据见 Naive_mperf , 关于这些测试数据的简单介绍请参见 mperf 测试数据。
测试命令(后文其他优化版本的测试命令不再重复贴出):
First, compile the testcase, using `/android_build.sh -m arm64-v8a`.
Then, copy build_dir/apps/arm_cpu_matmul_naive to your android platform, and run it.
从上面链接的 mperf 数据可以看到 Naive 实现的 GFLOPS 甚至不到 0.5,而 mperf 在 ARM A55 平台实测的峰值浮点算力可以达到 14GFLOPs,显然我们还有很长的路要走。
分析 TMA Level-1 的数据,也即比较 Frontend_Bound、Bad_Speculation、Backend_Bound 和 Retiring 的占比,可以发现占比最高的为 Backend_Bound,约为 50%,据此首先可以判断 Naive 版本的性能瓶颈位于处理器后端。进一步看 TMA Level-2 及以上级别的数据,发现 Backend_Bound 中占比最大的是 Core_Bound ,而 Interlock_Bound 又占 Core_Bound 的 95% 以上,紧接着 Interlock_FPU 又几乎占 Interlock_Bound 的 100%。
由此可得,当前的瓶颈在于 Interlock_FPU,Interlock_FPU 占比大说明浮点计算触发了大量的 pipeline stall。除此之外,我们还观察到 Metric_Neon_Port_Util 为 0,这是因为 Naive 版本没有进行向量计算。
关于如何降低 Interlock_FPU,我们早期基于 mperf 做过验证,证明 unroll 可以有效降低 Interlock_FPU,过程如下:
#define UNROLL_RAW1(cb, v0, a...) \\
    cb(0, ##a)
#define UNROLL_RAW2(cb, v0, a...) \\
    cb(0, ##a) cb(1, ##a)
#define UNROLL_RAW5(cb, v0, a...) \\
    cb(0, ##a) cb(1, ##a) cb(2, ##a) cb(3, ##a) cb(4, ##a)
#define UNROLL_RAW10(cb, v0, a...) \\
    UNROLL_RAW5(cb, v0, ##a)       \\
    cb(5, ##a) cb(6, ##a) cb(7, ##a) cb(8, ##a) cb(9, ##a)
#define UNROLL_RAW20(cb, v0, a...)                                          \\
    UNROLL_RAW10(cb, v0, ##a)                                               \\
    cb(10, ##a) cb(11, ##a) cb(12, ##a) cb(13, ##a) cb(14, ##a) cb(15, ##a) \\
            cb(16, ##a) cb(17, ##a) cb(18, ##a) cb(19, ##a)
#define UNROLL_CALL0(step, cb, v...) UNROLL_RAW##step(cb, 0, ##v)
#define UNROLL_CALL(step, cb, v...) UNROLL_CALL0(step, cb, ##v)
#define THROUGHPUT(cb, func, UNROLL_NUM)                                    \\
    static int func##_throughput_##UNROLL_NUM()                            \\
        asm volatile(                                                       \\
        UNROLL_CALL(UNROLL_NUM, eor)                                        \\
        "mov x0, %x[RUNS]\\n"                                                \\
        "1:\\n"                                                              \\
        UNROLL_CALL(UNROLL_NUM, cb)                                         \\
        "subs  x0, x0, #1 \\n"                                               \\
        "bne 1b \\n"                                                         \\
        :                                                                   \\
        : [RUNS] "r"(mperf::RUNS)                                           \\
        : "cc", "v0", "v1", "v2", "v3", "v4", "v5", "v6", "v7", "v8", "v9", \\
          "v10", "v11", "v12", "v13", "v14", "v15", "v16", "v17", "v18",    \\
          "v19", "x0");                                                     \\
        return mperf::RUNS * UNROLL_NUM;                                    \\

#define cb(i) "fmla v" #i ".4s, v" #i ".4s, v" #i ".4s\\n"
THROUGHPUT(cb, fmla, 20)
THROUGHPUT(cb, fmla, 10)
THROUGHPUT(cb, fmla, 5)
THROUGHPUT(cb, fmla, 2)
THROUGHPUT(cb, fmla, 1)
在这个例子中,分别对不进行循环展开和以粒度为 2、5、10、20 的循环展开的fmla计算进行测试,结果如下:
| UNROLL_NUM:1 | UNROLL_NUM:2 | UNROLL_NUM:5 | UNROLL_NUM:10 | UNROLL_NUM:20 |
|---|---|---|---|---|
| Interlock_FPU : 0.49998 | Interlock_FPU : 0.25727 | Interlock_FPU : 0.02236 | Interlock_FPU : 0.02519 | Interlock_FPU : 0.02681 |
| Metric_GFLOPs_Use : 3.98409 | Metric_GFLOPs_Use : 7.88556 | Metric_GFLOPs_Use : 12.97569 | Metric_GFLOPs_Use : 14.12275 | Metric_GFLOPs_Use : 14.74720 |
通过这个简单的例子我们可以看到,随着循环展开粒度的增加,Interlock_FPU 会逐渐降低,并逐渐趋于稳定。这是因为没有循环展开或循环展开特别小的时候,上一次循环还没有执行完成,下一次循环又要读取相同的寄存器,进而造成寄存器依赖。要消除寄存器依赖,首先要保证循环体中不同条指令使用不同的寄存器,并且尽量保证循环体内指令的条数大于该指令的 latency 和该指令的 throughput 的乘积。以本文在 a55 平台测试 fmla 向量计算为例,fmla的 latency 为 4 个 cycle,并且 a55 处理器后端只有一个 port 可以执行 fmla 向量计算,也即 fmla 的 throughput 为 1,所以要求循环体 fmla 指令数大于 4 * 1 才可以解除寄存器依赖,这也符合上述试验结果的变化情况。
理解上面信息后,我们考虑在 Naive 版本上进行循环展开,并依据 Naive 版本 Metric_Neon_Port_Util 为 0,同时施加 SIMD 优化。具体做法是,先对前面的行列采用 812 展开,对剩余的列采用 84 展开,再对剩余的行先采用 412 展开,最后用 44 展开,期间配合 ARM NEON 指令进行向量化操作。
这里选择 8*12 是为了更充分的利用寄存器资源,是因为 ARM A55 上面有 32 个128 bit 向量寄存器,以及考虑到本文最后 matmul 汇编版本的最内层实现大体如下(注意这里使用的外积计算矩阵乘,具体参见外积算矩阵乘):
- 从 A 矩阵读 8 个 float 到 2 个向量寄存器,此时应该是 8 行里面每行的第一个数。
- 从 B 矩阵读 12个float 到 3 个向量寄存器,应该是 12 列里每列的第一个数。
- 用fmla指令,让 B 的每个 float 分别乘以A的两个向量寄存器,产生 24 个向量结果,也全部存储在寄存器中( 24 个向量寄存器存储 8x12=96 个中间结果)。
采用 8*12 展开之后的代码结构如下:
void my_matmul_unroll(int m, int n, int k, float* a, int lda, float* b, int ldb,
                      float* c, int ldc)
    int i, j;

    for (i = 0; i + 8 <= m; i += 8)
        for (j = 0; j + 12 <= n; j += 12)
            AddDot8x12(k, &A(i, 0), lda, &B(0, j), ldb, &C(i, j), ldc);

        for (; j < n; j += 4)
            AddDot8x4(k, &A(i, 0), lda, &B(0, j), ldb, &C(i, j), ldc);


    if (i != m)
        for (j = 0; j + 12 <= n; j += 12)
            AddDot4x12(k, &A(i, 0), lda, &B(0, j), ldb, &C(i, j), ldc);

        for (; j < n; j += 4)
            AddDot4x4(k, &A(i, 0), lda, &B(0, j), ldb, &C(i, j), ldc);
关于循环展开,可以用一个图来直观地理解,这里 mr=8,nr=12,我们每次用 A 矩阵的 8 * K 的小块和 B 矩阵的 K * 12 小块来计算 C 的一个 8 * 12 小块:
用 mperf 分析 unroll 版本的 matmul 实现,具体数据见[ Unroll_mperf ] (https://www.megengine.org.cn/blog/mperf2#:~:text=Metric_GFLOPs_Use %3A 0.30557-,Unroll_mperf,-M%3DN%3DK)
对比 M,N,K 较小时(注: 在优化寄存器和 FPU 单元利用率的时候可以把问题规模先限制得比较小,减少访存相关 issue 的干扰),Unroll 版本与 Naive 版本的 Interlock_FPU、Metric_Neon_Port_Util 和 GFLOPS:
| loop | unroll | loop | unroll | loop | unroll |
|---|---|---|---|---|---|
| M=N=K=100 | M=N=K=100 | M=N=K=200 | M=N=K=200 | M=N=K=300 | M=N=K=300 |
| Interlock_FPU : 0.41489 | Interlock_FPU : 0.11604 | Interlock_FPU : 0.39121 | Interlock_FPU : 0.11293 | Interlock_FPU : 0.34547 | Interlock_FPU : 0.11227 |
| Metric_Neon_Port_Util : 0.00000 | Metric_Neon_Port_Util : 0.35740 | Metric_Neon_Port_Util : 0.00000 | Metric_Neon_Port_Util : 0.34510 | Metric_Neon_Port_Util : 0.00000 | Metric_Neon_Port_Util : 0.33232 |
| Metric_GFLOPs_Use : 0.36511 | Metric_GFLOPs_Use : 5.73161 | Metric_GFLOPs_Use : 0.34685 | Metric_GFLOPs_Use : 5.50208 | Metric_GFLOPs_Use : 0.30557 | Metric_GFLOPs_Use : 5.24582 |
可以看到循环展开后可以看到 Interlock_FPU 占比下降明显,同时 Metric_Neon_Port_Util 明显上升,而 GFLOPS 指标有了数量级的提高,说明充分利用寄存器资源和提高 FPU 利用率有效提高了程序性能。
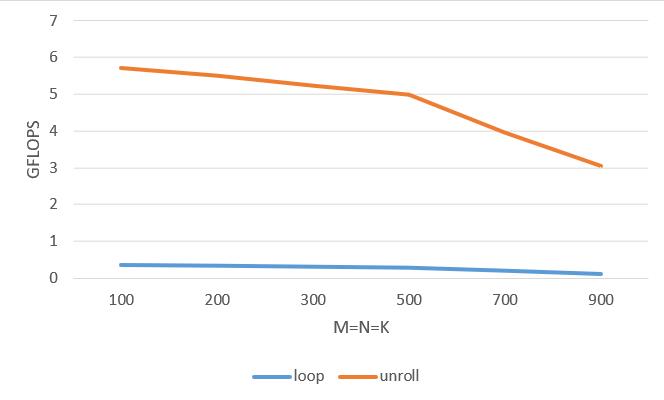
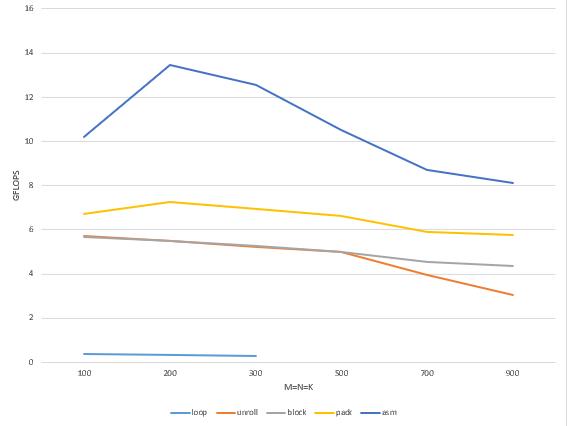
访存优化——分块和 PACK
上图是 Unroll 版本与 Naive 版本在不同矩阵尺寸下的性能对比,可以看到循环展开在矩阵尺寸比较小的情况下,性能提升还是很明显的,但是随着矩阵尺寸增大 unroll 的效果迅速下降。所以现在我们将注意力转移到,如何解决矩阵尺寸增大 GFLOPS 下降的问题。通过分析上节链接的 unroll 版本的 mperf 数据,可以看到,随着矩阵尺寸变大到一定程度,Memory_Bound 占比逐渐接近 50%,替代之前的 Interlock_FPU 成为新的性能瓶颈。而 Memory_Bound 占比高主要是 Load_Cache 造成的,这就指明了我们接下来需要进行访存相关的优化。
分块
之所以矩阵尺寸增加,unroll 版本的性能会下降,主要原因就是数据无法全部驻留在 Cache 中,导致数据频繁地在 Cache 和主存之间换入换出,而处理器对主存的访问是非常昂贵的。为了减少对主存的重复访存,首先我们能想到的就是分块( Unroll 版本中提到的分块是内层分块,目的是优化寄存器和 FPU 的利用率,请注意区分),将分块之后的数据保存在 Cache 中,尽量使处理器发起的访存操作都能命中 cache 中的数据。
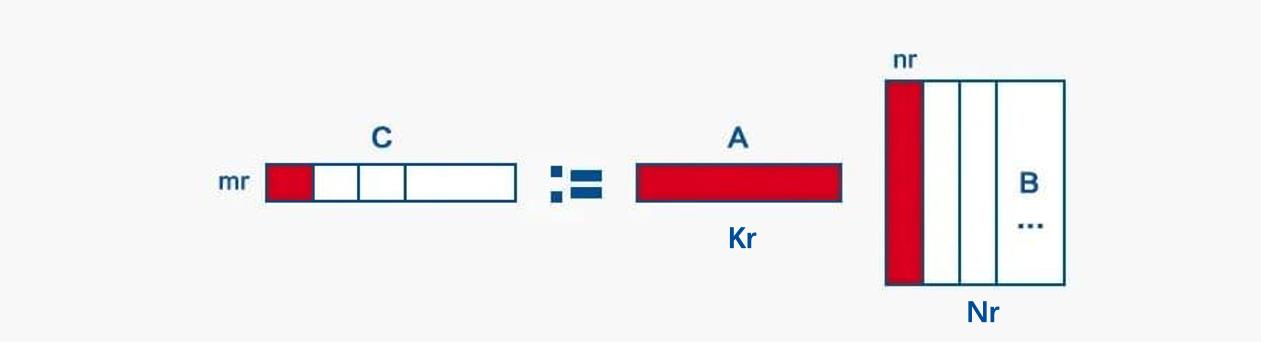
这里我们选择对 N,K 维分别进行 Nr 和 Kr 粒度的分块,结合循环展开部分的逻辑,整体的分块方式即为:外层选取 A 矩阵的 MKr 小块和 B 矩阵的 KrNr 小块,内层再对这两个小块分别进行 mr 行和 nr 列的划分,所以最终内层每次计算 mrKr 的 A 小块和 Krnr 的 B 小块,得到 C 矩阵 mr*nr 小块的部分中间结果。
关于如何确定 Nr 和 Kr 的大小,我们的目标就是使得计算时需要用到的分块可以根据访存频繁的程度保存在 CPU 的各级存储中,原则就是访问越频繁的分块存储在速度越快的存储上,以及保证优先用满速度快的存储资源之后再下溢。针对 matmul, 具体约束条件设定为:
- 将重复访存率最高的 mr*nr 大小的 C 小块保存在访存速度最快的寄存器上(unroll 版本就是这样假设的)。
- 将下图中红色部分(包括计算完一个 mrNr 的 C 行块需要重复访问次数最多的 mr Kr 的 A 行块,内层一次计算迭代需要用到的 Kr*nr 大小的 B 列块)都保存在 L1 中。
- 由于计算完每一个 mrNr 的 C 行块,都需要重复遍历一次整个 KrNr 大小的 B 块,因此希望将 KrNr 大小的 B 块存放在 L2 中,使得每次读取 Krnr 的 B 列块的时候,都是从 L2 中读取。
依据上面的分配策略,并结合 CPU 中的各级存储资源(寄存器数量,L1D 和 L2 )的尺寸,便可以确定最佳的 Nr,Kr 取值:
- 可以根据 CPU 处理器的寄存器数量得到 mr 和 nr 的具体大小,寄存器容量>
mr*nr (unroll 版本就是遵循这个约束条件取的 mr=8,nr=12) - 根据 L1D Cache 的大小结合 mr 和 nr 计算出 Kr,Kr=L1D/(mr+nr)
- 再根据 L2 的大小计算出 B 矩阵中的 Nr,Nr=(L2-L1D)/Kr
在 ARM A55 上,最终得到的 Nr 为 252,Kr 为 256。注意:这里计算得到 Nr 为 256,但是由于我们选择 nr 为 12,因此为了避免不必要的余数处理,选择 Nr 为 12 的倍数简化问题。
Kr/Nr 分块的代码逻辑如下:
#define kc 256
#define nc 252
void my_mamtmul_block(int m, int n, int k, float *a, int lda, float *b, int ldb,
              float *c, int ldc)
  int j, p, pb, ib;
  for (p = 0; p < k; p += kc)
    pb = min(k - p, kc);
    for (j = 0; j < n; j += nc)
      ib = min(n - j, nc);
      InnerKernel(m, ib, pb, &A(0, p), lda, &B(p, j), ldb, &C(0, j), ldc);
添加 Kr/Nr 分块后的 mperf 性能数据见 Block_mperf
对比 Kr/Nr 分块前后以下变化明显的数据:
| unroll | block | unroll | block |
|---|---|---|---|
| M=N=K=700 | M=N=K=700 | M=N=K=900 | M=N=K=900 |
| Memory_Bound : 0.31008 | Memory_Bound : 0.23551 | Memory_Bound : 0.48435 | Memory_Bound : 0.25875 |
| Load_Bound : 0.31003 | Load_Bound : 0.23547 | Load_Bound : 0.48433 | Load_Bound : 0.25870 |
| Load_DTLB : 0.01087 | Load_DTLB : 0.01252 | Load_DTLB : 0.01226 | Load_DTLB : 0.02023 |
| Load_Cache : 0.30802 | Load_Cache : 0.21025 | Load_Cache : 0.45685 | Load_Cache : 0.23244 |
| Store_Bound : 0.00005 | Store_Bound : 0.00004 | Store_Bound : 0.00002 | Store_Bound : 0.00005 |
| Store_TLB : 0.00003 | Store_TLB : 0.00010 | Store_TLB : 0.00002 | Store_TLB : 0.00004 |
| Store_Buffer : 0.00001 | Store_Buffer : 0.00001 | Store_Buffer : 0.00000 | Store_Buffer : 0.00001 |
| Metric_L1D_Miss_Ratio : 0.03458 | Metric_L1D_Miss_Ratio : 0.01878 | Metric_L1D_Miss_Ratio : 0.03515 | Metric_L1D_Miss_Ratio : 0.02113 |
| Metric_L1D_RD_Miss_Ratio : 0.03581 | Metric_L1D_RD_Miss_Ratio : 0.02030 | Metric_L1D_RD_Miss_Ratio : 0.03639 | Metric_L1D_RD_Miss_Ratio : 0.02284 |
| Metric_L1D_WR_Miss_Ratio : 0.00379 | Metric_L1D_WR_Miss_Ratio : 0.00169 | Metric_L1D_WR_Miss_Ratio : 0.00390 | Metric_L1D_WR_Miss_Ratio : 0.00189 |
| Metric_L2D_Miss_Ratio : 0.15673 | Metric_L2D_Miss_Ratio : 0.26215 | Metric_L2D_Miss_Ratio : 0.18801 | Metric_L2D_Miss_Ratio : 0.23144 |
| Metric_L2D_RD_Miss_Ratio : 0.31396 | Metric_L2D_RD_Miss_Ratio : 0.52642 | Metric_L2D_RD_Miss_Ratio : 0.37706 | Metric_L2D_RD_Miss_Ratio : 0.46396 |
| Metric_L2D_WR_Miss_Ratio : 0.00000 | Metric_L2D_WR_Miss_Ratio : 0.00000 | Metric_L2D_WR_Miss_Ratio : 0.00000 | Metric_L2D_WR_Miss_Ratio : 0.00000 |
| Metric_L3D_Miss_Ratio : 0.18870 | Metric_L3D_Miss_Ratio : 0.05405 | Metric_L3D_Miss_Ratio : 0.23623 | Metric_L3D_Miss_Ratio : 0.05183 |
| Metric_L3D_RD_Miss_Ratio : 0.38055 | Metric_L3D_RD_Miss_Ratio : 0.10890 | Metric_L3D_RD_Miss_Ratio : 0.47494 | Metric_L3D_RD_Miss_Ratio : 0.10425 |
| Metric_Load_Port_Util : 0.12046 | Metric_Load_Port_Util : 0.13779 | Metric_Load_Port_Util : 0.09069 | Metric_Load_Port_Util : 0.13191 |
| Metric_Store_Port_Util : 0.07090 | Metric_Store_Port_Util : 0.08126 | Metric_Store_Port_Util : 0.05370 | Metric_Store_Port_Util : 0.07829 |
| Metric_GFLOPs_Use : 3.95044 | Metric_GFLOPs_Use : 4.53463 | Metric_GFLOPs_Use : 3.03964 | Metric_GFLOPs_Use : 4.37174 |
Kr/Nr 分块后可以看到在矩阵较大时进行快速矩阵乘法,GFLOPS 确实上升不少,Load_Cache 和 Metric_L3D_RD_Miss_Ratio 等均有明显下降。这说明 Kr/Nr分块确实大幅减少了对 latency 非常大的系统主存的访问,优化了程序的访存性能。
数据 PACK
分析 Kr/Nr 分块后测得的 mperf 数据,可以看到随着矩阵尺寸变大,性能也能保持相对稳定,没有明显下降。但是此时 mperf 拿到的 TMA 指标显示, Backend_Bound 中的 Memory_Bound 占比依旧很高,性能瓶颈还是停留在访存部分。
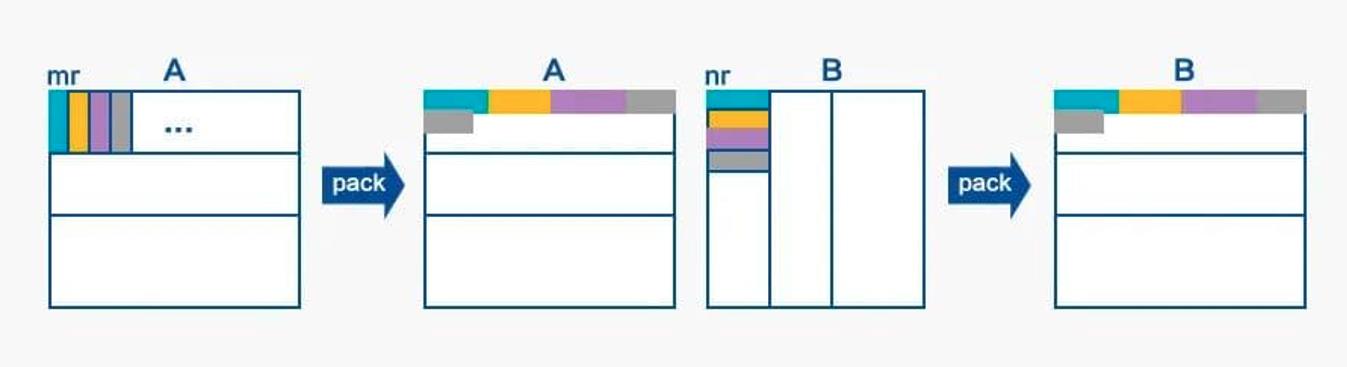
进一步思考,在计算 mrnr 大小的 C 小块的时候,每一次迭代都需要读取 A 矩阵 mr1 的数据,而本文测试的矩阵数据都是行主序,即不同行相同列的数据是内存不连续的,访存不连续就意味着对 Cache 不友好。同样在不同次迭代中,需要读取矩阵 B 中不同行的 1*nr 小块的数据,自然也存在数据读取不连续的情况。考虑到在分块计算 matmul 的逻辑下,A 的所有行块和 B 中的所有列块将被读取多次,因此可以通过对 A 和 B 提前进行数据 PACK,这样只在第一次 PACK 时候对 Cache 不友好,而后面计算的时候多次访问数据均为连续访存,因此收益巨大。
下图说明了对 A/B 矩阵分别 PACK 的过程:
void InnerKernel(int m, int n, int k, float* a, int lda, float* b, int ldb,
                 float* c, int ldc)
    int i, j;
    float packedA[m * k];
    float packedB[k * n];

    for (i = 0; i + 8 <= m; i += 8)
        PackMatrixA_8(k, &A(i, 0), lda, packedA + i * k);
        for (j = 0; j + 12 <= n; j += 12)
            if (0 == i)
                PackMatrixB_12(k, &B(0, j), ldb, packedB + j * k);

            AddDot8x12(k, packedA + i * k, k, packedB + j * k, 12, &C(i, j),
                       ldc);

        for (; j < n; j += 4)
            if (0 == i)
                PackMatrixB_4(k, &B(0, j), ldb, packedB + j * k);

            AddDot8x4(k, packedA + i * k, k, packedB + j * k, 12, &C(i, j),
                      ldc);


    if (i != m)
        PackMatrixA_4(k, &A(i, 0), lda, packedA + i * k);
        for (j = 0; j + 12 <= n; j += 12)
            AddDot4x12(k, packedA + i * k, k, packedB + j * k, 12, &C(i, j),
                       ldc);

        for (; j < n; j += 4)
            AddDot4x4(k, packedA + i * k, k, packedB + j * k, 12, &C(i, j),
                      ldc);
PACK 后的 mperf 性能数据见 Pack_mperf
对比 PACK 前后的数据:
| block | pack | block | pack | block | pack | block | pack | block | pack | block | pack |
|---|---|---|---|---|---|---|---|---|---|---|---|
| M=N=K=100 | M=N=K=100 | M=N=K=200 | M=N=K=200 | M=N=K=300 | M=N=K=300 | M=N=K=500 | M=N=K=500 | M=N=K=700 | M=N=K=700 | M=N=K=900 | M=N=K=900 |
| Load_Cache : 0.04850 | Load_Cache : 0.03037 | Load_Cache : 0.05591 | Load_Cache : 0.01925 | Load_Cache : 0.09417 | Load_Cache : 0.05596 | Load_Cache : 0.16088 | Load_Cache : 0.11704 | Load_Cache : 0.20015 | Load_Cache : 0.20065 | Load_Cache : 0.23572 | Load_Cache : 0.22885 |
| Interlock_FPU : 0.09043 | Interlock_FPU : 0.34918 | Interlock_FPU : 0.08863 | Interlock_FPU : 0.37332 | Interlock_FPU : 0.08732 | Interlock_FPU : 0.36597 | Interlock_FPU : 0.07988 | Interlock_FPU : 0.34384 | Interlock_FPU : 0.07642 | Interlock_FPU : 0.31200 | Interlock_FPU : 0.07156 | Interlock_FPU : 0.30176 |
| Metric_L1D_TLB_Miss_Ratio : 0.00090 | Metric_L1D_TLB_Miss_Ratio : 0.00224 | Metric_L1D_TLB_Miss_Ratio : 0.00483 | Metric_L1D_TLB_Miss_Ratio : 0.00235 | Metric_L1D_TLB_Miss_Ratio : 0.00685 | Metric_L1D_TLB_Miss_Ratio : 0.00294 | Metric_L1D_TLB_Miss_Ratio : 0.01143 | Metric_L1D_TLB_Miss_Ratio : 0.00328 | Metric_L1D_TLB_Miss_Ratio : 0.01573 | Metric_L1D_TLB_Miss_Ratio : 0.00413 | Metric_L1D_TLB_Miss_Ratio : 0.01915 | Metric_L1D_TLB_Miss_Ratio : 0.00511 |
| Metric_L2_TLB_Miss_Ratio : 0.00000 | Metric_L2_TLB_Miss_Ratio : 0.00000 | Metric_L2_TLB_Miss_Ratio : 0.00001 | Metric_L2_TLB_Miss_Ratio : 0.00013 | Metric_L2_TLB_Miss_Ratio : 0.00001 | Metric_L2_TLB_Miss_Ratio : 0.00072 | Metric_L2_TLB_Miss_Ratio : 0.00048 | Metric_L2_TLB_Miss_Ratio : 0.01302 | Metric_L2_TLB_Miss_Ratio : 0.02578 | Metric_L2_TLB_Miss_Ratio : 0.07241 | Metric_L2_TLB_Miss_Ratio : 0.06266 | Metric_L2_TLB_Miss_Ratio : 0.26738 |
| L2D_TLB_REFILL 0.000000 | L2D_TLB_REFILL 0.000000 | L2D_TLB_REFILL 0.200000 | L2D_TLB_REFILL 0.700000 | L2D_TLB_REFILL 1.200000 | L2D_TLB_REFILL 10.800000 | L2D_TLB_REFILL 358.600006 | L2D_TLB_REFILL 956.500000 | L2D_TLB_REFILL 72607.601562 | L2D_TLB_REFILL 16910.800781 | L2D_TLB_REFILL 460042.187500 | L2D_TLB_REFILL 157443.500000 |
| L2D_TLB 910.400024 | L2D_TLB 822.400024 | L2D_TLB 23194.500000 | L2D_TLB 5456.500000 | L2D_TLB 97020.296875 | L2D_TLB 15094.200195 | L2D_TLB 744285.812500 | L2D_TLB 73438.000000 | L2D_TLB 2816898.500000 | L2D_TLB 233527.500000 | L2D_TLB 7341533.500000 | L2D_TLB 588828.312500 |
| Metric_GFLOPs_Use : 6.34394 | Metric_GFLOPs_Use : 7.00634 | Metric_GFLOPs_Use : 6.24761 | Metric_GFLOPs_Use : 7.27444 | Metric_GFLOPs_Use : 5.86449 | Metric_GFLOPs_Use : 6.94621 | Metric_GFLOPs_Use : 5.53592 | Metric_GFLOPs_Use : 6.66007 | Metric_GFLOPs_Use : 5.10062 | Metric_GFLOPs_Use : 5.91676 | Metric_GFLOPs_Use : 4.89490 | Metric_GFLOPs_Use : 5.65741 |
可以看到进行 PACK 优化后 GFLOPS 又有一定幅度的增长。此时可以观察到 L1D_TLB_Miss_Ratio 有所降低,并且在 M=N=K >= 700 时L2D_TLB_REFILL明显降低,说明 PACK 确实可以通过减少缺页的发生,减少 TLB miss,从而提升性能。
pipeline 优化——嵌入汇编
分析 PACK 之后的 mperf 数据,可以发现 Backend_Bound 占比 40% 以上,其中 Core_Bound 类别下的 Interlock_FPU 再次成为性能瓶颈。回想 unroll 版本减少 Interlock_FPU 的思路,是通过循环展开给编译器更大的优化空间,让编译器充分利用寄存器来减少流水线依赖,但编译器也是有局限的。一般来说,编译器考虑到通用性,是很难生成针对特定处理器架构特点的最优汇编实现的( ARM in-order 架构的小核上更是如此)。因此下一步的想法就是优化编译器生成的汇编,通过把内层计算逻辑替换为嵌入式汇编,依据架构特性调整指令选择和指令排布,进一步减少 pipeline 上的依赖和冲突,从而达成降低 Interlock_FPU 的目的。
首先,我们对比了 PACK 版本的 mperf 数据中的 FPU_util 和纯算力测试情况下的 FPU_util,发现 PACK 版本的 FPU_util 相对低了很多。也就是说,PACK 版本的 matmul 对处理器 SIMD 单元的利用率还是有一定提升空间的(下这个判断的一个前提也是考虑到前文已经对 matmul 访存部分优化得很充分了,并且考虑到内层循环中没有分支判断等复杂逻辑,只是比较存粹的访存和计算指令的 interleave。换句话说,汇编优化一般是留到最后进行的)。
其次,我们注意到编译器生成的汇编代码中,数据加载使用的是 ldq 指令(ldq 指的是 armv8 isa 中 128bit load 操作),但是结合上面 FPU_util 数值比理想情况低的观察(会关注 ldq 指令,是因为我们了解到 ARM A55 的访存能力弱,一个 cycle 最多 load 64bit,store 128bit),我们有理由怀疑 ldq 指令的选择可能会造成 pipeline stall。通过查询 ARM A55 trm 手册,我们发现 ldq 在 a55 上需要两个 cycle 才能 issue 出去,并且 ldq 跟 fmla 不能双发射(注: ARM A55 是双发射架构),这就证实了 ldq 会造成计算和访存指令无法双发射,并造成 Metric_FPU_util 数值的下降。进一步,我们发现 ldr,ldx,ins 三种指令都能与 fmla 双发射,且发射周期都是 1 个 cycle,而这三条指令可以组合出 ldq 等价的操作。因此,我们使用 ldr,ldx,ins 指令组合来替换 ldq 指令,就可以提高流水线的满载程度,进而提高性能。
我们用一个小的测试例子来进行验证: 考虑下面两段代码: 优化前,使用 ldq 指令加载数据,代码如下:
asm volatile(
                "fmla v1.4s, v1.4s, v1.s[0]\\n"
                "ld1 v0.4s, [%[b_ptr]]\\n"
                "fmla v2.4s, v2.4s, v2.s[0]\\n"
                "ld1 v7.4s, [%[b_ptr]]\\n"
                "fmla v3.4s, v3.4s, v3.s[0]\\n"
                "fmla v4.4s, v4.4s, v4.s[0]\\n"
                "fmla v5.4s, v5.4s, v5.s[0]\\n"
                "fmla v6.4s, v6.4s, v6.s[0]\\n"
                : [b_ptr] "+r"(b_ptr)
                :
                : "v0", "v1", "v2", "v3", "v4", "v5", "v6", "v7");
优化后,将 ldq 拆分为 ldr,ldx,ins 指令加载数据,代码如下:
asm volatile(
               "fmla v1.4s, v1.4s, v1.s[0]\\n"
               "ldr d0, [%[b_ptr]]\\n"
               "fmla v2.4s, v2.4s, v2.s[0]\\n"
               "ldr x0, [%[b_ptr], #8]\\n"
               "fmla v3.4s, v3.4s, v3.s[0]\\n"
               "ins v0.d[1], x0\\n"
               "fmla v4.4s, v4.4s, v4.s[0]\\n"
               "ldr d7, [%[b_ptr]]\\n"
               "fmla v5.4s, v5.4s, v5.s[0]\\n"
               "ldr x0, [%[b_ptr], #8]\\n"
               "fmla v6.4s, v6.4s, v6.s[0]\\n"
               "ins v7.d[1], x0\\n"
               : [b_ptr] "+r"(b_ptr)
               :
               : "v0", "v1", "v2", "v3", "v4", "v5", "v6", "v7");
我们对优化前和优化后的版本进行测试,对分析 mperf 拿到的数据,看到主要的变化为:
| ldq | ldr+ldr+ins |
|---|---|
| Metric_Load_Port_Util : 0.39650 | Metric_Load_Port_Util : 0.69312 |
| Metric_GFLOPs_Use : 5.00572 | Metric_GFLOPs_Use : 7.70664 |
可以看到Metric_Load_Port_Util 和 Metric_GFLOPs_Use 均提升明显,也就验证了前面的猜想。
因此,在嵌入的汇编代码中,我们应用上面提到的加载指令的替换,测得的 mperf 性能数据见:ASM_mperf
对比分析 PACK 和 ASM 两个版本的 mperf 数据,可以看到 Metric_Neon_Port_Util 和 Metric_Load_Port_Util 均显著上升。
| PACK | ASM | PACK | ASM | PACK | ASM | PACK | ASM | PACK | ASM |
|---|---|---|---|---|---|---|---|---|---|
| M=N=K=200 | M=N=K=200 | M=N=K=300 | M=N=K=300 | M=N=K=500 | M=N=K=500 | M=N=K=700 | M=N=K=700 | M=N=K=900 | M=N=K=900 |
| Bad_Speculation : 0.29156 | Bad_Speculation : 0.13931 | Bad_Speculation : 0.27964 | Bad_Speculation : 0.10896 | Bad_Speculation : 0.26751 | Bad_Speculation : 0.02394 | Bad_Speculation : 0.24406 | Bad_Speculation : 0.07470 | Bad_Speculation : 0.22907 | Bad_Speculation : 0.06565 |
| Branch_Mispredicts : 530.09998 | Branch_Mispredicts : 516.29999 | Branch_Mispredicts : 1718.09998 | Branch_Mispredicts : 1237.50000 | Branch_Mispredicts : 7551.70020 | Branch_Mispredicts : 6101.39990 | Branch_Mispredicts : 22910.50000 | Branch_Mispredicts : 17442.59961 | Branch_Mispredicts : 50927.00000 | Branch_Mispredicts : 37761.50000 |
| Load_Cache : 0.01824 | Load_Cache : 0.02975 | Load_Cache : 0.05483 | Load_Cache : 0.10898 | Load_Cache : 0.10329 | Load_Cache : 0.25344 | Load_Cache : 0.20224 | Load_Cache : 0.38846 | Load_Cache : 0.21719 | Load_Cache : 0.42574 |
| Interlock_FPU : 0.37414 | Interlock_FPU : 0.00000 | Interlock_FPU : 0.36819 | Interlock_FPU : 0.00000 | Interlock_FPU : 0.34176 | Interlock_FPU : 0.00000 | Interlock_FPU : 0.31210 | Interlock_FPU : 0.00000 | Interlock_FPU : 0.30707 | Interlock_FPU : 0.00000 |
| Retiring : 0.30317 | Retiring : 0.79307 | Retiring : 0.28769 | Retiring : 0.74938 | Retiring : 0.26564 | Retiring : 0.64852 | Retiring : 0.23871 | Retiring : 0.50446 | Retiring : 0.23278 | Retiring : 0.47370 |
| LD_Retiring : 0.04036 | LD_Retiring : 0.21852 | LD_Retiring : 0.03691 | LD_Retiring : 0.20725 | LD_Retiring : 0.03349 | LD_Retiring : 0.17772 | LD_Retiring : 0.02966 | LD_Retiring : 0.13824 | LD_Retiring : 0.02869 | LD_Retiring : 0.12980 |
| ST_Retiring : 0.00510 | ST_Retiring : 0.01946 | ST_Retiring : 0.00493 | ST_Retiring : 0.01859 | ST_Retiring : 0.00279 | ST_Retiring : 0.00998 | ST_Retiring : 0.00241 | ST_Retiring : 0.00750 | ST_Retiring : 0.00230 | ST_Retiring : 0.00690 |
| DP_Retiring : 0.02283 | DP_Retiring : 0.03734 | DP_Retiring : 0.02146 | DP_Retiring : 0.03561 | DP_Retiring : 0.01926 | DP_Retiring : 0.02792 | DP_Retiring : 0.01710 | DP_Retiring : 0.02162 | DP_Retiring : 0.01657 | DP_Retiring : 0.02026 |
| ASE_Retiring : 0.22917 | ASE_Retiring : 0.42233 | ASE_Retiring : 0.21917 | ASE_Retiring : 0.39544 | ASE_Retiring : 0.20533 | ASE_Retiring : 0.35224 | ASE_Retiring : 0.18532 | ASE_Retiring : 0.27398 | ASE_Retiring : 0.18116 | ASE_Retiring : 0.25727 |
| VFP_Retiring : 0.22917 | VFP_Retiring : 0.42233 | VFP_Retiring : 0.21917 | VFP_Retiring : 0.39544 | VFP_Retiring : 0.20533 | VFP_Retiring : 0.35224 | VFP_Retiring : 0.18532 | VFP_Retiring : 0.27398 | VFP_Retiring : 0.18116 | VFP_Retiring : 0.25727 |
| Metric_Load_Port_Util : 0.08072 | Metric_Load_Port_Util : 0.43704 | Metric_Load_Port_Util : 0.07381 | Metric_Load_Port_Util : 0.41450 | Metric_Load_Port_Util : 0.06698 | Metric_Load_Port_Util : 0.35545 | Metric_Load_Port_Util : 0.05932 | Metric_Load_Port_Util : 0.27647 | Metric_Load_Port_Util : 0.05737 | Metric_Load_Port_Util : 0.25961 |
| Metric_Neon_Port_Util : 0.45834 | Metric_Neon_Port_Util : 0.84466 | Metric_Neon_Port_Util : 0.43834 | Metric_Neon_Port_Util : 0.79088 | Metric_Neon_Port_Util : 0.41067 | Metric_Neon_Port_Util : 0.70447 | Metric_Neon_Port_Util : 0.37064 | Metric_Neon_Port_Util : 0.54795 | Metric_Neon_Port_Util : 0.36232 | Metric_Neon_Port_Util : 0.51453 |
| Metric_GFLOPs_Use : 7.27027 | Metric_GFLOPs_Use : 13.45224 | Metric_GFLOPs_Use : 6.96883 | Metric_GFLOPs_Use : 12.57732 | Metric_GFLOPs_Use : 6.63430 | Metric_GFLOPs_Use : 10.50762 | Metric_GFLOPs_Use : 5.88770 | Metric_GFLOPs_Use : 8.73145 | Metric_GFLOPs_Use : 5.75827 | Metric_GFLOPs_Use : 8.13339 |
注意到完成汇编优化后,在矩阵大小 M,N,K <= 300 时,GFLOPS 性能已经达到峰值算力的 90% 以上,基本上可以判定较小尺寸的情况下,matmul 在 ARM A55 平台上已经优化到位了。而当 M,N,K 比较大时,依旧有进一步的优化空间。但是考虑到本文的主要目的,是借助 matmul 优化来说明 mperf 可以给性能优化工作带来哪些助益,所以就不继续进一步的优化关工作了。
总结
本文以 ARM A55 平台上的矩阵乘优化为例,详细介绍了如何用 mperf 分析当前实现的性能表现,找到性能瓶颈,进而确定下一步的优化方向,如此反复迭代,最终取得了接近硬件性能峰值的性能表现。本文各个版本 matmul 的性能对比,见下图:
附录
mperf测试数据
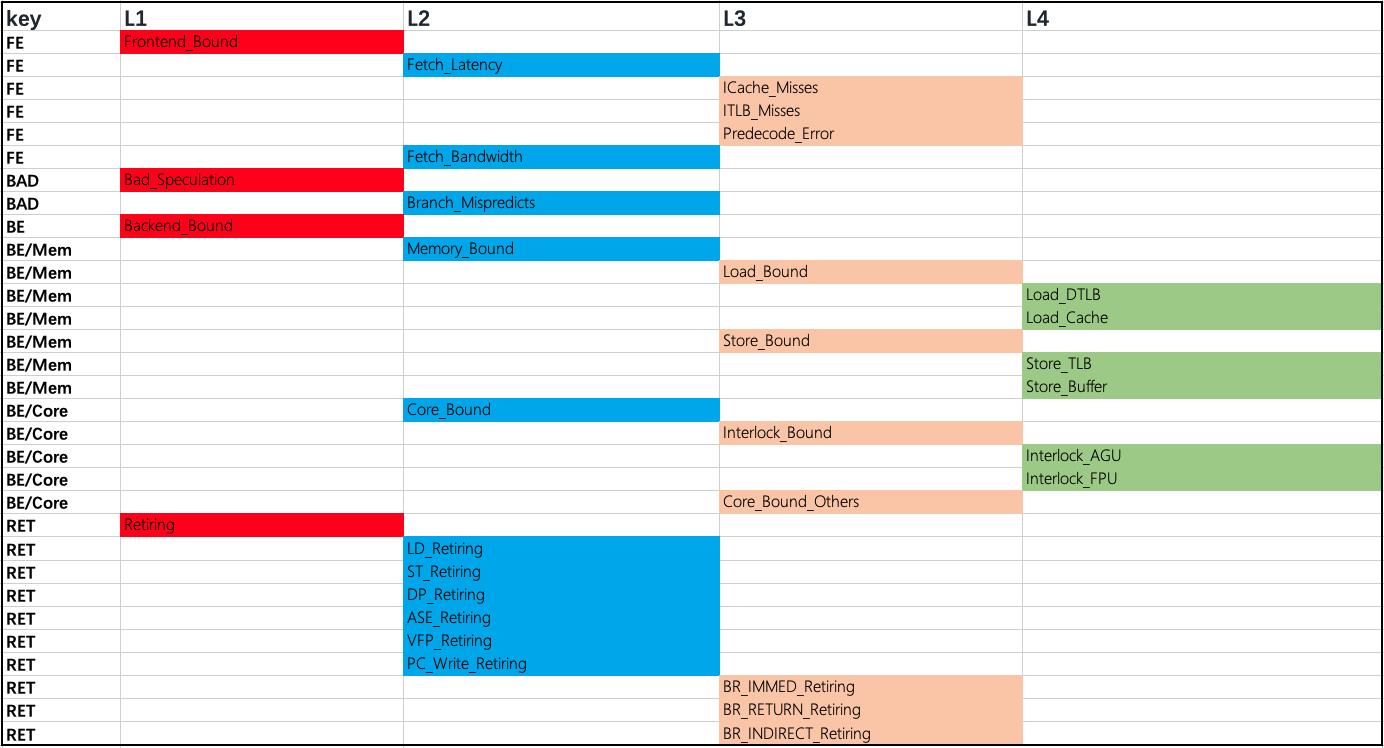
这里贴了不同优化版本的 mperf 测试数据,每一个版本下的测试数据都包含两部分:一部分是非 Metric 前缀命名的,都是 TMA 范式下的指标;另一部分是 Metric 前缀命名的则是非 TMA 范式下,但是对性能优化有辅助作用的指标。这两类指标都是基于 PMU 原始 event 四则运算加工得到的,具体的计算公式请参见 ARM a55 tma 。
另,TMA 范式下的指标呈现多级展开的关系,由于当前 mperf 未提供可视化工具,请参考下图示意的层级关系进行对号入座。并且,请注意附录贴的 TMA 数值均为无量纲百分比。
Naive_mperf
| M=N=K=100 | M=N=K=200 | M=N=K=300 |
|---|---|---|
| Frontend_Bound : 0.00319 | Frontend_Bound : 0.00149 | Frontend_Bound : 0.00088 |
| Fetch_Latency : 0.00319 | Fetch_Latency : 0.00149 | Fetch_Latency : 0.00088 |
| ICache_Misses : 0.00004 | ICache_Misses : 0.00001 | ICache_Misses : 0.00001 |
| ITLB_Misses : 0.00000 | ITLB_Misses : 0.00001 | ITLB_Misses : 0.00000 |
| Predecode_Error : 0.00000 | Predecode_Error : 0.00000 | Predecode_Error : 0.00000 |
| Fetch_Bandwidth : 0.00000 | Fetch_Bandwidth : 0.00000 | Fetch_Bandwidth : 0.00000 |
| Bad_Speculation : 0.16147 | Bad_Speculation : 0.14928 | Bad_Speculation : 0.13111 |
| Branch_Mispredicts : 10112.59961 | Branch_Mispredicts : 40262.80078 | Branch_Mispredicts : 90512.79688 |
| Backend_Bound : 0.46695 | Backend_Bound : 0.50441 | Backend_Bound : 0.56425 |
| Memory_Bound : 0.04070 | Memory_Bound : 0.08765 | Memory_Bound : 0.18501 |
| Load_Bound : 0.04054 | Load_Bound : 0.08667 | Load_Bound : 0.18443 |
| Load_DTLB : 0.00002 | Load_DTLB : 0.03964 | Load_DTLB : 0.05109 |
| Load_Cache : 0.04006 | Load_Cache : 0.04649 | Load_Cache : 0.13333 |
| Store_Bound : 0.00016 | Store_Bound : 0.00098 | Store_Bound : 0.00058 |
| Store_TLB : 0.00000 | Store_TLB : 0.00098 | Store_TLB : 0.00058 |
| Store_Buffer : 0.00017 | Store_Buffer : 0.00000 | Store_Buffer : 0.00000 |
| Core_Bound : 0.42625 | Core_Bound : 0.41676 | Core_Bound : 0.37925 |
| Interlock_Bound : 0.41492 | Interlock_Bound : 0.39122 | Interlock_Bound : 0.34547 |
| Interlock_AGU : 0.00001 | Interlock_AGU : 0.00000 | Interlock_AGU : 0.00000 |
| Interlock_FPU : 0.41489 | Interlock_FPU : 0.39121 | Interlock_FPU : 0.34547 |
| Core_Bound_Others : 0.01133 | Core_Bound_Others : 0.02555 | Core_Bound_Others : 0.03378 |
| Retiring : 0.36839 | Retiring : 0.34483 | Retiring : 0.30376 |
| LD_Retiring : 0.10529 | LD_Retiring : 0.09854 | LD_Retiring : 0.08680 |
| ST_Retiring : 0.00055 | ST_Retiring : 0.00026 | ST_Retiring : 0.00015 |
| DP_Retiring : 0.10854 | DP_Retiring : 0.10006 | DP_Retiring : 0.08769 |
| ASE_Retiring : 0.00000 | ASE_Retiring : 0.00000 | ASE_Retiring : 0.00000 |
| VFP_Retiring : 0.10372 | VFP_Retiring : 0.09780 | VFP_Retiring : 0.08637 |
| PC_Write_Retiring : 0.05242 | PC_Write_Retiring : 0.04916 | PC_Write_Retiring : 0.04334 |
| BR_IMMED_Retiring : 0.05242 | BR_IMMED_Retiring : 0.04916 | BR_IMMED_Retiring : 0.04334 |
| BR_RETURN_Retiring : 0.00000 | BR_RETURN_Retiring : 0.00000 | BR_RETURN_Retiring : 0.00000 |
| BR_INDIRECT_Retiring : 0.00000 | BR_INDIRECT_Retiring : 0.00000 | BR_INDIRECT_Retiring : 0.00000 |
| Metric_L1D_Miss_Ratio : 0.05678 | Metric_L1D_Miss_Ratio : 0.02601 | Metric_L1D_Miss_Ratio : 0.06416 |
| Metric_L1D_RD_Miss_Ratio : 0.05673 | Metric_L1D_RD_Miss_Ratio : 0.02592 | Metric_L1D_RD_Miss_Ratio : 0.06405 |
| Metric_L1D_WR_Miss_Ratio : 0.17102 | Metric_L1D_WR_Miss_Ratio : 0.18698 | Metric_L1D_WR_Miss_Ratio : 0.33719 |
| Metric_L2D_Miss_Ratio : 0.00473 | Metric_L2D_Miss_Ratio : 0.14580 | Metric_L2D_Miss_Ratio : 0.23731 |
| Metric_L2D_RD_Miss_Ratio : 0.01038 | Metric_L2D_RD_Miss_Ratio : 0.29075 | Metric_L2D_RD_Miss_Ratio : 0.47490 |
| Metric_L2D_WR_Miss_Ratio : 0.00116 | Metric_L2D_WR_Miss_Ratio : 0.00014 | Metric_L2D_WR_Miss_Ratio : 0.00004 |
| Metric_L3D_Miss_Ratio : 0.00158 | Metric_L3D_Miss_Ratio : 0.00038 | Metric_L3D_Miss_Ratio : 0.00027 |
| Metric_L3D_RD_Miss_Ratio : 0.00399 | Metric_L3D_RD_Miss_Ratio : 0.00077 | Metric_L3D_RD_Miss_Ratio : 0.00054 |
| Metric_BR_Mispred_Ratio : 0.01000 | Metric_BR_Mispred_Ratio : 0.00501 | Metric_BR_Mispred_Ratio : 0.00334 |
| Metric_L1I_TLB_Miss_Ratio : 0.00000 | Metric_L1I_TLB_Miss_Ratio : 0.00000 | Metric_L1I_TLB_Miss_Ratio : 0.00000 |
| Metric_L1D_TLB_Miss_Ratio : 0.00007 | Metric_L1D_TLB_Miss_Ratio : 0.10279 | Metric_L1D_TLB_Miss_Ratio : 0.15008 |
| Metric_L2_TLB_Miss_Ratio : 0.00000 | Metric_L2_TLB_Miss_Ratio : 0.00000 | Metric_L2_TLB_Miss_Ratio : 0.00000 |
| Metric_ITLB_Table_Walk_Ratio : 0.00000 | Metric_ITLB_Table_Walk_Ratio : 0.00000 | Metric_ITLB_Table_Walk_Ratio : 0.00000 |
| Metric_DTLB_Table_Walk_Ratio : 0.00000 | Metric_DTLB_Table_Walk_Ratio : 0.00000 | Metric_DTLB_Table_Walk_Ratio : 0.00000 |
| Metric_Load_Port_Util : 0.21057 | Metric_Load_Port_Util : 0.19708 | Metric_Load_Port_Util : 0.17360 |
| Metric_Store_Port_Util : 0.00110 | Metric_Store_Port_Util : 0.00052 | Metric_Store_Port_Util : 0.00031 |
| Metric_Neon_Port_Util : 0.00000 | Metric_Neon_Port_Util : 0.00000 | Metric_Neon_Port_Util : 0.00000 |
| Metric_GFLOPs_Use : 0.36511 | Metric_GFLOPs_Use : 0.34685 | Metric_GFLOPs_Use : 0.30557 |
Unroll_mperf
| M=N=K=100 | M=N=K=200 | M=N=K=300 | M=N=K=500 | M=N=K=700 | M=N=K=900 |
|---|---|---|---|---|---|
| Frontend_Bound : 0.00074 | Frontend_Bound : 0.00016 | Frontend_Bound : 0.00010 | Frontend_Bound : 0.00007 | Frontend_Bound : 0.00008 | Frontend_Bound : 0.00006 |
| Fetch_Latency : 0.00074 | Fetch_Latency : 0.00016 | Fetch_Latency : 0.00010 | Fetch_Latency : 0.00007 | Fetch_Latency : 0.00008 | Fetch_Latency : 0.00006 |
| ICache_Misses : 0.00034 | ICache_Misses : 0.00004 | ICache_Misses : 0.00003 | ICache_Misses : 0.00003 | ICache_Misses : 0.00004 | ICache_Misses : 0.00004 |
| ITLB_Misses : 0.00000 | ITLB_Misses : 0.00000 | ITLB_Misses : 0.00000 | ITLB_Misses : 0.00004 | ITLB_Misses : 0.00001 | ITLB_Misses : 0.00001 |
| Predecode_Error : 0.00000 | Predecode_Error : 0.00000 | Predecode_Error : 0.00000 | Predecode_Error : 0.00000 | Predecode_Error : 0.00000 | Predecode_Error : 0.00000 |
| Fetch_Bandwidth : 0.00000 | Fetch_Bandwidth : 0.00000 | Fetch_Bandwidth : 0.00000 | Fetch_Bandwidth : 0.00000 | Fetch_Bandwidth : 0.00000 | Fetch_Bandwidth : 0.00000 |
| Bad_Speculation : 0.47808 | Bad_Speculation : 0.46884 | Bad_Speculation : 0.44958 | Bad_Speculation : 0.43876 | Bad_Speculation : 0.34968 | Bad_Speculation : 0.27817 |
| Branch_Mispredicts : 134.60001 | Branch_Mispredicts : 472.39999 | Branch_Mispredicts : 1017.79999 | Branch_Mispredicts : 2919.89990 | Branch_Mispredicts : 5817.79980 | Branch_Mispredicts : 10082.20020 |
| Backend_Bound : 0.18936 | Backend_Bound : 0.20947 | Backend_Bound : 0.24190 | Backend_Bound : 0.26918 | Backend_Bound : 0.41795 | Backend_Bound : 0.54684 |
| Memory_Bound : 0.04723 | Memory_Bound : 0.07794 | Memory_Bound : 0.10863 | Memory_Bound : 0.14413 | Memory_Bound : 0.31008 | Memory_Bound : 0.48435 |
| Load_Bound : 0.04660 | Load_Bound : 0.07781 | Load_Bound : 0.10861 | Load_Bound : 0.14411 | Load_Bound : 0.31003 | Load_Bound : 0.48433 |
| Load_DTLB : 0.00056 | Load_DTLB : 0.00293 | Load_DTLB : 0.00382 | Load_DTLB : 0.00629 | Load_DTLB : 0.01087 | Load_DTLB : 0.01226 |
| Load_Cache : 0.04502 | Load_Cache : 0.06666 | Load_Cache : 0.09210 | Load_Cache : 0.12851 | Load_Cache : 0.30802 | Load_Cache : 0.45685 |
| Store_Bound : 0.00063 | Store_Bound : 0.00013 | Store_Bound : 0.00002 | Store_Bound : 0.00002 | Store_Bound : 0.00005 | Store_Bound : 0.00002 |
| Store_TLB : 0.00001 | Store_TLB : 0.00001 | Store_TLB : 0.00001 | Store_TLB : 0.00001 | Store_TLB : 0.00003 | Store_TLB : 0.00002 |
| Store_Buffer : 0.00051 | Store_Buffer : 0.00011 | Store_Buffer : 0.00001 | Store_Buffer : 0.00001 | Store_Buffer : 0.00001 | Store_Buffer : 0.00000 |
| Core_Bound : 0.14213 | Core_Bound : 0.13153 | Core_Bound : 0.13327 | Core_Bound : 0.12505 | Core_Bound : 0.10787 | Core_Bound : 0.06249 |
| Interlock_Bound : 0.11653 | Interlock_Bound : 0.11316 | Interlock_Bound : 0.11241 | Interlock_Bound : 0.10508 | Interlock_Bound : 0.08437 | Interlock_Bound : 0.06386 |
| Interlock_AGU : 0.00033 | Interlock_AGU : 0.00016 | Interlock_AGU : 0.00010 | Interlock_AGU : 0.00006 | Interlock_AGU : 0.00003 | Interlock_AGU : 0.00002 |
| Interlock_FPU : 0.11604 | Interlock_FPU : 0.11293 | Interlock_FPU : 0.11227 | Interlock_FPU : 0.10500 | Interlock_FPU : 0.08432 | Interlock_FPU : 0.06384 |
| Core_Bound_Others : 0.02560 | Core_Bound_Others : 0.01837 | Core_Bound_Others : 0.02086 | Core_Bound_Others : 0.01997 | Core_Bound_Others : 0.02350 | Core_Bound_Others : -0.00137 |
| Retiring : 0.33182 | Retiring : 0.32153 | Retiring : 0.30842 | Retiring : 0.29199 | Retiring : 0.23229 | Retiring : 0.17493 |
| LD_Retiring : 0.08541 | LD_Retiring : 0.08371 | LD_Retiring : 0.07969 | LD_Retiring : 0.07575 | LD_Retiring : 0.06023 | LD_Retiring : 0.04534 |
| ST_Retiring : 0.04820 | ST_Retiring : 0.04789 | ST_Retiring : 0.04711 | ST_Retiring : 0.04411 | ST_Retiring : 0.03545 | ST_Retiring : 0.02685 |
| DP_Retiring : 0.01584 | DP_Retiring : 0.01401 | DP_Retiring : 0.01244 | DP_Retiring : 0.01195 | DP_Retiring : 0.00923 | DP_Retiring : 0.00684 |
| ASE_Retiring : 0.17870 | ASE_Retiring : 0.17255 | ASE_Retiring : 0.16616 | ASE_Retiring : 0.15724 | ASE_Retiring : 0.12510 | ASE_Retiring : 0.09421 |
| VFP_Retiring : 0.17870 | VFP_Retiring : 0.17255 | VFP_Retiring : 0.16616 | VFP_Retiring : 0.15724 | VFP_Retiring : 0.12510 | VFP_Retiring : 0.09421 |
| PC_Write_Retiring : 0.00395 | PC_Write_Retiring : 0.00350 | PC_Write_Retiring : 0.00310 | PC_Write_Retiring : 0.00298 | PC_Write_Retiring : 0.00231 | PC_Write_Retiring : 0.00171 |
| BR_IMMED_Retiring : 0.00394 | BR_IMMED_Retiring : 0.00350 | BR_IMMED_Retiring : 0.00310 | BR_IMMED_Retiring : 0.00298 | BR_IMMED_Retiring : 0.00231 | BR_IMMED_Retiring : 0.00171 |
| BR_RETURN_Retiring : 0.00000 | BR_RETURN_Retiring : 0.00000 | BR_RETURN_Retiring : 0.00000 | BR_RETURN_Retiring : 0.00000 | BR_RETURN_Retiring : 0.00000 | BR_RETURN_Retiring : 0.00000 |
| BR_INDIRECT_Retiring : 0.00000 | BR_INDIRECT_Retiring : 0.00000 | BR_INDIRECT_Retiring : 0.00000 | BR_INDIRECT_Retiring : 0.00000 | BR_INDIRECT_Retiring : 0.00000 | BR_INDIRECT_Retiring : 0.00000 |
| Metric_L1D_Miss_Ratio : 0.01625 | Metric_L1D_Miss_Ratio : 0.01791 | Metric_L1D_Miss_Ratio : 0.02479 | Metric_L1D_Miss_Ratio : 0.03246 | Metric_L1D_Miss_Ratio : 0.03458 | Metric_L1D_Miss_Ratio : 0.03515 |
| Metric_L1D_RD_Miss_Ratio : 0.01692 | Metric_L1D_RD_Miss_Ratio : 0.01863 | Metric_L1D_RD_Miss_Ratio : 0.02567 | Metric_L1D_RD_Miss_Ratio : 0.03369 | Metric_L1D_RD_Miss_Ratio : 0.03581 | Metric_L1D_RD_Miss_Ratio : 0.03639 |
| Metric_L1D_WR_Miss_Ratio : 0.00264 | Metric_L1D_WR_Miss_Ratio : 0.00239 | Metric_L1D_WR_Miss_Ratio : 0.00307 | Metric_L1D_WR_Miss_Ratio : 0.00338 | Metric_L1D_WR_Miss_Ratio : 0.00379 | Metric_L1D_WR_Miss_Ratio : 0.00390 |
| Metric_L2D_Miss_Ratio : 0.02740 | Metric_L2D_Miss_Ratio : 0.19737 | Metric_L2D_Miss_Ratio : 0.19336 | Metric_L2D_Miss_Ratio : 0.14853 | Metric_L2D_Miss_Ratio : 0.15673 | Metric_L2D_Miss_Ratio : 0.18801 |
| Metric_L2D_RD_Miss_Ratio : 0.05446 | Metric_L2D_RD_Miss_Ratio : 0.39807 | Metric_L2D_RD_Miss_Ratio : 0.38924 | Metric_L2D_RD_Miss_Ratio : 0.29803 | Metric_L2D_RD_Miss_Ratio : 0.31396 | Metric_L2D_RD_Miss_Ratio : 0.37706 |
| Metric_L2D_WR_Miss_Ratio : 0.00004 | Metric_L2D_WR_Miss_Ratio : 0.00000 | Metric_L2D_WR_Miss_Ratio : 0.00000 | Metric_L2D_WR_Miss_Ratio : 0.00000 | Metric_L2D_WR_Miss_Ratio : 0.00000 | Metric_L2D_WR_Miss_Ratio : 0.00000 |
| Metric_L3D_Miss_Ratio : 0.00000 | Metric_L3D_Miss_Ratio : 0.00010 | Metric_L3D_Miss_Ratio : 0.00160 | Metric_L3D_Miss_Ratio : 0.02646 | Metric_L3D_Miss_Ratio : 0.18870 | Metric_L3D_Miss_Ratio : 0.23623 |
| Metric_L3D_RD_Miss_Ratio : 0.00000 | Metric_L3D_RD_Miss_Ratio : 0.00020 | Metric_L3D_RD_Miss_Ratio : 0.00325 | Metric_L3D_RD_Miss_Ratio : 0.05356 | Metric_L3D_RD_Miss_Ratio : 0.38055 | Metric_L3D_RD_Miss_Ratio : 0.47494 |
| Metric_BR_Mispred_Ratio : 0.01048 | Metric_BR_Mispred_Ratio : 0.00500 | Metric_BR_Mispred_Ratio : 0.00346 | Metric_BR_Mispred_Ratio : 0.00211 | Metric_BR_Mispred_Ratio : 0.00158 | Metric_BR_Mispred_Ratio : 0.00131 |
| Metric_L1I_TLB_Miss_Ratio : 0.00001 | Metric_L1I_TLB_Miss_Ratio : 0.00000 | Metric_L1I_TLB_Miss_Ratio : 0.00000 | Metric_L1I_TLB_Miss_Ratio : 0.00000 | Metric_L1I_TLB_Miss_Ratio : 0.00000 | Metric_L1I_TLB_Miss_Ratio : 0.00000 |
| Metric_L1D_TLB_Miss_Ratio : 0.00087 | Metric_L1D_TLB_Miss_Ratio : 0.00432 | Metric_L1D_TLB_Miss_Ratio : 0.00584 | Metric_L1D_TLB_Miss_Ratio : 0.00984 | Metric_L1D_TLB_Miss_Ratio : 0.01323 | Metric_L1D_TLB_Miss_Ratio : 0.01621 |
| Metric_L2_TLB_Miss_Ratio : 0.00000 | Metric_L2_TLB_Miss_Ratio : 0.00001 | Metric_L2_TLB_Miss_Ratio : 0.00005 | Metric_L2_TLB_Miss_Ratio : 0.00035 | Metric_L2_TLB_Miss_Ratio : 0.02917 | Metric_L2_TLB_Miss_Ratio : 0.04803 |
| Metric_ITLB_Table_Walk_Ratio : 0.00000 | Metric_ITLB_Table_Walk_Ratio : 0.00000 | Metric_ITLB_Table_Walk_Ratio : 0.00000 | Metric_ITLB_Table_Walk_Ratio : 0.00000 | Metric_ITLB_Table_Walk_Ratio : 0.00000 | Metric_ITLB_Table_Walk_Ratio : 0.00000 |
| Metric_DTLB_Table_Walk_Ratio : 0.00000 | Metric_DTLB_Table_Walk_Ratio : 0.00000 | Metric_DTLB_Table_Walk_Ratio : 0.00000 | Metric_DTLB_Table_Walk_Ratio : 0.00000 | Metric_DTLB_Table_Walk_Ratio : 0.00039 | Metric_DTLB_Table_Walk_Ratio : 0.00078 |
| Metric_Load_Port_Util : 0.17082 | Metric_Load_Port_Util : 0.16742 | Metric_Load_Port_Util : 0.15939 | Metric_Load_Port_Util : 0.15151 | Metric_Load_Port_Util : 0.12046 | Metric_Load_Port_Util : 0.09069 |
| Metric_Store_Port_Util : 0.09640 | Metric_Store_Port_Util : 0.09578 | Metric_Store_Port_Util : 0.09422 | Metric_Store_Port_Util : 0.08822 | Metric_Store_Port_Util : 0.07090 | Metric_Store_Port_Util : 0.05370 |
| Metric_Neon_Port_Util : 0.35740 | Metric_Neon_Port_Util : 0.34510 | Metric_Neon_Port_Util : 0.33232 | Metric_Neon_Port_Util : 0.31449 | Metric_Neon_Port_Util : 0.25020 | Metric_Neon_Port_Util : 0.18842 |
| Metric_GFLOPs_Use : 5.73161 | Metric_GFLOPs_Use : 5.50208 | Metric_GFLOPs_Use : 5.24582 | Metric_GFLOPs_Use : 4.97877 | Metric_GFLOPs_Use : 3.95044 | Metric_GFLOPs_Use : 3.03964 |
Block_mperf
| M=N=K=100 | M=N=K=200 | M=N=K=300 | M=N=K=500 | M=N=K=700 | M=N=K=900 |
|---|---|---|---|---|---|
| Frontend_Bound : 0.00050 | Frontend_Bound : 0.00014 | Frontend_Bound : 0.00013 | Frontend_Bound : 0.00013 | Frontend_Bound : 0.00016 | Frontend_Bound : 0.00014 |
| Fetch_Latency : 0.00050 | Fetch_Latency : 0.00014 | Fetch_Latency : 0.00013 | Fetch_Latency : 0.00013 | Fetch_Latency : 0.00016 | Fetch_Latency : 0.00014 |
| ICache_Misses : 0.00028 | ICache_Misses : 0.00004 | ICache_Misses : 0.00003 | ICache_Misses : 0.00005 | ICache_Misses : 0.00004 | ICache_Misses : 0.00003 |
| ITLB_Misses : 0.00001 | ITLB_Misses : 0.00000 | ITLB_Misses : 0.00000 | ITLB_Misses : 0.00004 | ITLB_Misses : 0.00002 | ITLB_Misses : 0.00001 |
| Predecode_Error : 0.00000 | Predecode_Error : 0.00000 | Predecode_Error : 0.00000 | Predecode_Error : 0.00000 | Predecode_Error : 0.00000 | Predecode_Error : 0.00000 |
| Fetch_Bandwidth : 0.00000 | Fetch_Bandwidth : 0.00000 | Fetch_Bandwidth : 0.00000 | Fetch_Bandwidth : 0.00000 | Fetch_Bandwidth : 0.00000 | Fetch_Bandwidth : 0.00000 |
| Bad_Speculation : 0.48119 | Bad_Speculation : 0.46947 | Bad_Speculation : 0.46177 | Bad_Speculation : 0.42173 | Bad_Speculation : 0.39518 | Bad_Speculation : 0.37718 |
| Branch_Mispredicts : 134.60001 | Branch_Mispredicts : 471.60001 | Branch_Mispredicts : 1535.69995 | Branch_Mispredicts : 7051.50000 | Branch_Mispredicts : 20853.69922 | Branch_Mispredicts : 46702.60156 |
| Backend_Bound : 0.18770 | Backend_Bound : 0.20837 | Backend_Bound : 0.22868 | Backend_Bound : 0.28475 | Backend_Bound : 0.33877 | Backend_Bound : 0.36801 |
| Memory_Bound : 0.05038 | Memory_Bound : 0.07006 | Memory_Bound : 0.09758 | Memory_Bound : 0.14764 | Memory_Bound : 0.23551 | Memory_Bound : 0.25875 |
| Load_Bound : 0.04975 | Load_Bound : 0.06994 | Load_Bound : 0.09756 | Load_Bound : 0.14762 | Load_Bound : 0.23547 | Load_Bound : 0.25870 |
| Load_DTLB : 0.00056 | Load_DTLB : 0.00291 | Load_DTLB : 0.00397 | Load_DTLB : 0.00647 | Load_DTLB : 0.01252 | Load_DTLB : 0.02023 |
| Load_Cache : 0.04751 | Load_Cache : 0.06600 | Load_Cache : 0.08761 | Load_Cache : 0.13781 | Load_Cache : 0.21025 | Load_Cache : 0.23244 |
| Store_Bound : 0.00063 | Store_Bound : 0.00012 | Store_Bound : 0.00002 | Store_Bound : 0.00002 | Store_Bound : 0.00004 | Store_Bound : 0.00005 |
| Store_TLB : 0.00001 | Store_TLB : 0.00001 | Store_TLB : 0.00001 | Store_TLB : 0.00002 | Store_TLB : 0.00010 | Store_TLB : 0.00004 |
| Store_Buffer : 0.00060 | Store_Buffer : 0.00011 | Store_Buffer : 0.00001 | Store_Buffer : 0.00001 | Store_Buffer : 0.00001 | Store_Buffer : 0.00001 |
| Core_Bound : 0.13732 | Core_Bound : 0.13830 | Core_Bound : 0.13109 | Core_Bound : 0.13711 | Core_Bound : 0.10326 | Core_Bound : 0.10926 |
| Interlock_Bound : 0.11610 | Interlock_Bound : 0.11333 | Interlock_Bound : 0.11263 | Interlock_Bound : 0.10552 | Interlock_Bound : 0.09648 | Interlock_Bound : 0.09286 |
| Interlock_AGU : 0.00033 | Interlock_AGU : 0.00016 | Interlock_AGU : 0.00020 | Interlock_AGU : 0.00011 | Interlock_AGU : 0.00011 | Interlock_AGU : 0.00011 |
| Interlock_FPU : 0.11562 | Interlock_FPU : 0.11310 | Interlock_FPU : 0.11235 | Interlock_FPU : 0.10536 | Interlock_FPU : 0.09633 | Interlock_FPU : 0.09271 |
| Core_Bound_Others : 0.02122 | Core_Bound_Others : 0.02498 | Core_Bound_Others : 0.01846 | Core_Bound_Others : 0.03159 | Core_Bound_Others : 0.00678 | Core_Bound_Others : 0.01639 |
| Retiring : 0.33061 | Retiring : 0.32202 | Retiring : 0.30943 | Retiring : 0.29339 | Retiring : 0.26590 | Retiring : 0.25467 |
| LD_Retiring : 0.08509 | LD_Retiring : 0.08384 | LD_Retiring : 0.07989 | LD_Retiring : 0.07608 | LD_Retiring : 0.06889 | LD_Retiring : 0.06596 |
| ST_Retiring : 0.04802 | ST_Retiring : 0.04796 | ST_Retiring : 0.04731 | ST_Retiring : 0.04436 | ST_Retiring : 0.04063 | ST_Retiring : 0.03914 |
| DP_Retiring : 0.01579 | DP_Retiring : 0.01404 | DP_Retiring : 0.01267 | DP 以上是关于借助 mperf 进行矩阵乘法极致优化的主要内容,如果未能解决你的问题,请参考以下文章 |