H5+echarts模拟全国程序员可视化大数据附完整源码
Posted java李杨勇
tags:
篇首语:本文由小常识网(cha138.com)小编为大家整理,主要介绍了H5+echarts模拟全国程序员可视化大数据附完整源码相关的知识,希望对你有一定的参考价值。
🍅 作者主页:Java李杨勇
🍅 简介:Java领域优质创作者🏆、【java李杨勇】公号作者✌ 简历模板、学习资料、面试题库【关注我,都给你】
🍅文末免费获取源码🍅
临近学期结束,还是毕业设计,你还在做java程序网络编程,期末作业,前端网页设计、老师的作业要求觉得大了吗?不知道毕业设计该怎么办?网页功能的数量是否太多?没有合适的类型或系统?等等。这里,你想解决的问题,在这专栏👇🏻👇🏻👇🏻👇🏻
都能满足你的需求。原始Jsp、SSM、SpringBoot、以及html+CSS+JS页面设计, web大学生网页设计作业源码等等都可以参考得到解决。话不多说直接程序员全国分布大数据统计来举例
动图演示:文末白嫖源码
&&&&

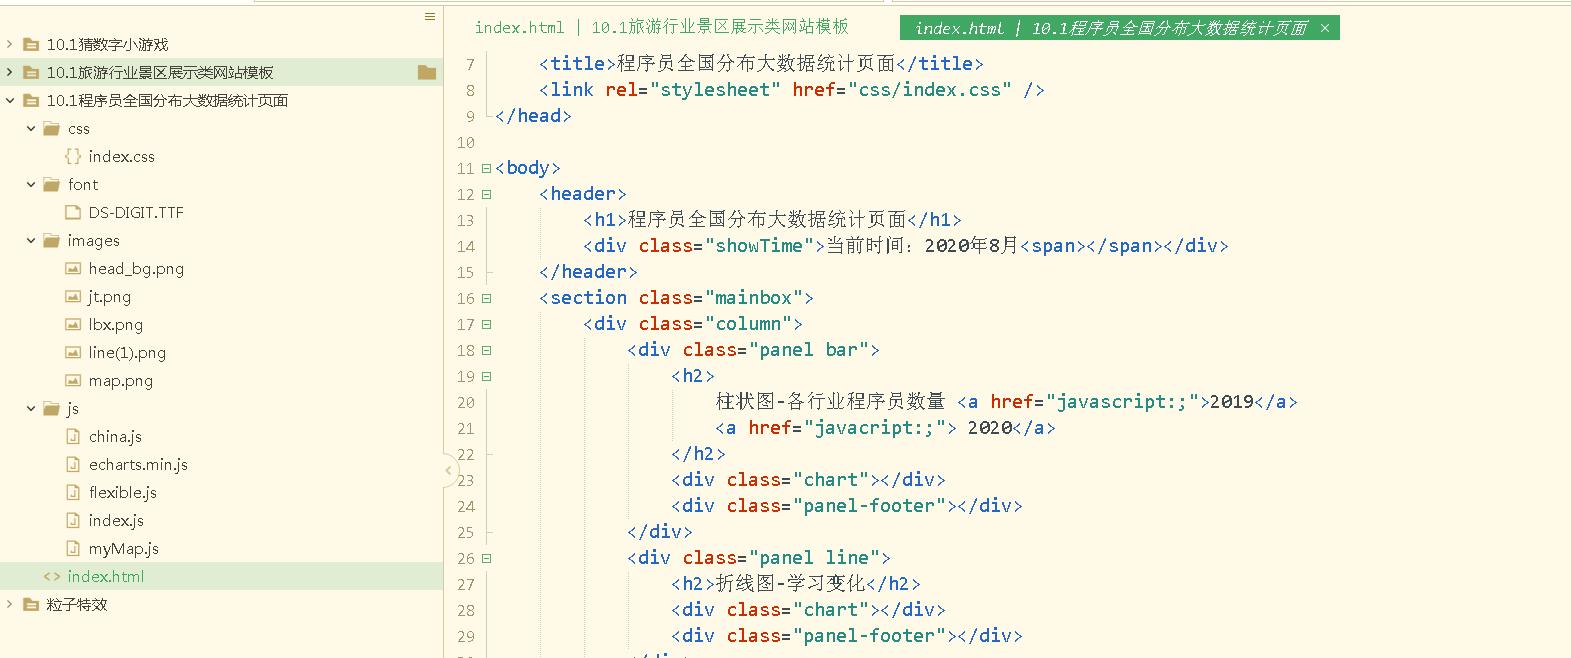
代码目录

主要代码实现:
主页index.html布局
  <header>
        <h1>程序员全国分布大数据统计页面</h1>
        <div class="showTime">当前时间:2020年8月<span></span></div>
    </header>
    <section class="mainbox">
        <div class="column">
            <div class="panel bar">
                <h2>
                    柱状图-各行业程序员数量 <a href="javascript:;">2019</a>
                    <a href="javacript:;"> 2020</a>
                </h2>
                <div class="chart"></div>
                <div class="panel-footer"></div>
            </div>
            <div class="panel line">
                <h2>折线图-学习变化</h2>
                <div class="chart"></div>
                <div class="panel-footer"></div>
            </div>
            <div class="panel pie">
                <h2>饼形图-工程师年龄分布</h2>
                <div class="chart"></div>
                <div class="panel-footer"></div>
            </div>
        </div>
        <div class="column">
            <div class="no">
                <div class="no-hd">
                    <ul>
                        <li>125811</li>
                        <li>104563</li>
                    </ul>
                </div>
                <div class="no-bd">
                    <ul>
                        <li>程序员需求人数</li>
                        <li>程序员供应人数</li>
                    </ul>
                </div>
            </div>
            <div class="map">
                <div class="chart"></div>
                <div class="map1"></div>
                <div class="map2"></div>
                <div class="map3"></div>
            </div>
        </div>
        <div class="column">
            <div class="panel bar1">
                <h2>柱状图-开发技能</h2>
                <div class="chart"></div>
                <div class="panel-footer"></div>
            </div>
            <div class="panel line1">
                <h2>折线图-公司人员流动</h2>
                <div class="chart"></div>
                <div class="panel-footer"></div>
            </div>
            <div class="panel pie1">
                <h2>饼形图-各地区程序员占比</h2>
                <div class="chart"></div>
                <div class="panel-footer"></div>
            </div>
        </div>
时间格式化处理:
(function(fn) {
            fn();
            setInterval(fn, 1000);
        })(function() {
            var dt = new Date();
            document.querySelector(".showTime span").innerHTML =
                dt.getDate() + "日-" +
                dt.getHours() + "时" +
                dt.getMinutes() + "分" +
                dt.getSeconds() + "秒";
        });
// 柱状图1模块 --数据模拟--指定配置和数据:
  // 实例化对象
    var myChart = echarts.init(document.querySelector(".bar .chart"));
    // 指定配置和数据
    var option = {
        color: ["#2f89cf"],
        tooltip: {
            trigger: "axis",
            axisPointer: {
                // 坐标轴指示器,坐标轴触发有效
                type: "shadow" // 默认为直线,可选为:'line' | 'shadow'
            }
        },
        grid: {
            left: "0%",
            top: "10px",
            right: "0%",
            bottom: "4%",
            containLabel: true
        },
        xAxis: [{
            type: "category",
            data: [
                "旅游行业",
                "教育培训",
                "游戏行业",
                "医疗行业",
                "电商行业",
                "社交行业",
                "金融行业"
            ],
            axisTick: {
                alignWithLabel: true
            },
            axisLabel: {
                textStyle: {
                    color: "rgba(255,255,255,.6)",
                    fontSize: "12"
                }
            },
            axisLine: {
                show: false
            }
        }],
        yAxis: [{
            type: "value",
            axisLabel: {
                textStyle: {
                    color: "rgba(255,255,255,.6)",
                    fontSize: "12"
                }
            },
            axisLine: {
                lineStyle: {
                    color: "rgba(255,255,255,.1)"
                    // width: 1,
                    // type: "solid"
                }
            },
            splitLine: {
                lineStyle: {
                    color: "rgba(255,255,255,.1)"
                }
            }
        }],
        series: [{
            name: "直接访问",
            type: "bar",
            barWidth: "35%",
            data: [200, 300, 300, 900, 1500, 1200, 600],
            itemStyle: {
                barBorderRadius: 5
            }
        }]
    };
页面css布局:
body {
font-family: Arial, Helvetica, sans-serif;
margin: 0;
padding: 0;
background-repeat: no-repeat;
background-color: #06164A;
background-size: cover;
/* 行高是å—体1.15å€ */
line-height: 1.15;
}
header {
position: relative;
height: 1.25rem;
background: url(../images/head_bg.png) no-repeat top center;
background-size: 100% 100%;
}
header h1 {
font-size: 0.475rem;
color: #fff;
text-align: center;
line-height: 1rem;
}
header .showTime {
position: absolute;
top: 0;
right: 0.375rem;
line-height: 0.9375rem;
font-size: 0.25rem;
color: rgba(255, 255, 255, 0.7);
}
.mainbox {
min-width: 1024px;
max-width: 1920px;
padding: 0.125rem 0.125rem 0;
display: flex;
}
.mainbox .column {
flex: 3;
}
.mainbox .column:nth-child(2) {
flex: 5;
margin: 0 0.125rem 0.1875rem;
overflow: hidden;
}
.panel {
position: relative;
height: 3.875rem;
border: 1px solid rgba(25, 186, 139, 0.17);
background: rgba(255, 255, 255, 0.04) url(../images/line\\(1\\).png);
padding: 0 0.1875rem 0.5rem;
margin-bottom: 0.1875rem;
}
.panel::before {
position: absolute;
top: 0;
left: 0;
content: "";
width: 10px;
height: 10px;
border-top: 2px solid #02a6b5;
border-left: 2px solid #02a6b5;
border-radius: 20%;
}作品来自于网络收集、侵权立删
获取完整源码:
大家点赞、收藏、关注、评论啦 、查看下方👇🏻👇🏻👇🏻微信公众号获取👇🏻👇🏻👇🏻
打卡 文章 更新 74/ 100天
专栏推荐阅读:
以上是关于H5+echarts模拟全国程序员可视化大数据附完整源码的主要内容,如果未能解决你的问题,请参考以下文章
