Python实现DBScan
Posted 格格巫 MMQ!!
tags:
篇首语:本文由小常识网(cha138.com)小编为大家整理,主要介绍了Python实现DBScan相关的知识,希望对你有一定的参考价值。
运行环境
Pyhton3
numpy(科学计算包)
matplotlib(画图所需,不画图可不必)
计算过程
st=>start: 开始
e=>end: 结束
op1=>operation: 读入数据
cond=>condition: 是否还有未分类数据
op2=>operation: 找一未分类点扩散
op3=>operation: 输出结果
st->op1->op2->cond
cond(yes)->op2
cond(no)->op3->e
输入样例
/* 788points.txt */
15.55,28.65
14.9,27.55
14.45,28.35
14.15,28.8
13.75,28.05
13.35,28.45
13,29.15
13.45,27.5
13.6,26.5
12.8,27.35
12.4,27.85
12.3,28.4
12.2,28.65
13.4,25.1
12.95,25.95
代码实现
-- coding: utf-8 --
author = ‘Wsine’
import numpy as np
import matplotlib.pyplot as plt
import math
import time
UNCLASSIFIED = False
NOISE = 0
def loadDataSet(fileName, splitChar=’\\t’):
“”"
输入:文件名
输出:数据集
描述:从文件读入数据集
“”"
dataSet = []
with open(fileName) as fr:
for line in fr.readlines():
curline = line.strip().split(splitChar)
fltline = list(map(float, curline))
dataSet.append(fltline)
return dataSet
def dist(a, b):
“”"
输入:向量A, 向量B
输出:两个向量的欧式距离
“”"
return math.sqrt(np.power(a - b, 2).sum())
def eps_neighbor(a, b, eps):
“”"
输入:向量A, 向量B
输出:是否在eps范围内
“”"
return dist(a, b) < eps
def region_query(data, pointId, eps):
“”"
输入:数据集, 查询点id, 半径大小
输出:在eps范围内的点的id
“”"
nPoints = data.shape[1]
seeds = []
for i in range(nPoints):
if eps_neighbor(data[:, pointId], data[:, i], eps):
seeds.append(i)
return seeds
def expand_cluster(data, clusterResult, pointId, clusterId, eps, minPts):
“”"
输入:数据集, 分类结果, 待分类点id, 簇id, 半径大小, 最小点个数
输出:能否成功分类
“”"
seeds = region_query(data, pointId, eps)
if len(seeds) < minPts: # 不满足minPts条件的为噪声点
clusterResult[pointId] = NOISE
return False
else:
clusterResult[pointId] = clusterId # 划分到该簇
for seedId in seeds:
clusterResult[seedId] = clusterId
	while len(seeds) > 0: # 持续扩张
		currentPoint = seeds[0]
		queryResults = region_query(data, currentPoint, eps)
		if len(queryResults) >= minPts:
			for i in range(len(queryResults)):
				resultPoint = queryResults[i]
				if clusterResult[resultPoint] == UNCLASSIFIED:
					seeds.append(resultPoint)
					clusterResult[resultPoint] = clusterId
				elif clusterResult[resultPoint] == NOISE:
					clusterResult[resultPoint] = clusterId
		seeds = seeds[1:]
	return True
def dbscan(data, eps, minPts):
“”"
输入:数据集, 半径大小, 最小点个数
输出:分类簇id
“”"
clusterId = 1
nPoints = data.shape[1]
clusterResult = [UNCLASSIFIED] * nPoints
for pointId in range(nPoints):
point = data[:, pointId]
if clusterResult[pointId] == UNCLASSIFIED:
if expand_cluster(data, clusterResult, pointId, clusterId, eps, minPts):
clusterId = clusterId + 1
return clusterResult, clusterId - 1
def plotFeature(data, clusters, clusterNum):
nPoints = data.shape[1]
matClusters = np.mat(clusters).transpose()
fig = plt.figure()
scatterColors = [‘black’, ‘blue’, ‘green’, ‘yellow’, ‘red’, ‘purple’, ‘orange’, ‘brown’]
ax = fig.add_subplot(111)
for i in range(clusterNum + 1):
colorSytle = scatterColors[i % len(scatterColors)]
subCluster = data[:, np.nonzero(matClusters[:, 0].A == i)]
ax.scatter(subCluster[0, :].flatten().A[0], subCluster[1, :].flatten().A[0], c=colorSytle, s=50)
def main():
dataSet = loadDataSet(‘788points.txt’, splitChar=’,’)
dataSet = np.mat(dataSet).transpose()
# print(dataSet)
clusters, clusterNum = dbscan(dataSet, 2, 15)
print("cluster Numbers = ", clusterNum)
# print(clusters)
plotFeature(dataSet, clusters, clusterNum)
if name == ‘main’:
start = time.clock()
main()
end = time.clock()
print(‘finish all in %s’ % str(end - start))
plt.show()
输出样例
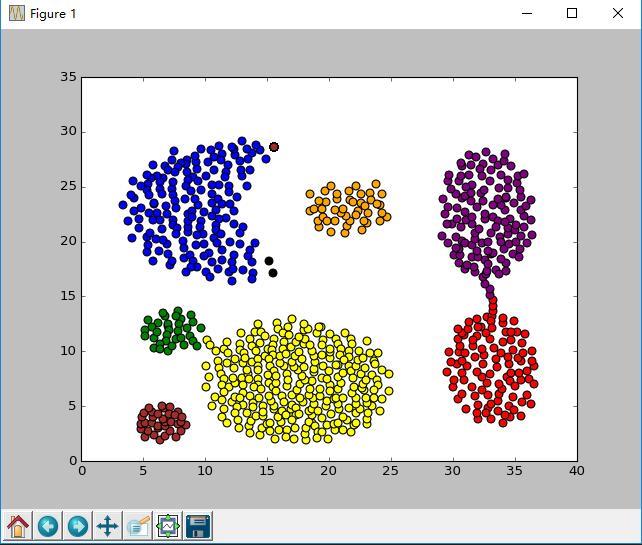
cluster Numbers = 7
finish all in 32.712135628590794

以上是关于Python实现DBScan的主要内容,如果未能解决你的问题,请参考以下文章
⭐K-Means和DBSCAN聚类算法——理论结合代码的实现