机器学习 梯度下降代码
Posted Jozky86
tags:
篇首语:本文由小常识网(cha138.com)小编为大家整理,主要介绍了机器学习 梯度下降代码相关的知识,希望对你有一定的参考价值。
C1_W1_Lab05_Gradient_Descent_Soln Last Checkpoint
import math, copy
import numpy as np
import matplotlib.pyplot as plt
plt.style.use('./deeplearning.mplstyle')
from lab_utils_uni import plt_house_x, plt_contour_wgrad, plt_divergence, plt_gradients

# 加载数据集
x_train = np.array([1.0, 2.0])   #features
y_train = np.array([300.0, 500.0])   #target value


# 计算cost的函数
def compute_cost(x, y, w, b):
    m = x.shape[0]
    cost = 0

    for i in range(m):
        f_wb = w * x[i] + b
        cost = cost + (f_wb - y[i]) ** 2
    total_cost = 1 / (2 * m) * cost

    return total_cost

#梯度下降计算
def compute_gradient(x, y, w, b):
    """
    Computes the gradient for linear regression
    Args:
      x (ndarray (m,)): Data, m examples
      y (ndarray (m,)): target values
      w,b (scalar)    : model parameters
    Returns
      dj_dw (scalar): The gradient of the cost w.r.t. the parameters w
      dj_db (scalar): The gradient of the cost w.r.t. the parameter b
     """

    # Number of training examples
    m = x.shape[0]
    dj_dw = 0
    dj_db = 0

    for i in range(m):
        f_wb = w * x[i] + b
        dj_dw_i = (f_wb - y[i]) * x[i] #新的w
        dj_db_i = f_wb - y[i] #新的b
        dj_db += dj_db_i #更新b
        dj_dw += dj_dw_i #更新w
    dj_dw = dj_dw / m
    dj_db = dj_db / m

    return dj_dw, dj_db
#绘制梯度下降情况
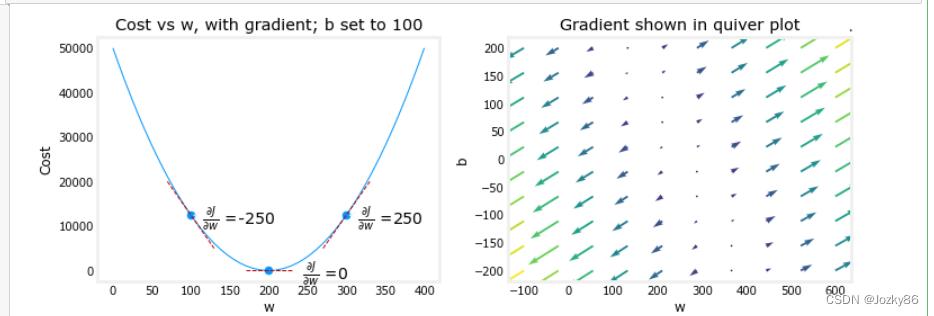
plt_gradients(x_train,y_train, compute_cost, compute_gradient)
plt.show()

#梯度下降函数
def gradient_descent(x, y, w_in, b_in, alpha, num_iters, cost_function, gradient_function):
    """
    Performs gradient descent to fit w,b. Updates w,b by taking
    num_iters gradient steps with learning rate alpha

    Args:
      x (ndarray (m,))  : Data, m examples
      y (ndarray (m,))  : target values
      w_in,b_in (scalar): initial values of model parameters
      alpha (float):     Learning rate
      num_iters (int):   number of iterations to run gradient descent
      cost_function:     function to call to produce cost
      gradient_function: function to call to produce gradient

    Returns:
      w (scalar): Updated value of parameter after running gradient descent
      b (scalar): Updated value of parameter after running gradient descent
      J_history (List): History of cost values
      p_history (list): History of parameters [w,b]
      """

    w = copy.deepcopy(w_in) # avoid modifying global w_in
    # An array to store cost J and w's at each iteration primarily for graphing later
    J_history = []
    p_history = []
    b = b_in
    w = w_in

    for i in range(num_iters):
        # Calculate the gradient and update the parameters using gradient_function
        dj_dw, dj_db = gradient_function(x, y, w , b)

        # Update Parameters using equation (3) above
        b = b - alpha * dj_db
        w = w - alpha * dj_dw

        # Save cost J at each iteration
        if i<100000:      # prevent resource exhaustion
            J_history.append( cost_function(x, y, w , b))
            p_history.append([w,b])
        # Print cost every at intervals 10 times or as many iterations if < 10
        if i% math.ceil(num_iters/10) == 0:
            print(f"Iteration i:4: Cost J_history[-1]:0.2e ",
                  f"dj_dw: dj_dw: 0.3e, dj_db: dj_db: 0.3e  ",
                  f"w: w: 0.3e, b:b: 0.5e")

    return w, b, J_history, p_history #return w and J,w history for graphing
#不同的迭代次数反应cost情况,以及w和b值的变化
# initialize parameters
w_init = 0
b_init = 0
# some gradient descent settings
iterations = 10000
tmp_alpha = 1.0e-2
# run gradient descent
w_final, b_final, J_hist, p_hist = gradient_descent(x_train ,y_train, w_init, b_init, tmp_alpha,
                                                    iterations, compute_cost, compute_gradient)
print(f"(w,b) found by gradient descent: (w_final:8.4f,b_final:8.4f)")

#输出情况
Iteration    0: Cost 7.93e+04  dj_dw: -6.500e+02, dj_db: -4.000e+02   w:  6.500e+00, b: 4.00000e+00
Iteration 1000: Cost 3.41e+00  dj_dw: -3.712e-01, dj_db:  6.007e-01   w:  1.949e+02, b: 1.08228e+02
Iteration 2000: Cost 7.93e-01  dj_dw: -1.789e-01, dj_db:  2.895e-01   w:  1.975e+02, b: 1.03966e+02
Iteration 3000: Cost 1.84e-01  dj_dw: -8.625e-02, dj_db:  1.396e-01   w:  1.988e+02, b: 1.01912e+02
Iteration 4000: Cost 4.28e-02  dj_dw: -4.158e-02, dj_db:  6.727e-02   w:  1.994e+02, b: 1.00922e+02
Iteration 5000: Cost 9.95e-03  dj_dw: -2.004e-02, dj_db:  3.243e-02   w:  1.997e+02, b: 1.00444e+02
Iteration 6000: Cost 2.31e-03  dj_dw: -9.660e-03, dj_db:  1.563e-02   w:  1.999e+02, b: 1.00214e+02
Iteration 7000: Cost 5.37e-04  dj_dw: -4.657e-03, dj_db:  7.535e-03   w:  1.999e+02, b: 1.00103e+02
Iteration 8000: Cost 1.25e-04  dj_dw: -2.245e-03, dj_db:  3.632e-03   w:  2.000e+02, b: 1.00050e+02
Iteration 9000: Cost 2.90e-05  dj_dw: -1.082e-03, dj_db:  1.751e-03   w:  2.000e+02, b: 1.00024e+02
(w,b) found by gradient descent: (199.9929,100.0116)
# 绘制
# plot cost versus iteration
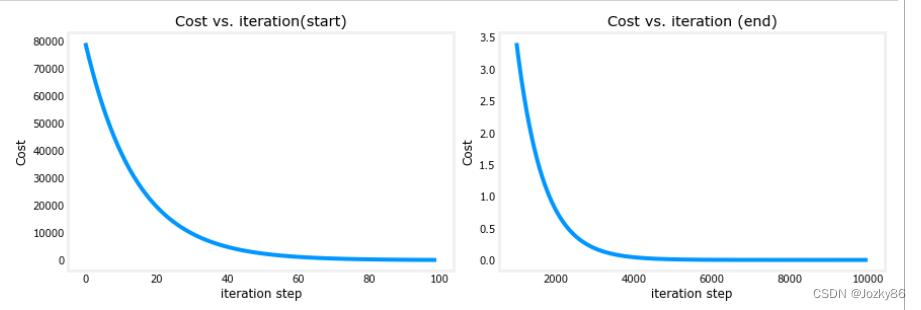
fig, (ax1, ax2) = plt.subplots(1, 2, constrained_layout=True, figsize=(12,4))
ax1.plot(J_hist[:100])#绘制前100个数据
ax2.plot(1000 + np.arange(len(J_hist[1000:])), J_hist[1000:])#绘制从1000开始往后的数据
ax1.set_title("Cost vs. iteration(start)");  ax2.set_title("Cost vs. iteration (end)")
ax1.set_ylabel('Cost')            ;  ax2.set_ylabel('Cost')
ax1.set_xlabel('iteration step')  ;  ax2.set_xlabel('iteration step')
plt.show()
np.arange返回一个有终点和起点的固定步长的排列(可理解为一个等差数组)。
ax2.plot(1000 + np.arange(len(J_hist[1000:])), J_hist[1000:]):横坐标是1000 + np.arange(len(J_hist[1000:])),纵坐标是J_hist[1000:]

#输出不同大小的房子预测的价格
print(f"1000 sqft house prediction w_final*1.0 + b_final:0.1f Thousand dollars")
print(f"1200 sqft house prediction w_final*1.2 + b_final:0.1f Thousand dollars")
print(f"2000 sqft house prediction w_final*2.0 + b_final:0.1f Thousand dollars")

输出情况
1000 sqft house prediction 300.0 Thousand dollars
1200 sqft house prediction 340.0 Thousand dollars
2000 sqft house prediction 500.0 Thousand dollars
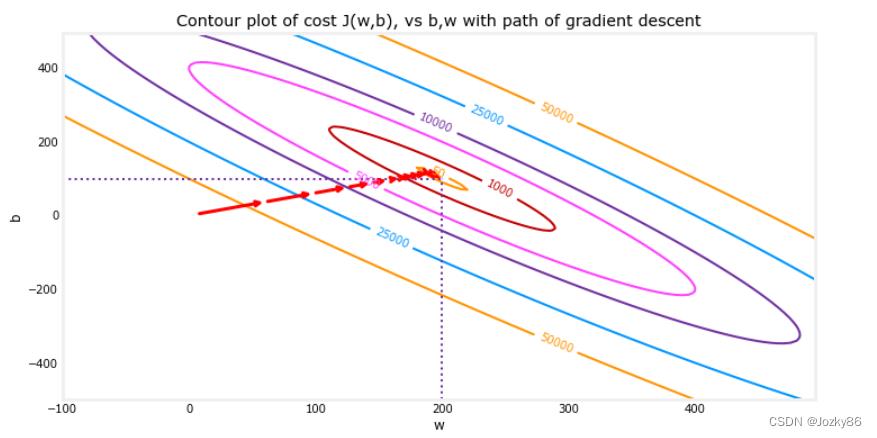
#绘制cost J(w,b)的梯度下降的路径(以等高线的形式展现)
fig, ax = plt.subplots(1,1, figsize=(12, 6))
plt_contour_wgrad(x_train, y_train, p_hist, ax)

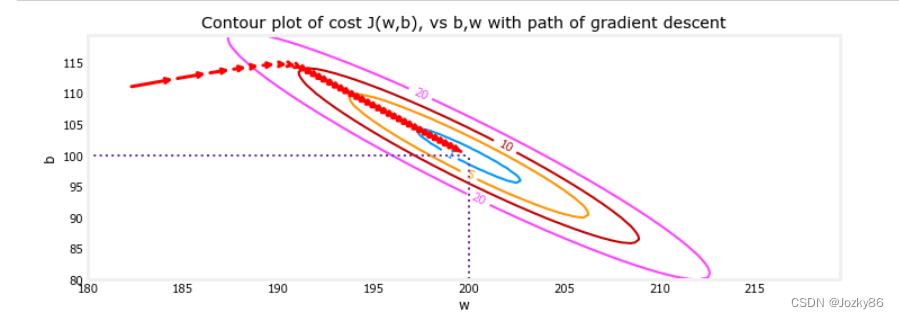
fig, ax = plt.subplots(1,1, figsize=(12, 4))
plt_contour_wgrad(x_train, y_train, p_hist, ax, w_range=[180, 220, 0.5], b_range=[80, 120, 0.5],
            contours=[1,5,10,20],resolution=0.5)

#初始化参数后的迭代情况,tmp_alpha 设置为 8.0e-1
# initialize parameters
w_init = 0
b_init = 0
# set alpha to a large value
iterations = 10
tmp_alpha = 8.0e-1
# run gradient descent
w_final, b_final, J_hist, p_hist = gradient_descent(x_train ,y_train, w_init, b_init, tmp_alpha,
                                                    iterations, compute_cost, compute_gradient)
Iteration    0: Cost 2.58e+05  dj_dw: -6.500e+02, dj_db: -4.000e+02   w:  5.200e+02, b: 3.20000e+02
Iteration    1: Cost 7.82e+05  dj_dw:  1.130e+03, dj_db:  7.000e+02   w: -3.840e+02, b:-2.40000e+02
Iteration    2: Cost 2.37e+06  dj_dw: -1.970e+03, dj_db: -1.216e+03   w:  1.192e+03, b: 7.32800e+02
Iteration    3: Cost 7.19e+06  dj_dw:  3.429e+03, dj_db:  2.121e+03   w: -1.551e+03, b:-9.63840e+02
Iteration    4: Cost 2.18e+07  dj_dw: -5.974e+03, dj_db: -3.691e+03   w:  3.228e+03, b: 1.98886e+03
Iteration    5: Cost 6.62e+07  dj_dw:  1.040e+04, dj_db:  6.431e+03   w: -5.095e+03, b:-3.15579e+03
Iteration    6: Cost 2.01e+08  dj_dw: -1.812e+04, dj_db: -1.120e+04   w:  9.402e+03, b: 5.80237e+03
Iteration    7: Cost 6.09e+08  dj_dw:  3.156e+04, dj_db:  1.950e+04   w: -1.584e+04, b:-9.80139e+03
Iteration    8: Cost 1.85e+09  dj_dw: -5.496e+04, dj_db: -3.397e+04   w:  2.813e+04, b: 1.73730e+04
Iteration    9: Cost 5.60e+09  dj_dw:  9.572e+04, dj_db:  5.916e+04   w: -4.845e+04, b:-2.99567e+04
#当学习率过高时的cost预估情况
plt_divergence(p_hist, J_hist,x_train, y_train)
plt.show()
这里出现错误:OverflowError: Python int too large to convert to C long
目前还没搞清楚什么情况
以上是关于机器学习 梯度下降代码的主要内容,如果未能解决你的问题,请参考以下文章