时域积分与频域积分 实现及对比
Posted 大G霸
tags:
篇首语:本文由小常识网(cha138.com)小编为大家整理,主要介绍了时域积分与频域积分 实现及对比相关的知识,希望对你有一定的参考价值。
玩陀螺仪的都会遇到一个问题就是,陀螺仪输出的是角速度和线加速度。怎么把加速度转化成位移就值得研究一下。
首先我们讲一下傅立叶变换,傅立叶本身就是一个线性积分变换。主要是将信号在时域和频域中进行变换。因为我们相信任何一个信号都可以分解成sin函数。sin函数的频率,振幅可以组合成很多的信号形式。
傅立叶变换的数学公式是这样的。
简单的有一个示意动画就可以说明问题。
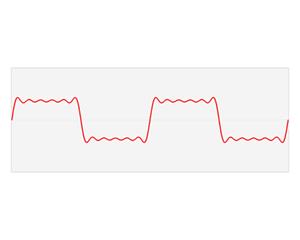
经过傅立叶变换,我们所谓的频域积分也都是基于sin函数的积分。
傅立叶函数有个积分性质,当积分函数进行傅立叶变换的时候有下面这个特性
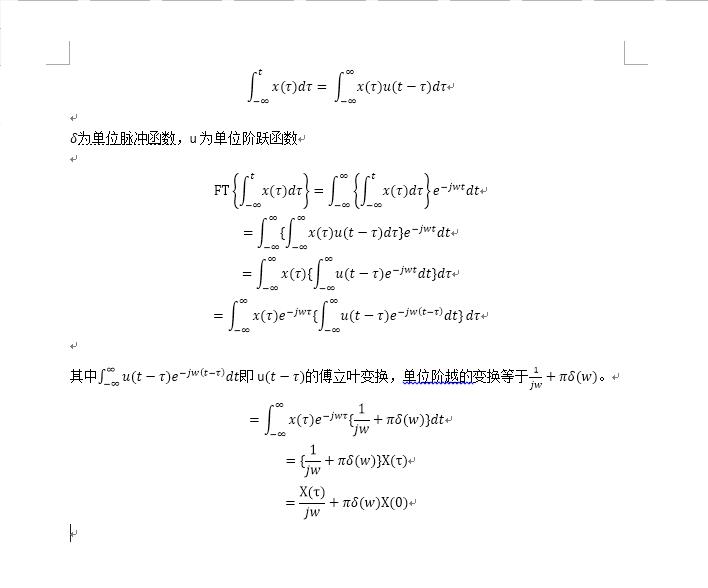
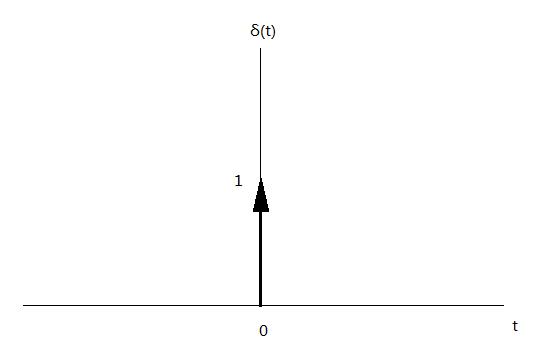
其中单位脉冲函数是这样的
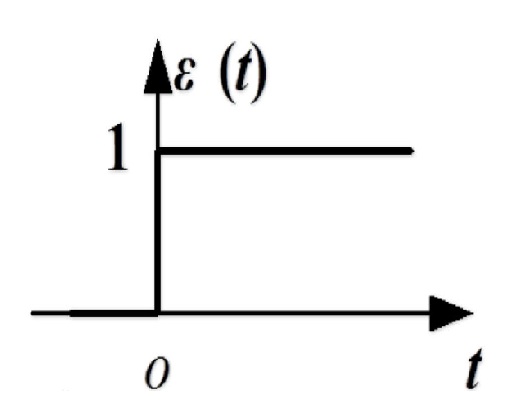
其中单位阶跃函数表现是这样的,
所以一个函数的积分的傅立叶变换应该等于

用matlab进行验证,程序来源参考见尾部,
clc;
clear;

load(\'walk3.1.txt\');


time =[];
for i=0:1193
    time = [time;i];
end

signal = sin(0.01*time*pi);
figure
plot(signal)

%y = walk3_1(:,6);
y = signal;
velocity =[];
for i=1:1194
    velocity =[velocity;(sum(y(1:i)))];
end
distance = [];
for i=1:1194
    distance =[distance;(sum(velocity(1:i)))];
end
figure;
subplot(2,1,1)
plot(velocity)
subplot(2,1,2)
plot(distance)
title(\'time domain - velocity -distance \')

figure;
z = fft(y);
z1 = fftshift(z);
abs1 = abs(z);
abs2 = abs1(1:1194/2+1);
abs3 = abs(z1);
f = (0:1193);
subplot(3,1,1)
plot(y)
subplot(3,1,2)
plot(abs1)
subplot(3,1,3)
plot(abs3)
title(\'fft - original - fft_abs -fftshift+abs \')
L = numel(y);
T = L;
df= 1/T;

if ~mod(L,2)
    f = df*(-L/2:L/2-1);
else
    f = df*(-(L-1)/2:(L-1)/2);
end

w = 2*pi*f;
for i = 1:numel(z1)
    z3(i) = z1(i)*(-1i)/w(i)+z1(i);
end
yvel = ifft(ifftshift(z3),\'symmetric\');
z4 = fftshift(fft(velocity));
for i = 1:numel(z4)
    z5(i) = z4(i)*(-1i)/w(i)+z4(i);
end
ydis = ifft(ifftshift(z5),\'symmetric\');
iomegaOutVel = iomega(signal,1,3,2);
figure
hold on
grid on
plot(velocity)
plot(yvel)
plot(iomegaOutVel)
title(\'Frequency domain - velocity - fft+velocity \')
figure
hold on
grid on
plot(distance)
plot(ydis)
title(\'Frequency domain - distance - fft+distance \')

iomegaOutDis = iomega(velocity,1,2,1);

plot(iomegaOutDis)
其中有一个iomega函数是一个是一个自定义的函数
function dataout =  iomega(datain, dt, datain_type, dataout_type)
%%%%%%%%%%%%%%%%%%%%%%%%%%%%%%%%%%%%%%%%%%%%%%%%%%%%%%%%%%%%%%%%%%%%%%%%%%%
%%%%%%%%%%%%%%%%%%%%%%%%%%%%%%%%%%%%%%%%%%%%%%%%%%%%%%%%%%%%%%%%%%%%%%%%%%%
%%%%%%%%%%%%%%%%%%%%%%%%%%%%%%%%%%%%%%%%%%%%%%%%%%%%%%%%%%%%%%%%%%%%%%%%%%%
%
%   IOMEGA is a MATLAB script for converting displacement, velocity, or
%   acceleration time-series to either displacement, velocity, or
%   acceleration times-series. The script takes an array of waveform data
%   (datain), transforms into the frequency-domain in order to more easily
%   convert into desired output form, and then converts back into the time
%   domain resulting in output (dataout) that is converted into the desired
%   form.
%
%   Variables:
%   ----------
%
%   datain       =   input waveform data of type datain_type
%
%   dataout      =   output waveform data of type dataout_type
%
%   dt           =   time increment (units of seconds per sample)
%
%                    1 - Displacement
%   datain_type  =   2 - Velocity
%                    3 - Acceleration
%
%                    1 - Displacement
%   dataout_type =   2 - Velocity
%                    3 - Acceleration
%
%
%%%%%%%%%%%%%%%%%%%%%%%%%%%%%%%%%%%%%%%%%%%%%%%%%%%%%%%%%%%%%%%%%%%%%%%%%%%
%%%%%%%%%%%%%%%%%%%%%%%%%%%%%%%%%%%%%%%%%%%%%%%%%%%%%%%%%%%%%%%%%%%%%%%%%%%
%%%%%%%%%%%%%%%%%%%%%%%%%%%%%%%%%%%%%%%%%%%%%%%%%%%%%%%%%%%%%%%%%%%%%%%%%%%
%   Make sure that datain_type and dataout_type are either 1, 2 or 3
if (datain_type < 1 || datain_type > 3)
    error(\'Value for datain_type must be a 1, 2 or 3\');
elseif (dataout_type < 1 || dataout_type > 3)
    error(\'Value for dataout_type must be a 1, 2 or 3\');
end
%   Determine Number of points (next power of 2), frequency increment
%   and Nyquist frequency
N = 2^nextpow2(max(size(datain)));
df = 1/(N*dt);
Nyq = 1/(2*dt);
%   Save frequency array
iomega_array = 1i*2*pi*(-Nyq : df : Nyq-df);
iomega_exp = dataout_type - datain_type;
%   Pad datain array with zeros (if needed)
size1 = size(datain,1);
size2 = size(datain,2);
if (N-size1 ~= 0 && N-size2 ~= 0)
    if size1 > size2
        datain = vertcat(datain,zeros(N-size1,1));
    else
        datain = horzcat(datain,zeros(1,N-size2));
    end
end
%   Transform datain into frequency domain via FFT and shift output (A)
%   so that zero-frequency amplitude is in the middle of the array
%   (instead of the beginning)
A = fft(datain);
A = fftshift(A);
%   Convert datain of type datain_type to type dataout_type
for j = 1 : N
    if iomega_array(j) ~= 0
        A(j) = A(j) * (iomega_array(j) ^ iomega_exp);
    else
        A(j) = complex(0.0,0.0);
    end
end
%   Shift new frequency-amplitude array back to MATLAB format and
%   transform back into the time domain via the inverse FFT.
A = ifftshift(A);
datain = ifft(A);
%   Remove zeros that were added to datain in order to pad to next
%   biggerst power of 2 and return dataout.
if size1 > size2
    dataout = real(datain(1:size1,size2));
else
    dataout = real(datain(size1,1:size2));
end
return
其中以sin函数为输入信号,做两次积分得到位移
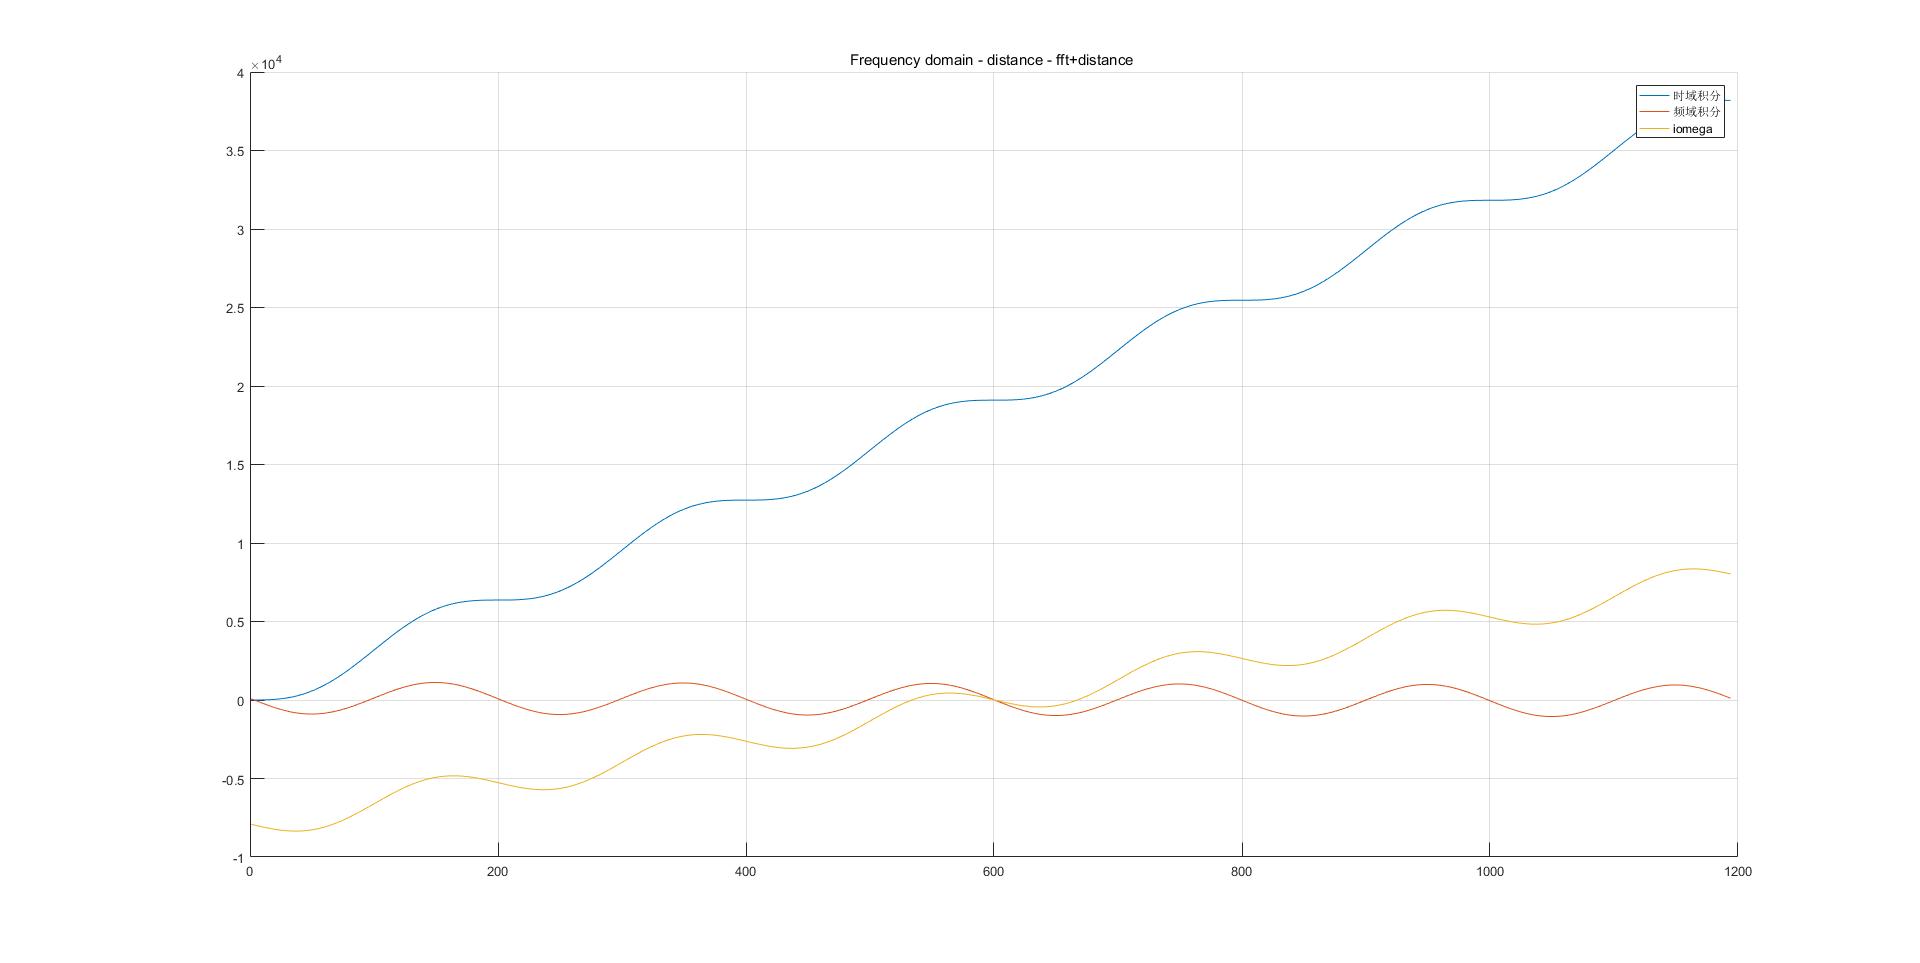
其中三个积分分别给出了三个结果,具体原因有待进一步分析。有兴趣的小伙伴可以看看我的程序哪里出现了问题。
后续有待继续研究。
参考网站:
以上是关于时域积分与频域积分 实现及对比的主要内容,如果未能解决你的问题,请参考以下文章
