R语言之t检验
Posted
tags:
篇首语:本文由小常识网(cha138.com)小编为大家整理,主要介绍了R语言之t检验相关的知识,希望对你有一定的参考价值。
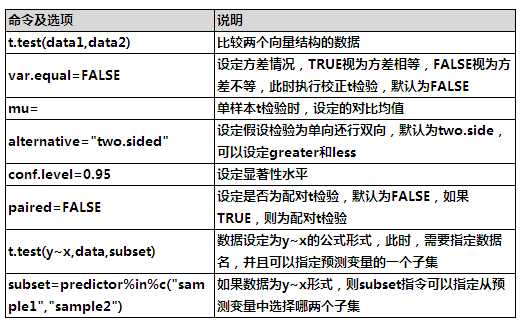
在R中,t检验是通过t.test()命令实现的,通过设置该命令中的选项可以完成不同的t检验。首先介绍该命令的常用选项:
一、单样本t检验
通过设定mu选项来进行,如
> t.test(data2,mu=5)
One Sample t-test
data: data2
t = 0.25482, df = 15, p-value = 0.8023
alternative hypothesis: true mean is not equal to 5
95 percent confidence interval:
4.079448 6.170552
sample estimates:
mean of x
5.125
二、方差相等时的双样本t检验
通过设定var.equal=TRUE来进行,此时的计算会合并方差,并且不修改自由度,如
> t.test(data2,data3,var.equal = TRUE)
Two Sample t-test
data: data2 and data3
t = -2.7908, df = 26, p-value = 0.009718
alternative hypothesis: true difference in means is not equal to 0
95 percent confidence interval:
-3.5454233 -0.5379101
sample estimates:
mean of x mean of y
5.125000 7.166667
三、方差不等时的双样本t检验
通过设定var.equal=FALSE来进行,计算会对t值和自由度进行校正,如
> t.test(data2,data3,var.equal = FALSE)
Welch Two Sample t-test
data: data2 and data3
t = -2.8151, df = 24.564, p-value = 0.009462
alternative hypothesis: true difference in means is not equal to 0
95 percent confidence interval:
-3.5366789 -0.5466544
sample estimates:
mean of x mean of y
5.125000 7.166667
四、配对t检验
通过设定paired=TRUE来进行,需要注意的是,配对t检验的数据要求两列数据有相同长度,否则会报错。如
> t.test(data1,data2,paired = TRUE)
五、使用公式形式语法进行t检验
如果数据结构为数字向量,那么可以直接使用上述的t.test()设定进行分析,但是很多情况下,我们的数据中会有分类数据,而这些分类数据又基本为因子(也就是自变量、预测变量),此时,我们得到的数据为如下形式:
rich graze
1 12 mow
2 15 mow
3 17 mow
4 11 mow
5 15 mow
6 8 unmow
7 9 unmow
8 7 unmow
9 9 unmow
对于这种形式的数据,我们在使用t检验时,需要将数据设定为y~x形式,如
> t.test(rich~graze,data=grass)
Welch Two Sample t-test
data: rich by graze
t = 4.8098, df = 5.4106, p-value = 0.003927
alternative hypothesis: true difference in means is not equal to 0
95 percent confidence interval:
2.745758 8.754242
sample estimates:
mean in group mow mean in group unmow
14.00 8.25
如果分类数据多于两类,需要设定subset选项进行指定,如
> t.test(rich~graze,data=grass,subset=graze%in%c("mow","unmow"))
Welch Two Sample t-test
data: rich by graze
t = 4.8098, df = 5.4106, p-value = 0.003927
alternative hypothesis: true difference in means is not equal to 0
95 percent confidence interval:
2.745758 8.754242
sample estimates:
mean in group mow mean in group unmow
14.00 8.25
上例中,我们从graze这个预测变量中指定了"mow","unmow"两个子集用于做t检验,其中%in%意为随后的类别包含在graze中。
以上是关于R语言之t检验的主要内容,如果未能解决你的问题,请参考以下文章