Performance Monitor1:开始性能监控
Posted 悦光阴
tags:
篇首语:本文由小常识网(cha138.com)小编为大家整理,主要介绍了Performance Monitor1:开始性能监控相关的知识,希望对你有一定的参考价值。
Performance Monitor是Windows内置的一个可视化监控工具,能够在OS级别上实时记录系统资源的使用情况,通过收集和存储日志数据,在SQL Server发生异常时,能够还原系统资源的使用情况,利于对SQL Server进行Troubleshooting。Performance Monitor使用Performance Counter来追踪系统的活动状态的测量值,取样间隔默认是15s,即,Performance Monitor每隔15s,记录Performance Counter的当前值。
Performance Monitor主要有两个组件:Viewer和Data Collector,分别用于查看和记录Performance Counter的测量值,开启Performance Monitor对Server的影响很微小,建议开启,多收集一些性能数据。
一,查看Viewer
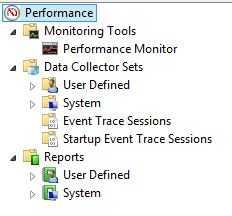
1,打开 Performance Monitor
点击Windows+R,在Run中输入perfmon,打开Performance Monitor,主要分为三个目录:Monitoring Tools,Data Collector Sets 和 Reports。
2,查看Performance Monitor
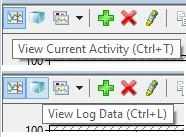
Performance Monitor是Viewer,有两种查看模式:View Current Activity 和 View Log Data,前者用于实时监控当前数据,后者用于查看历史数据。
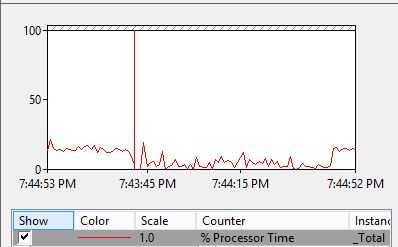
3,图表(Graph)
能够选择时间区间(zoom to),能够选择显示和隐藏指定的Counter,能够缩放(Scale)Counter的值
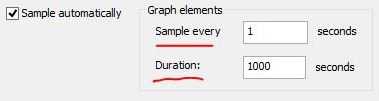
4,Sample Interval
Performance Monitor的取样时间间隔由属性 Sample Interval 确定,通过Performance Monitor Properties -> General tab查看取样间隔设置
- 勾选Sample automatically:自动取样
- Sample Every X seconds:采样的时间间隔
- Duration X seconds:Viewer显示的时间长度,这是 Real-Time 监控模式下保持数据的最长时间
二,创建Data Collector
Data Collector用于记录Performance Counter的数值,默认存储在C:\PerfLogs 目录下,多个Data Collector的集合就是一个Data Collector Set。
1,创建自定义的Data Collector Set
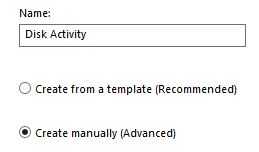
展开Data Collector Sets,点击User Defined->New->Data Collector Set,输入Name,并选择 Create Manually(Advanced)。
2,创建数据日志
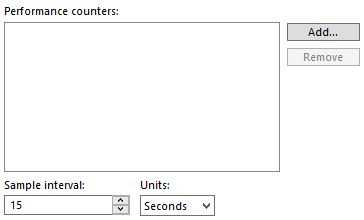
选择Create Data Logs,并勾选Performance Counter,通过Add按钮添加Performance Counter,默认的Sample Interval是15s。
3,添加Performance Counter
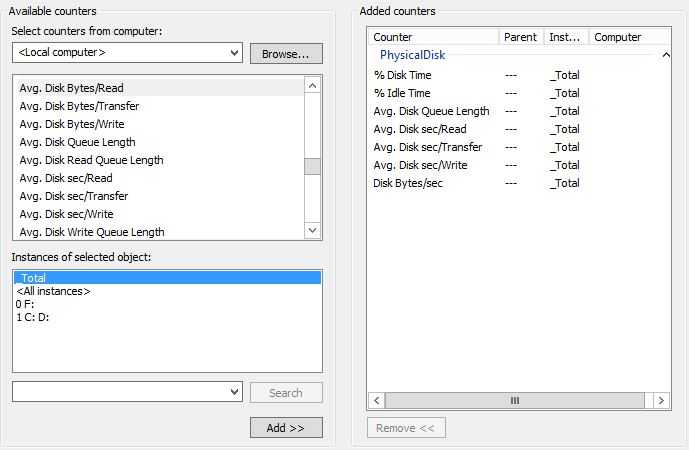
根据监控目的,选择合适的Counter,楼主创建的Data Collector用于监控Disk活动,主要选择以下7个计数器,通过Add按钮添加到右侧面板中。
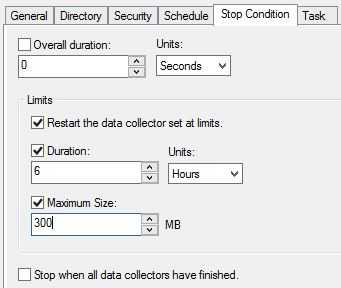
4,设置Data Collector Set的Stop Condition,使数据文件Size不会超过限制
Windows使用Set来同一管理Data Collector,每个Data Collector的数据单独存储在文件中,如果数据文件过大,在查看时,Viewer加载过程缓慢,建议将Data Collector的数据文件控制在300MB以内。打开指定Data Collector Set的属性,切换到Stop Condition Tab,指定停止收集数据的条件。
Overall duration指定:在一定的时间之后,停止收集数据(stop collecting data after a period of time)
Limits指定:当数据收集满足Duration和Maximum Size条件时,将数据文件分离单独的数据文件。
- Use limits to segment data collection into separate logs by selecting When a limit is reached, restart the data collector set.
- If both limit types are selected, data collection will stop or restart when the first limit is reached.
- Duration:configure a time period for data collection to write to a single log file.
- Maximum Size:restart the Data Collector Set or to stop collecting data when the log file reaches the limit.
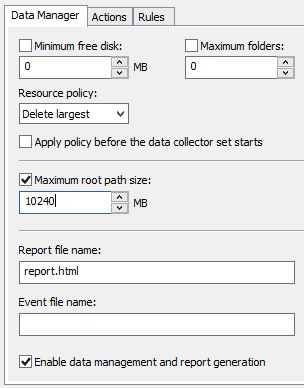
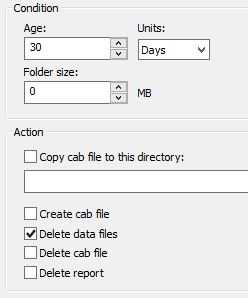
5,Data Manager,删除旧的无用数据
在Data Collector运行了很长世间之后,Data Collector创建的数据文件可能很大,必须及时将无用的数据清理掉,Data Manger负责清理数据文件。
选中指定的Data Collector Set,右击弹出快捷菜单,打开Data Manager。在Data Manager Tab中设置Maximum root path size=10GB,并勾选Enable Data Manager复选框;在Actions Tab中,增加一个Action,Age:30Days,勾选Delete Data Files,表示将超过30天的数据文件删除。
三,开启Performance Monitor对Server性能影响很微小
在一个Production Server上,Performance Monitor运行很长一段时间之后,Task Management显示消耗的CPU和内存资源数量很小,如图:

引用《SQL Server 2012 实施与管理实战指南》:
默认的Performance Monitor 是用来Real-Time 检测系统的,在现实的问题分析中,更多的是需要在问题发生之前,开启Performance Counter来收集数据,一段时间之后,或者问题重现之后,通过收集的数据,离线分析问题的现象和原因。
有些DBA会担心,抓这么多Performance Counter会不会影响Server的性能,根据经验,Performance Monitor对系统整体性能的影响几乎感觉不到,所以,可以放心大胆地多收集一些Counter,时间间隔设置默认值 15s 是比较安全的。
如果性能日志文件超过1GB,在View Report时,加载log file会很慢,一般将日志文件的Size的最大值设置为300MB。这可以通过选择“Stop Condition” Tab,勾选 Maximum Size 设置日志文件的最大值为300MB来实现。
参考文档:
Performance Monitoring Getting Started Guide
以上是关于Performance Monitor1:开始性能监控的主要内容,如果未能解决你的问题,请参考以下文章
利用window.performance.timing进行性能分析
2017年的golangpythonphpc++cjavaNodejs性能对比(golang python php c++ java Nodejs Performance)