linux Prometheus+Grafana监控服务器性能
Posted
tags:
篇首语:本文由小常识网(cha138.com)小编为大家整理,主要介绍了linux Prometheus+Grafana监控服务器性能相关的知识,希望对你有一定的参考价值。
1、安装prometheus安装go
[[email protected] ~]# yum -y install go安装prometheus 服务器端
[[email protected] ~]# wget https://github.com/prometheus/prometheus/releases/download/v2.9.2/prometheus-2.9.2.linux-amd64.tar.gz[[email protected] ~]# tar xvf prometheus-2.9.2.linux-amd64.tar.gz -C /usr/local/[[email protected] ~]# vim /usr/local/prometheus-2.9.2.linux-amd64/prometheus.yml? ?在里面写清楚监控节点的信息。注意此文件是yml文件,对格式要求很严格。
? ?主机的9090端口是必须配置的,这是prometheus自带的web界面
? ?9100是node_exporter的默认端口
? ?9104是mysqld_exporter默认端口,此服务器上为了测试我也装了mysql。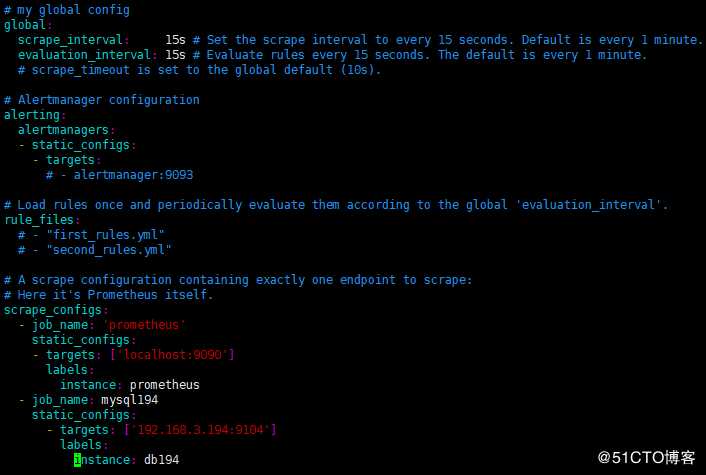
配置完成后,运行服务:[[email protected] ~]# cd /usr/local/prometheus-2.9.2.linux-amd64/
[[email protected] ~]# prometheus     //热加载配置
prometheus启动命令添加参数 --web.enable-lifecycle
然后热重启:curl -XPOST http://localhost:9090/-/reload
 nohup ./prometheus  --web.enable-lifecycle  &
这样更改配置文件后就不用关闭再启动prometheus了
然后ip+端口就可以访问了
192.168.3.121:9090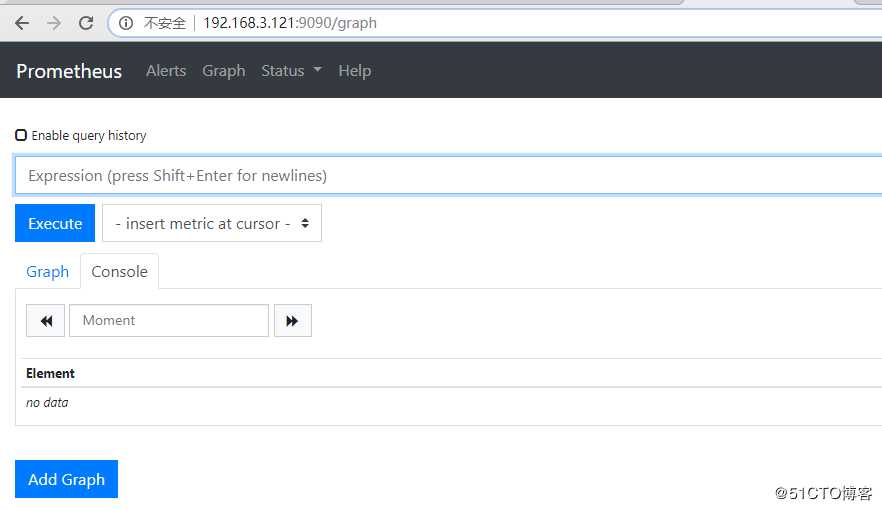
在被监控的mysql机器上安装对应的exporter官网地址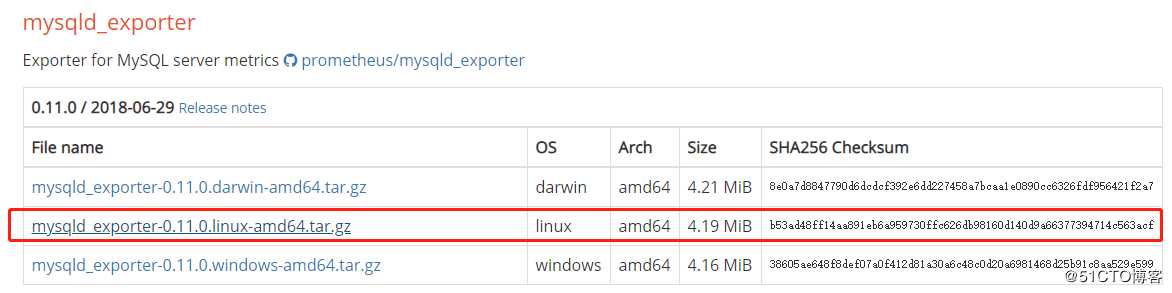
下载完成在服务器上解压
[[email protected] ~]# tar xvf mysqld_exporter-0.11.0.linux-amd64.tar.gz -C /usr/local/
[[email protected] ~]# nohup /usr/local/mysqld_exporter-0.11.0.linux-amd64/mysqld_exporter &
然后访问192.168.3.121:9090。可以看到up,此时就实现了用普罗米修斯监控系统参数。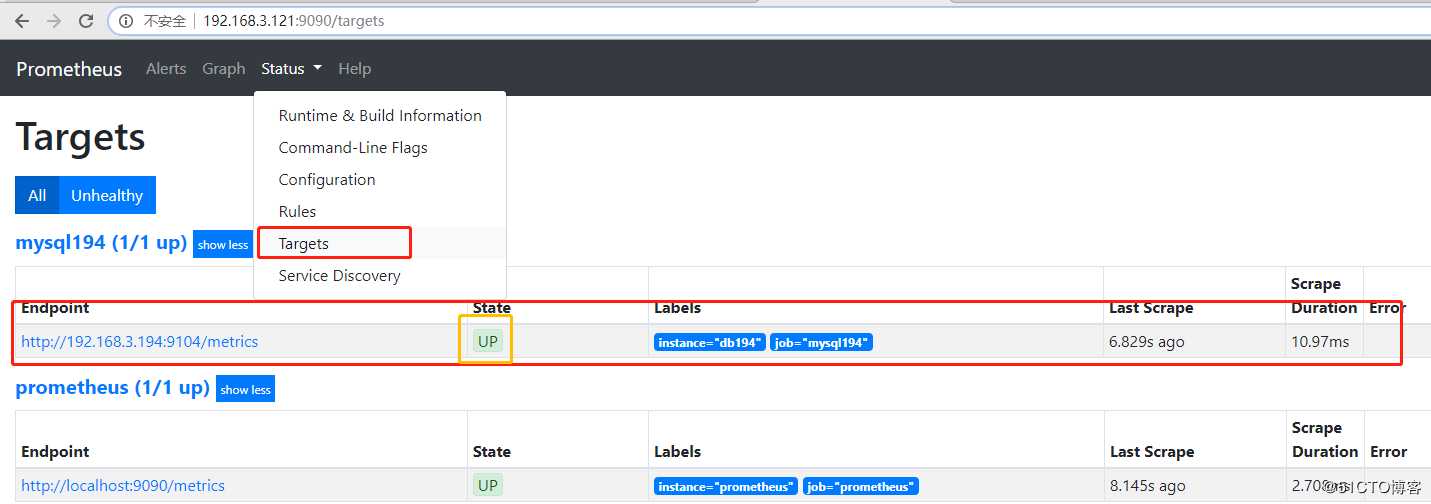
2、安装grafana
[[email protected] ~]# wget https://dl.grafana.com/oss/release/grafana-5.4.0-1.x86_64.rpm

[[email protected] ~]# yum localinstall grafana-5.4.0-1.x86_64.rpm -y

[[email protected] ~]# systemctl start grafana-server
访问192.168.3.121:3000,默认账户密码 admin/admin
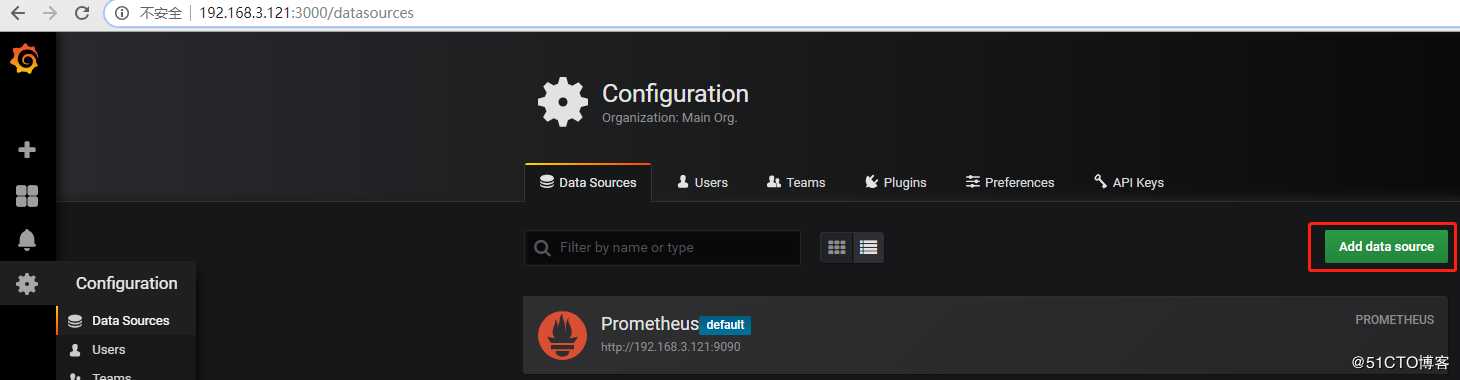
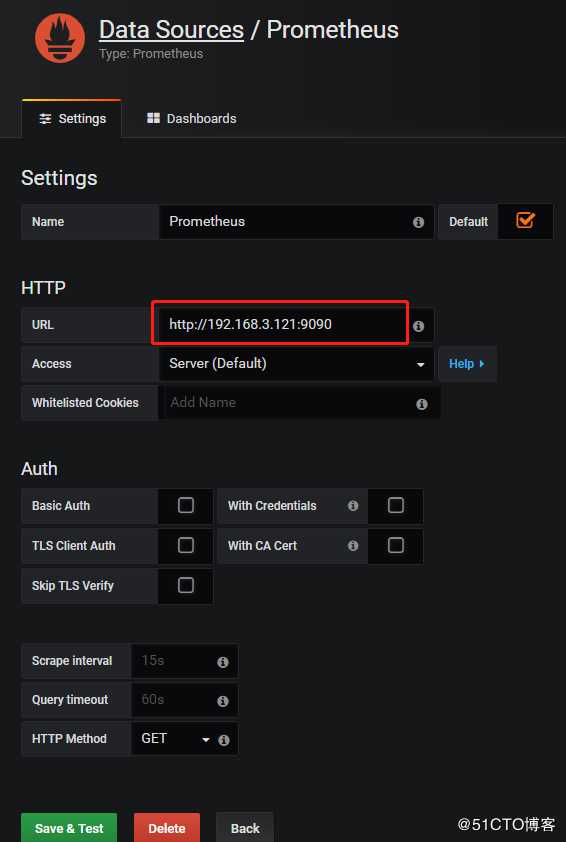
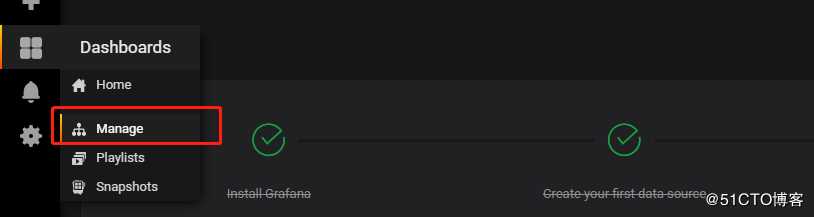
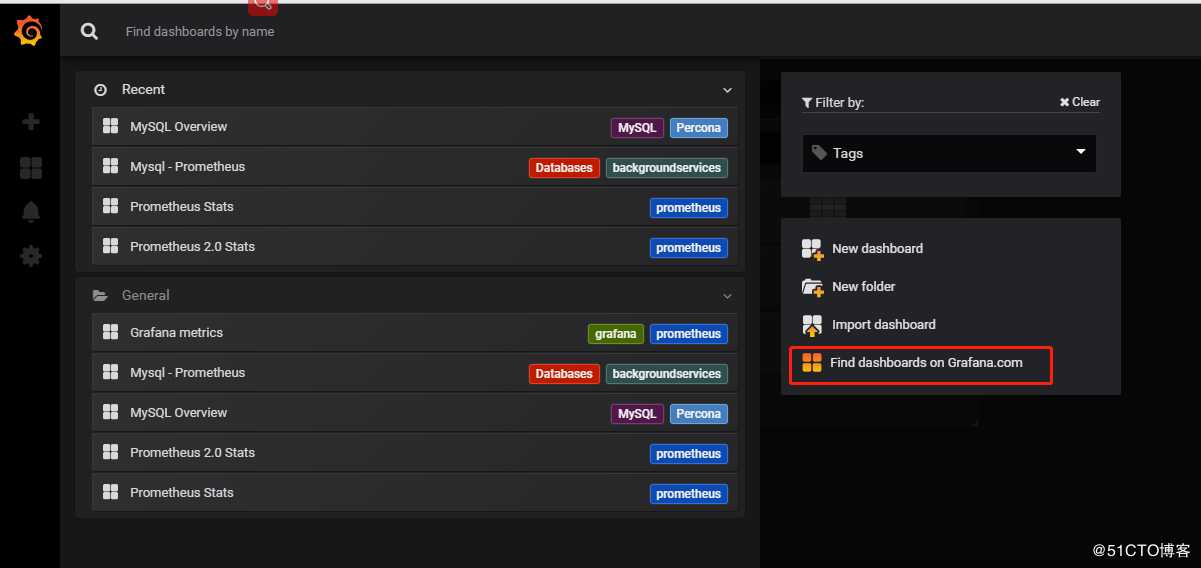
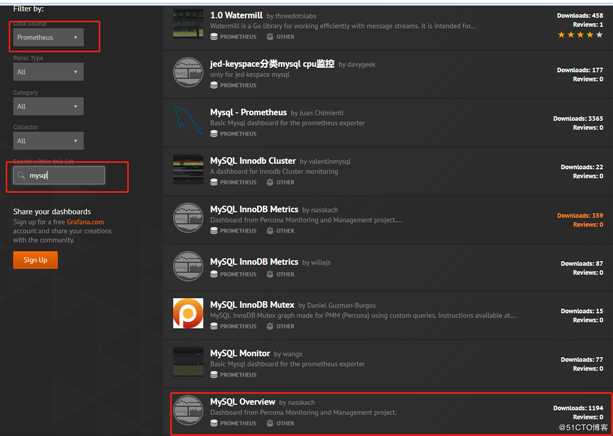
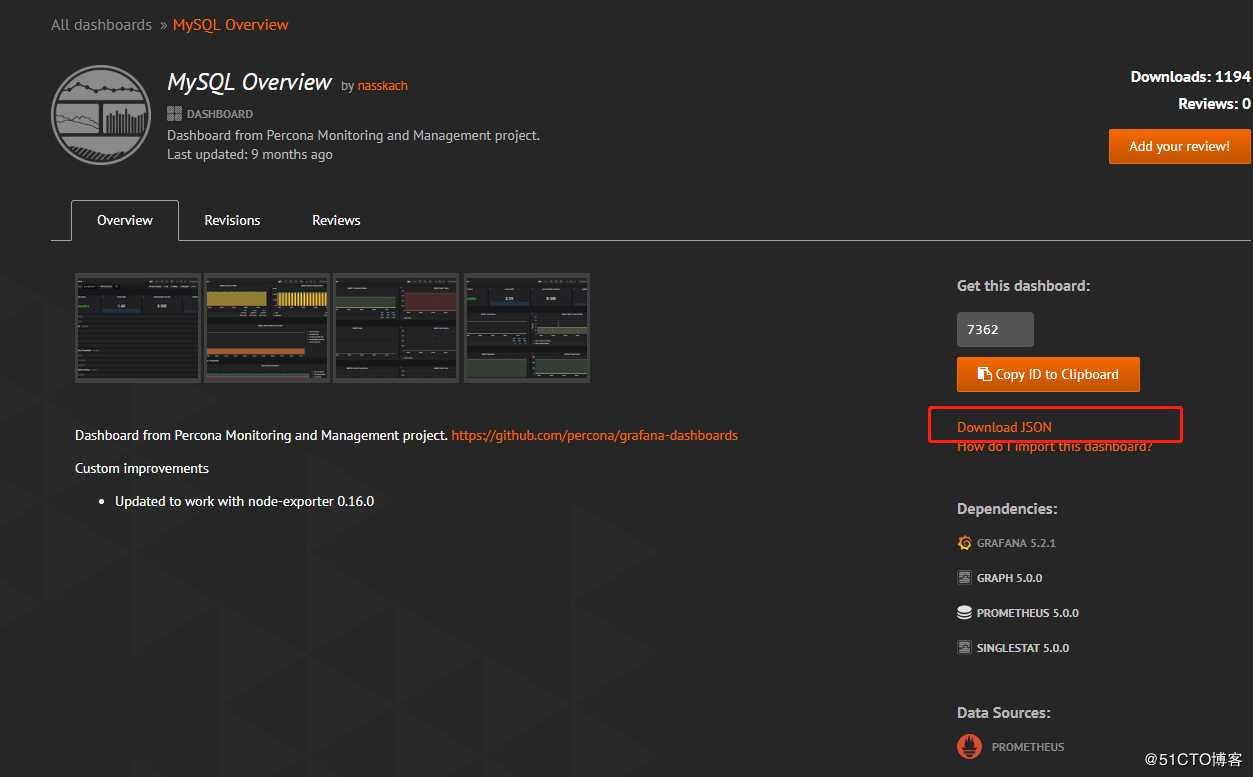
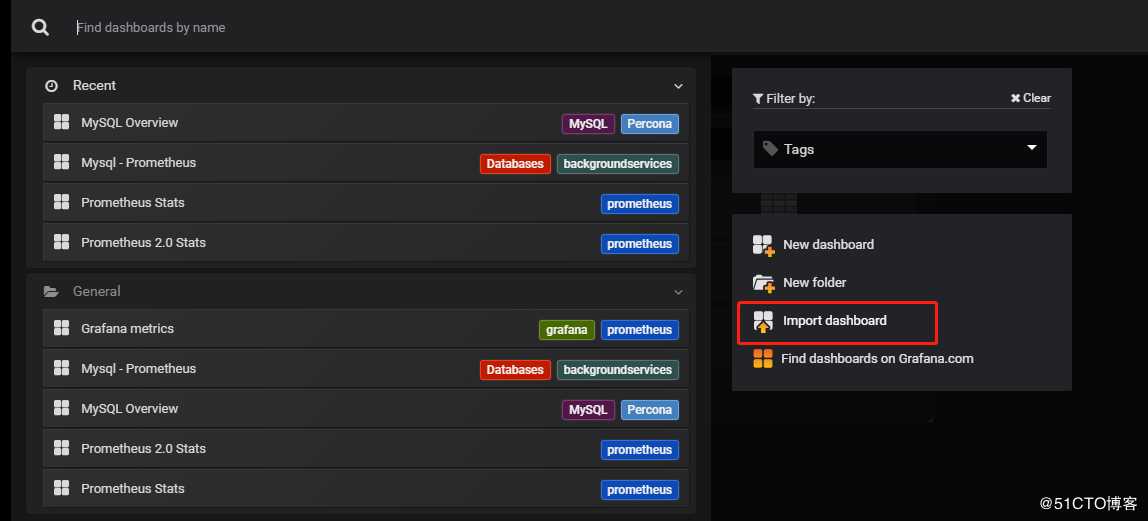
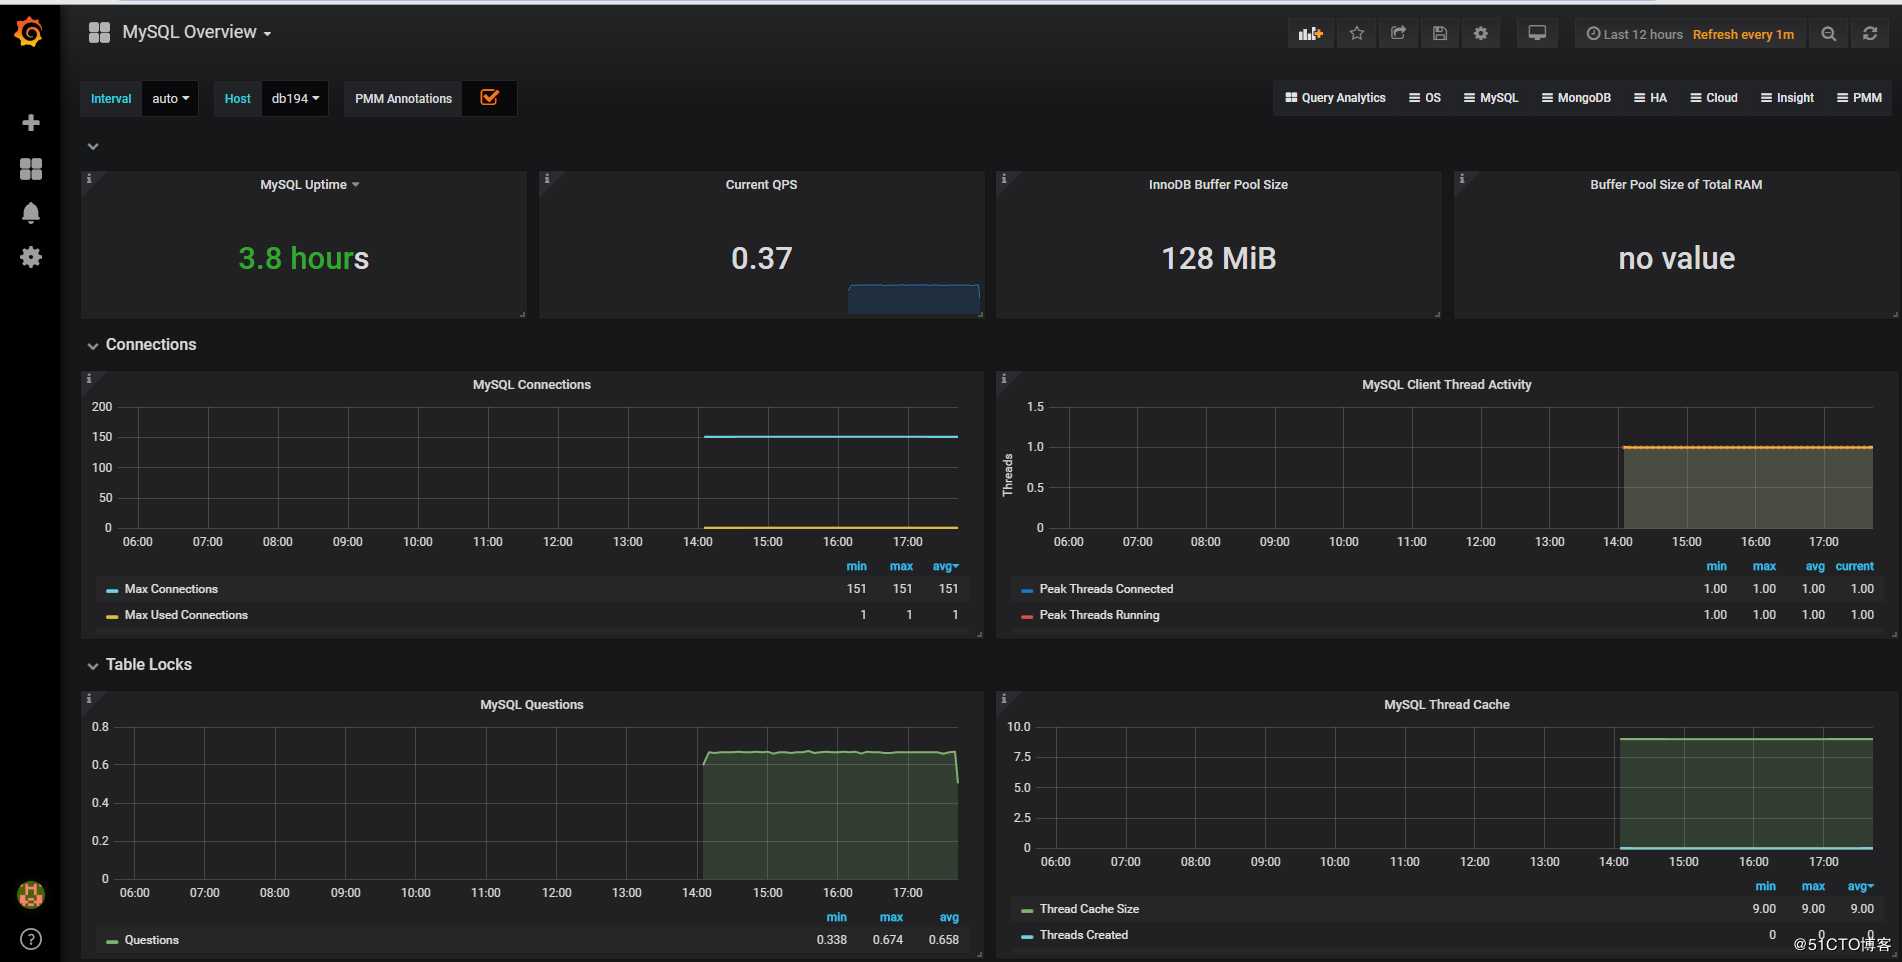
回到刚开始的界面,导入下载好的文件包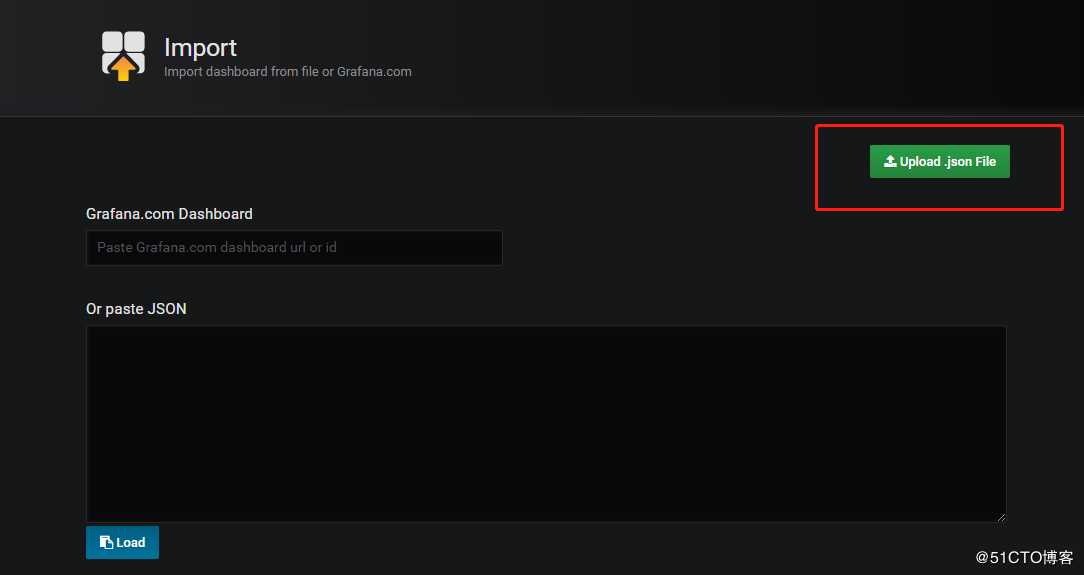
以上是关于linux Prometheus+Grafana监控服务器性能的主要内容,如果未能解决你的问题,请参考以下文章
linux Prometheus+Grafana监控服务器性能
grafana+prometheus+node_exporter+linux
Grafana+Prometheus监控Linux服务器性能
Grafana+Prometheus监控Linux服务器性能