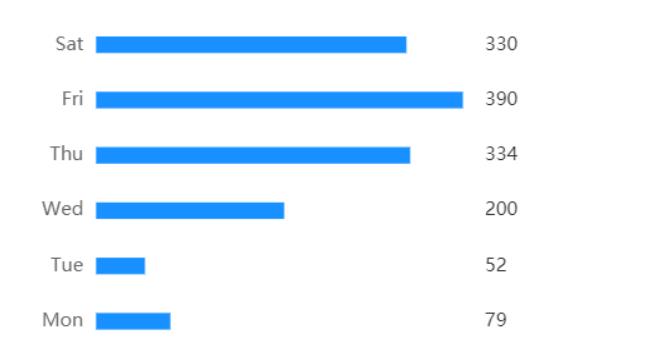
Pie 和 Bar Echart简单样式结构
Posted 一枚新人小菜鸡
tags:
篇首语:本文由小常识网(cha138.com)小编为大家整理,主要介绍了Pie 和 Bar Echart简单样式结构相关的知识,希望对你有一定的参考价值。
Echart 从竖着列转横着列
只需要把yAxis 和 xAxis 里面的data换一下就可以了


this.chart.setOption(

        tooltip:
          trigger: 'axis',
          axisPointer:  // 坐标轴指示器,坐标轴触发有效
            type: 'false' // 默认为直线,可选为:'line' | 'shadow'
          ,
        ,
        grid:
          top: 10,
          left: '2%',
          right: '2%',
          bottom: '3%',
          containLabel: true
        ,
        xAxis: [
          type: 'value',
          boundaryGap: [0, 0.01],
          //取消水平线 信息
          axisLine:
            show: false
          ,
          //取消背景阴影
          axisTick:
              show: false
          ,
          //取消显示信息
          show:false
        ],
        yAxis: [
          type: 'category',
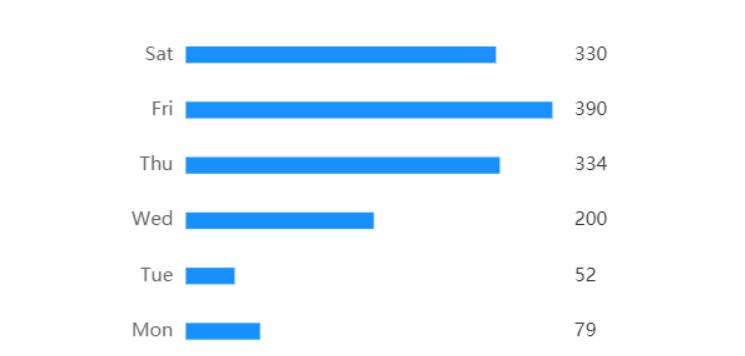
          data: ['Mon', 'Tue', 'Wed', 'Thu', 'Fri', 'Sat'],
          //轴样式
          axisLabel:
              show: true,
              //轴字体颜色
              textStyle:
                  color: '#666666'

          ,
          axisLine:
            show: false
          ,
          axisTick:
              show: false
          ,
        ,
          type: 'category',
          data: [79, 52, 200, 334, 390, 330],
          axisLabel:
              show: true,
              textStyle:
                  color: '#333333'

          ,
          axisLine:
            show: false
          ,
          axisTick:
              show: false
          ,
        ],
        series: [
          name: 'pageA',
          type: 'bar',
          stack: 'vistors',
          barWidth: '30%',
          itemStyle:color: "#1990FF",
          data: [79, 52, 200, 334, 390, 330],
          animationDuration
        ]
      )

this.chart.setOption(
        graphic:
          type:'text',
          left:'center',
          top:'center',
          style:
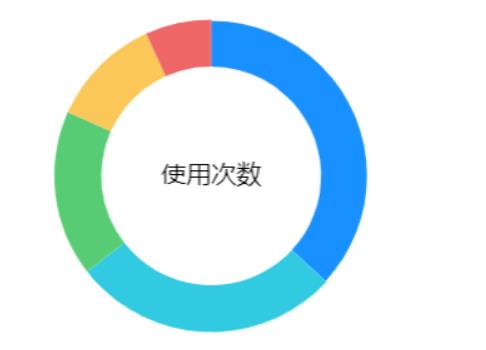
            text:'使用次数',
            fontSize: 16,
          ,
        ,
        /*tooltip:
          trigger: 'item',
          formatter: 'a <br/>b : c (d%)'
        ,
        legend:
          x : '70%',
   				y : '25%',
				  orient: 'vertical',
				  left: 'left',
				  itemWidth:10,
          itemHeight:10,
				    textStyle:
							        fontSize: 14,
							        color:"#999",
					,
					formatter: function (name)
					    return name.length > 20 ? (name.slice(0,20)+"...") : name
					,
          data: ['Industries部门 | 25.1% 12098', 'Technology部门', 'Forex部门', 'Gold部门', 'Forecasts部门']
        ,*/
        series: [

            left: 300,
            name: 'WEEKLY WRITE ARTICLES',
            type: 'pie',
            radius: [70, 100],
            center: ['50%', '50%'],
            data: [
               value: 320, name: 'Industries部门',itemStyle:color: "#1990FF",
               value: 240, name: 'Technology部门',itemStyle:color: "#32CAE0",
               value: 149, name: 'Forex部门',itemStyle:color: "#58CC74",
               value: 100, name: 'Gold部门',itemStyle:color: "#FAC758",
               value: 59, name: 'Forecasts部门',itemStyle:color: "#EE6666"
            ],
            animationEasing: 'cubicInOut',
            animationDuration: 2600,
            itemStyle :
              normal :
                label :
                  show : false
                ,
                labelLine :
                  show : false

              ,
          ,
        ]
      )
以上是关于Pie 和 Bar Echart简单样式结构的主要内容,如果未能解决你的问题,请参考以下文章
006-ant design -结合echart-地址map市