opencv建立数学坐标系绘制函数曲线
Posted 落樱弥城
tags:
篇首语:本文由小常识网(cha138.com)小编为大家整理,主要介绍了opencv建立数学坐标系绘制函数曲线相关的知识,希望对你有一定的参考价值。
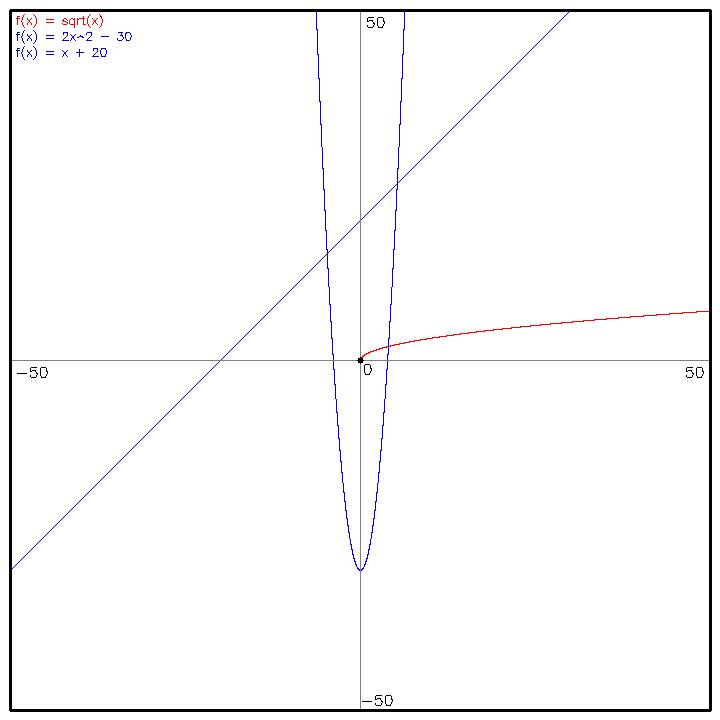
周末闲来无事用opencv简单实现了一个可以在mat中绘制曲线的工具类,方便学习图像处理相关的内容。
坐标系本身比较简单就是常规的数学坐标系,可以自由设置图像中坐标系的范围,内部会自动映射需要绘制的点到Mat上。因为注释比较全,下面只简单描述下使用方式不再进行详细的解释。
double mysqrt(double x)
	return sqrt(x);


double mysqare(double x, int a, int b)
	return x * x * a + b;


double myawx(double x, int a, int b)
	return x * a + b;


void testSurface()
	AxisSurface surface(cv::Size(960, 960), 10);
	int axisRange = 50;
	AxisRange range =  cv::Point2d(-1 * axisRange, -1 * axisRange), cv::Point2d(axisRange, axisRange) ;
	surface.setRange(range);

	auto func1 = std::bind(mysqrt, std::placeholders::_1);
	AxisFunc<decltype(func1)> axisFunc1 =  func1, -256, 256, 0.001, AxisColorRed, "f(x) = sqrt(x)";
	surface.draw(axisFunc1);

	auto func2 = std::bind(mysqare, std::placeholders::_1, 2, -30);
	AxisFunc<decltype(func2)> axisFunc2 =  func2, -256, 256, 0.001, AxisColorBlue, "f(x) = 2x^2 - 30" ;
	surface.draw(axisFunc2);

	auto func3 = std::bind(myawx, std::placeholders::_1, 1, 20);
	AxisFunc<decltype(func3)> axisFunc3 =  func3, -256, 256, 0.001, AxisColorBlue, "f(x) = x + 20" ;
	surface.draw(axisFunc3);

	cv::Mat ret = surface.getSurface();
	cv::namedWindow("");
	cv::imshow("", ret);
	cv::waitKey(0);

001.jpg |

002.jpg |
具体实现
#ifndef __AXIS_SURFACE_H__
#define __AXIS_SURFACE_H__
/*
* @brief 一个坐标系的实现,会将图像绘制到opencv的mat中,主要用来绘制函数曲线,函数曲线使用点来绘制
*/
#include <opencv/cv.h>
#include <opencv2/opencv.hpp>
#include <memory>
/*
* @brief 一些预设的颜色和方位
*/
#define AxisColorBlack cv::Scalar(0, 0, 0)
#define AxisColorWhite cv::Scalar(255, 255, 255)
#define AxisColorGray(x) cv::Scalar(int(x), int(x), int(x))
#define AxisColorRed cv::Scalar(0, 0, 255)
#define AxisColorGreen cv::Scalar(0, 255, 0)
#define AxisColorBlue cv::Scalar(255, 0, 0)
enum AxisTextLocation : int32_t
AxisTextLocationTop,
AxisTextLocationTopRight,
AxisTextLocationRight,
AxisTextLocationBottomRight,
AxisTextLocationBottom,
AxisTextLocationBottomLeft,
AxisTextLocationLeft,
AxisTextLocationTopLeft,
;
/*
* @brief 坐标轴的边框的设置参数
* @param color 坐标轴边框的颜色
* @param type 绘制的线的类型
* @param width 宽度
*/
struct AxisLineParam
cv::Scalar color;
cv::LineTypes type;
int32_t width;
;
/*
* @brief 画布中坐标轴的范围,正常的xy坐标轴,内部会将坐标映射到画布中,比如希望创建[-10,-10]->[10,10]大小的画布,分别设置两个点为[-10,-10] [10,10]即可
* @param leftBottom 坐标轴左下角坐标
* @param rightTop 坐标轴右下角坐标
*/
struct AxisRange
cv::Point2d leftBottom;
cv::Point2d rightTop;
;
/*
* @brief 绘制的函数的参数,来描述希望绘制的函数曲线的具体参数,曲线使用点绘制的
* @pram func 函数模板,使用时使用std::bind绑定函数即可
* @param startx 希望绘制的x坐标范围[startx, endx]
* @param endx 希望绘制的曲线的x坐标范围的结尾
* @param step 绘制曲线时x坐标的步进,即相邻两个点之间横坐标的差
* @param color 绘制的曲线的颜色
* @param desc 绘制曲线的描述
* @param radius 绘制曲线每个点的半径
*/
template<class Func>
struct AxisFunc
Func func;
double startx;
double endx;
double step;
cv::Scalar color;
std::string desc;
double radius;
;
/*
* @brief 使用opencv绘制函数曲线,内部包含一个mat类,所有的内容都会绘制到mat中
* @param m_size 当前画布的大小,即Mat的实际大小
* @param m_border 坐标轴边界和mat边界之间的间距,四个边是等距的
* @param m_lineParam 绘制边框的线的参数
* @param m_range 当前画布中坐标轴的范围
* @param m_psurface 当前绘制的画面的mat
*/
class AxisSurface
public:
AxisSurface(const cv::Size size = 720, 480 , const int32_t border = 20, const AxisLineParam& lineParam = AxisColorBlack, cv::LINE_8, 2 ) : m_size(size), m_border(border), m_lineParam(lineParam)
m_psurface = std::make_shared<cv::Mat>(m_size.height, m_size.width, CV_8UC3, AxisColorWhite);
update(m_size, m_border, lineParam);
~AxisSurface()
public:
void setRange(const AxisRange &range)
if (!(m_range.leftBottom == range.leftBottom && m_range.rightTop == range.rightTop))
m_range = range;
clear(m_size, m_border, m_lineParam);
/*
* @brief 绘制函数曲线,以及函数的描述
*/
template<class Func>
void draw(const AxisFunc<Func> func)
for (double x = func.startx; x <= func.endx; x += func.step)
double y = func.func(x);
drawPoint(cv::Point2d(x, y), func.radius, func.color);
cv::Size textSize = cv::getTextSize(func.desc, cv::FONT_HERSHEY_SIMPLEX, 0.4, 1, nullptr);
double value = (textSize.height + 7) * (m_range.rightTop.y - m_range.leftBottom.y) / (m_size.height - 2.0 * m_border);
drawText(func.desc, cv::Point2d(m_range.leftBottom.x, m_range.rightTop.y - value * m_funcNumber++), cv::FONT_HERSHEY_SIMPLEX, 0.4, func.color, AxisTextLocationBottomRight);
update(m_size, m_border, m_lineParam);
cv::Mat getSurface()
return (*m_psurface).clone();
/**
* @brief 仅仅更新坐标轴的参数
*/
void updateSetting(const int border, const AxisLineParam& lineParam)
m_lineParam = lineParam;
m_border = border;
update(m_size, border, lineParam);
/**
* @brief 更新当前已经绘制的mat的参数,如果尺寸和当前存在的mat不同会清空已经绘制的内容
*/
void updateSetting(const cv::Size size, const int border, const AxisLineParam& lineParam)
if (size.width == m_size.width && size.height == m_size.height)
updateSetting(border, lineParam);
else
clear(size, border, lineParam);
/*
* @brief 清空mat,参数为AxisSurface希望更新的参数
*/
void clear(const cv::Size size = -1, -1 , const int border = -1, const AxisLineParam& lineParam = AxisColorBlack, cv::LINE_8, 2 )
if (!(size.width < 0 || size.height < 0 || border < 0))
m_size = size;
m_border = border;
m_psurface = std::make_shared<cv::Mat>(m_size, CV_8UC3, AxisColorWhite);
m_lineParam = lineParam;
m_funcNumber = 0;
update(m_size, border, lineParam);
private:
/*
* @brief 绘制坐标轴,基本参数就是surface的参数,不详述
*/
void update(const cv::Size &size, const int border, const AxisLineParam& lineParam)
const int axisWidth = lineParam.width;
cv::Scalar color = lineParam.color;
cv::LineTypes lineType = lineParam.type;
//绘制坐标轴
double startx = m_range.leftBottom.x, endx = m_range.rightTop.x;
double starty = m_range.leftBottom.y, endy = m_range.rightTop.y;
int awidth = 1;
drawLine(cv::Point2d(startx, 0), cv::Point2d(endx, 0), AxisColorGray(128), awidth, lineType);
drawLine(cv::Point2d(0, starty), cv::Point2d(0, endy), AxisColorGray(128), awidth, lineType);
drawCircle(cv::Point2d(0, 0), 3, AxisColorBlack, -1);
//绘制边界
cv::Point2d leftDown = startx, starty , leftUp = startx, endy , rightUp = endx, endy , rightDown = endx, starty ;
//下方的线
drawLine(leftDown, rightDown, color, axisWidth, lineType);
//左侧的线
drawLine(leftDown, leftUp, color, axisWidth, lineType);
//右边的线
drawLine(rightDown, rightUp, color, axisWidth, lineType);
//顶部的线
drawLine(rightUp, leftUp, color, axisWidth, lineType);
float textSize = 0.5;
cv::Scalar textColor = AxisColorBlack;
int textFont = cv::FONT_HERSHEY_SIMPLEX;
int gap = 5;
drawText("0", cv::Point2d(0, 0), textFont, textSize, textColor, AxisTextLocationBottomRight, 2);
drawText(std::to_string(int(endy)), cv::Point2d(0, endy), textFont, textSize, textColor, AxisTextLocationBottomRight, gap);
drawText(std::to_string(int(startx)), cv::Point2d(startx, 0), textFont, textSize, textColor, AxisTextLocationBottomRight, gap);
drawText(std::to_string(int(starty)), cv::Point2d(0, starty), textFont, textSize, textColor, AxisTextLocationTopRight, gap);
if (endx != 0)
//防止m_range.rightTop的x坐标为0时,会绘制两个0
drawText(std::to_string(int(endx)), cv::Point2d(endx, 0), textFont, textSize, textColor, AxisTextLocationBottomLeft, gap);
private:
//绘制相关的函数,传入的最表示数学上常规的坐标系,x和y分别向右向上增长,如果绘制的坐标超过边界会略过
/*
* @brief 绘制圆,基本参数和opencv相同,只是做了坐标映射
*/
void drawCircle(cv::Point2d center, int radius, const cv::Scalar& color, int thickness = 1 , int lineType = cv::LINE_8 , int shift = 0 )
cv::Point2d pt(pointMap(center));
if (pt.x < m_border || pt.x > m_size.width - m_border || pt.y < m_border || pt.y > m_size.height - m_border)
return;
cv::circle(*m_psurface, pt, radius, color, thickness, lineType, shift);
/*
* @brief 绘制实心圆,基本参数和opencv相同,只是做了坐标映射
*/
void drawPoint(cv::Point2d center, int radius, const cv::Scalar& color, int lineType = cv::LINE_8, int shift = 0)
drawCircle(center, radius, color, -1, lineType, shift);
/*
* @brief 绘制线,基本参数和opencv相同,只是做了坐标映射
*/
void drawLine(cv::Point2d pt1, cv::Point pt2, const cv::Scalar& color, int thickness = 1, int lineType = cv::LINE_8, int shift = 0)
cv::Point2d point1(pointMap(pt1)), point2(pointMap(pt2));
if (point1.x < m_border || point1.x > m_size.width - m_border || point1.y < m_border || point1.y > m_size.height - m_border)
return;
if (point2.x < m_border || point2.x > m_size.width - m_border || point2.y < m_border || point2.y > m_size.height - m_border)
return;
cv::line(*m_psurface, point1, point2, color, thickness, lineType, shift);
/*
* @brief 绘制文字,opencv默认绘制文字的坐标是文字的左下角,这里提供参数来配置文字具体绘制在哪个方向
* @param text 文字具体内容
* @param org 绘制文字的坐标
* @param fontFact 文字字体类型
* @param fontScale 文字大小
* @param color 文字颜色
* @param location 文字绘制位置相对于org的位置
* @param gap 绘制文字是x和y方向相对于org的距离
* @param thickness 文字的线的宽度
* @param lineType 文字的线的类型
*/
void drawText(const std::string &text, const cv::Point2d org, int fontFace, double fontScale, cv::Scalar color = AxisColorBlack, const AxisTextLocation location = AxisTextLocationTopRight, int gap= 5, int thickness = 1, int lineType = cv::LINE_8)
cv::Point2d point1(pointMap(org));
if (point1.x < m_border || point1.x > m_size.width - m_border || point1.y < m_border || point1.y > m_size.height - m_border) 以上是关于opencv建立数学坐标系绘制函数曲线的主要内容,如果未能解决你的问题,请参考以下文章