ROC曲线绘制(Python)
Posted 拟 禾
tags:
篇首语:本文由小常识网(cha138.com)小编为大家整理,主要介绍了ROC曲线绘制(Python)相关的知识,希望对你有一定的参考价值。

首先以支持向量机模型为例
先导入需要使用的包,我们将使用roc_curve这个函数绘制ROC曲线!
from sklearn.svm import SVC
from sklearn.metrics import roc_curve
from sklearn.datasets import make_blobs
from sklearn. model_selection import train_test_split
import matplotlib.pyplot as plt
%matplotlib inline
然后使用下面make_blobs函数,生成一个二分类的数据不平衡数据集;
使用train_test_split函数划分训练集和测试集数据;
训练SVC模型。
X,y = make_blobs(n_samples=(4000,500), cluster_std=[7,2], random_state=0)

X_train,X_test,y_train, y_test = train_test_split(X,y,random_state=0)

clf = SVC(gamma=0.05).fit(X_train, y_train)

fpr,tpr, thresholds = roc_curve(y_test,clf.decision_function(X_test))

plt.plot(fpr,tpr,label='ROC')

plt.xlabel('FPR')
plt.ylabel('TPR')
从上面的代码可以看到,我们使用roc_curve函数生成三个变量,分别是fpr,tpr, thresholds,也就是假正例率(FPR)、真正例率(TPR)和阈值。
而其中的fpr,tpr正是我们绘制ROC曲线的横纵坐标,于是我们以变量fpr为横坐标,tpr为纵坐标,绘制相应的ROC图像如下:


值得注意的是上面的支持向量机模型使用的decision_function函数,是自己所特有的,而其他模型不能直接使用。

比如说我们想要使用其他模型(例如决策树模型)的结果绘制ROC,直接套用上面的代码,会报错,会显示没有这个函数。

以决策树模型为例,解决上述问题(适用于除向量机外的模型)
导入决策树模型包以及训练模型的代码省略了,只需要手动改一改就行了,我们直接看绘图的代码!
fpr,tpr, thresholds = roc_curve(y_test,clf.predict_proba(X_test)[:,1])


plt.plot(fpr,tpr,label='ROC')

plt.xlabel('FPR')
plt.ylabel('TPR')可以看到我们直接把只适用于支持向量机模型的函数decision_function更改成predict_proba(X_test)[:,1]就行了,让我们看看结果:

可以看到哈,决策树模型在这个数据集上的泛化能力不如支持向量机哈!!!学废了吗。
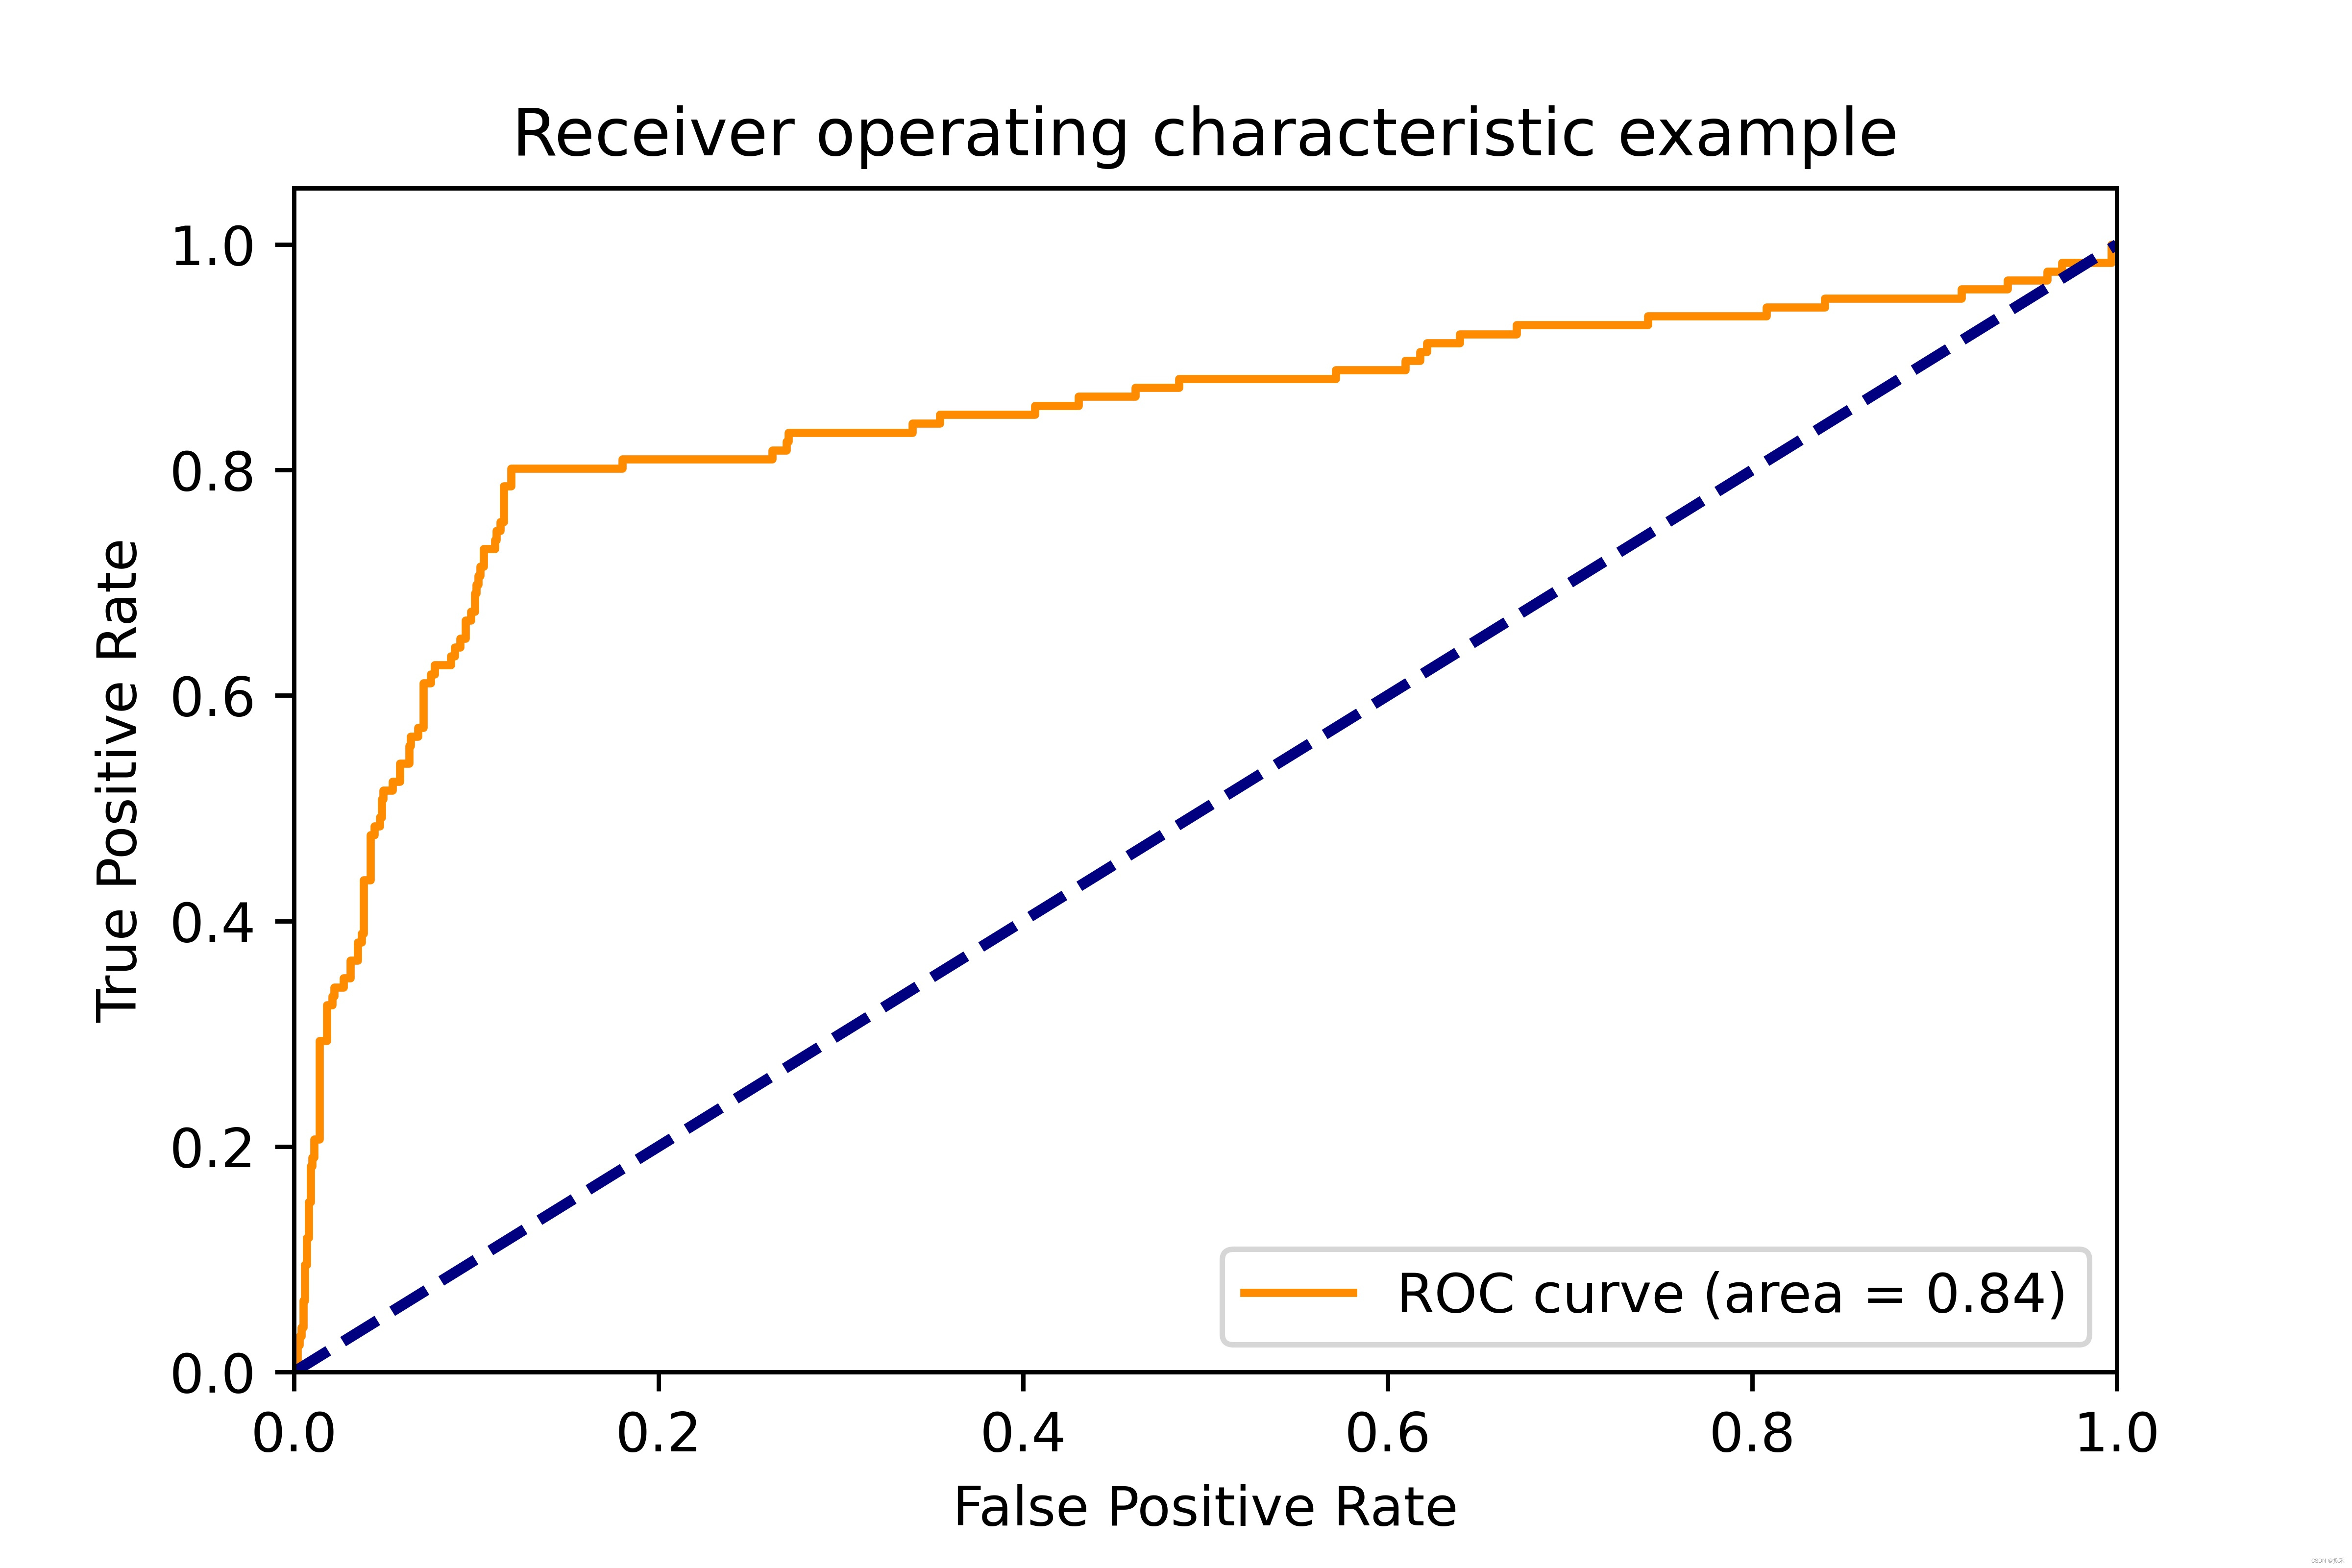
更好看的画法
auc = roc_auc_score(y_test,clf.predict_proba(X_test)[:,1])
# auc = roc_auc_score(y_test,clf.decision_function(X_test))
fpr,tpr, thresholds = roc_curve(y_test,clf.decision_function(X_test))
plt.plot(fpr,tpr,color='darkorange',label='ROC curve (area = %0.2f)' % auc)
plt.plot([0, 1], [0, 1], color='navy', lw=2, linestyle='--')
plt.xlim([0.0, 1.0])
plt.ylim([0.0, 1.05])
plt.xlabel('False Positive Rate')
plt.ylabel('True Positive Rate')
plt.title('Receiver operating characteristic example')
plt.legend(loc="lower right")
plt.savefig('suhan.jpg',dpi=800)
plt.show()
ROC曲线的绘制,python实现
ROC
结果

源数据:鸢尾花数据集(仅采用其中的两种类别的花进行训练和检测)
Summary
features:[‘sepal length (cm)‘, ‘sepal width (cm)‘, ‘petal length (cm)‘, ‘petal width (cm)‘]
实例:[5.1, 3.5, 1.4, 0.2]
target:‘setosa‘ ‘versicolor‘ (0 , 1)
采用回归方法进行拟合得到参数和bias
model.fit(data_train, data_train_label)
对测试数据进行预测得到概率值
res = model.predict(data[:100])
与训练集labels匹配后进行排序(从大到小)
        pred  labels
68  0.758208       1
87  0.753780       1
76  0.745833       1
50  0.743156       1
65  0.741676       1
75  0.739117       1
62  0.738255       1
54  0.737036       1
52  0.733625       1
77  0.728139       1
86  0.727547       1
74  0.726261       1
58  0.725150       1
71  0.724719       1
36  0.724142       0
14  0.723990       0
31  0.721648       0
41  0.720308       0
72  0.717723       1
79  0.712833       1
97  0.705148       1
51  0.702838       1
35  0.702203       0
98  0.701731       1
92  0.701106       1
82  0.700661       1
53  0.700465       1
18  0.699350       0
16  0.696915       0
64  0.693333       1
..       ...     ...
33  0.658937       0
96  0.656761       1
30  0.656279       0
57  0.655673       1
4   0.652616       0
85  0.648620       1
59  0.648586       1
19  0.646965       0
70  0.646262       1
88  0.644482       1
8   0.643191       0
38  0.642704       0
3   0.640933       0
55  0.640630       1
47  0.640444       0
95  0.639552       1
13  0.639050       0
22  0.638485       0
29  0.635590       0
90  0.634376       1
37  0.632224       0
6   0.631119       0
46  0.630037       0
11  0.629718       0
66  0.627807       1
42  0.624795       0
44  0.621703       0
32  0.614932       0
24  0.603874       0
84  0.603249       1
计算训练集中正确的个数与非正确的个数
运用一下的算式进行TPR和FPR的计算
index = 0
for i in sorted_mat.values:
    if i[1] == 0:
        TPR.append(TPR[index])
        FPR.append(FPR[index] + 1.0/F_num)
    else:
        TPR.append(TPR[index] + 1.0/T_num)
        FPR.append(FPR[index])
    index += 1
最后进行TPR和FPR的描绘
以上是关于ROC曲线绘制(Python)的主要内容,如果未能解决你的问题,请参考以下文章