用JS自制表格软件玩数据9. 自制三维 K线图 蜡烛图
Posted 妇男主任
tags:
篇首语:本文由小常识网(cha138.com)小编为大家整理,主要介绍了用JS自制表格软件玩数据9. 自制三维 K线图 蜡烛图相关的知识,希望对你有一定的参考价值。
画三维 K线图 蜡烛图
当写完本系列后,我会把源代码分享出来给大家。本课程也会持续更新与矫正。欢迎留言指正!
概述
平时做Excel表格,都少不了要画图表之类的。所以,本作品的图表功能也必不可少。为了与时俱进,我就打算做个3D版的K线图,让股民能够360度全方位了解那些行情。
于是就选择了最近这些年非常成熟的 WEBGL,为了能够先快速出结果。就先选择了 Three.js 作为框架。刚开始不太熟悉,就在网上搜了 WEBGL中文网 1 报了个课程速成一下,就撸起袖子开始搞起来。
更多高级功能可以查一下官方文档2
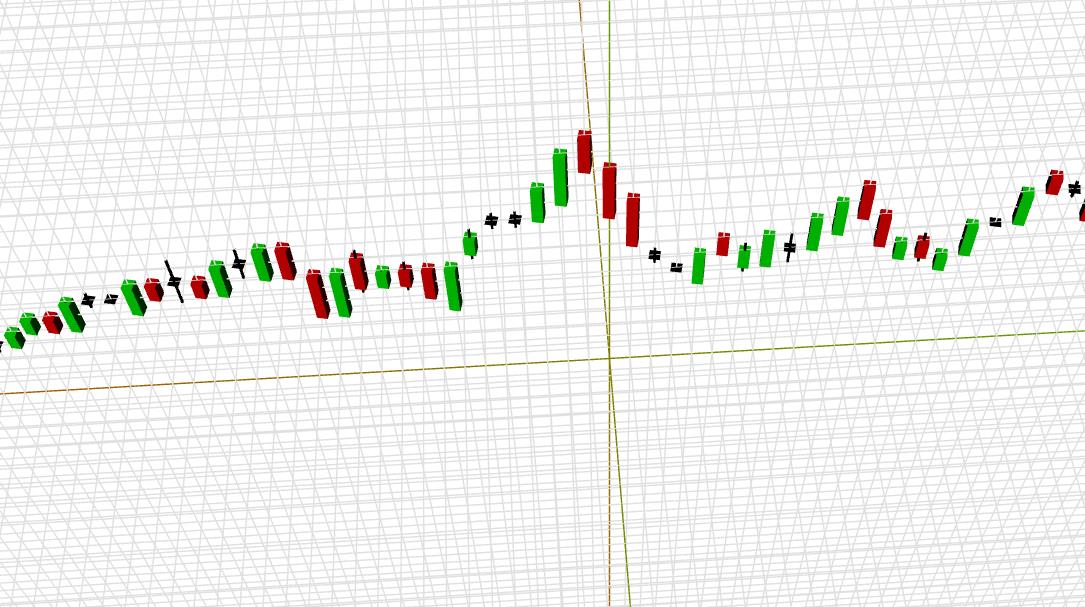
效果图
正面
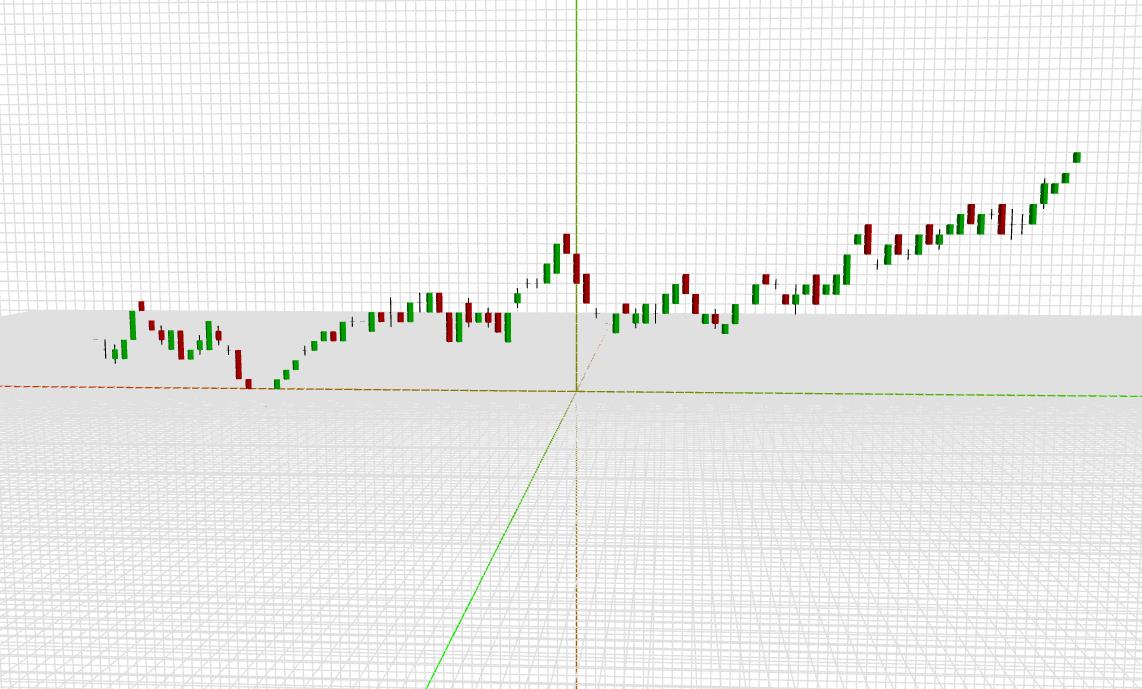
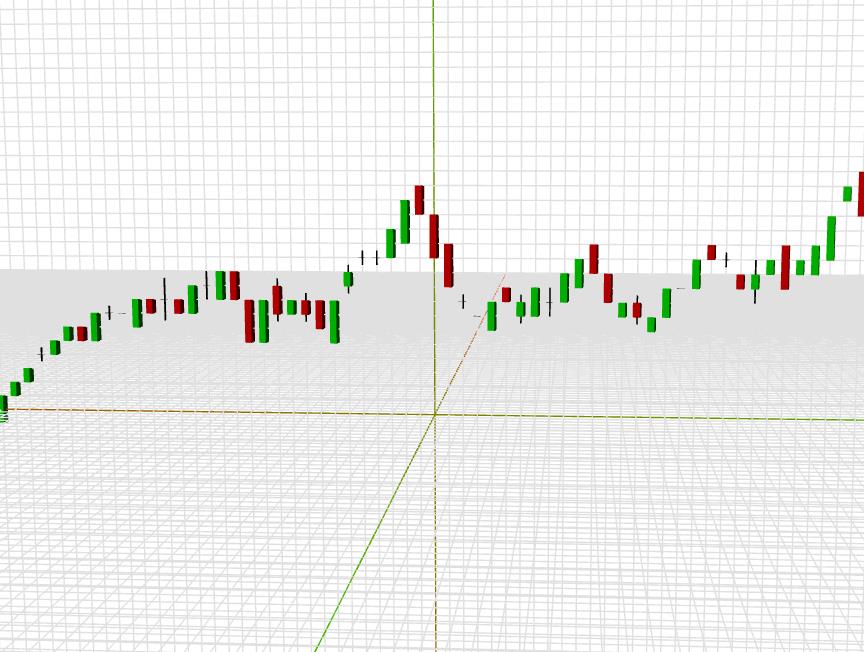
正面近景
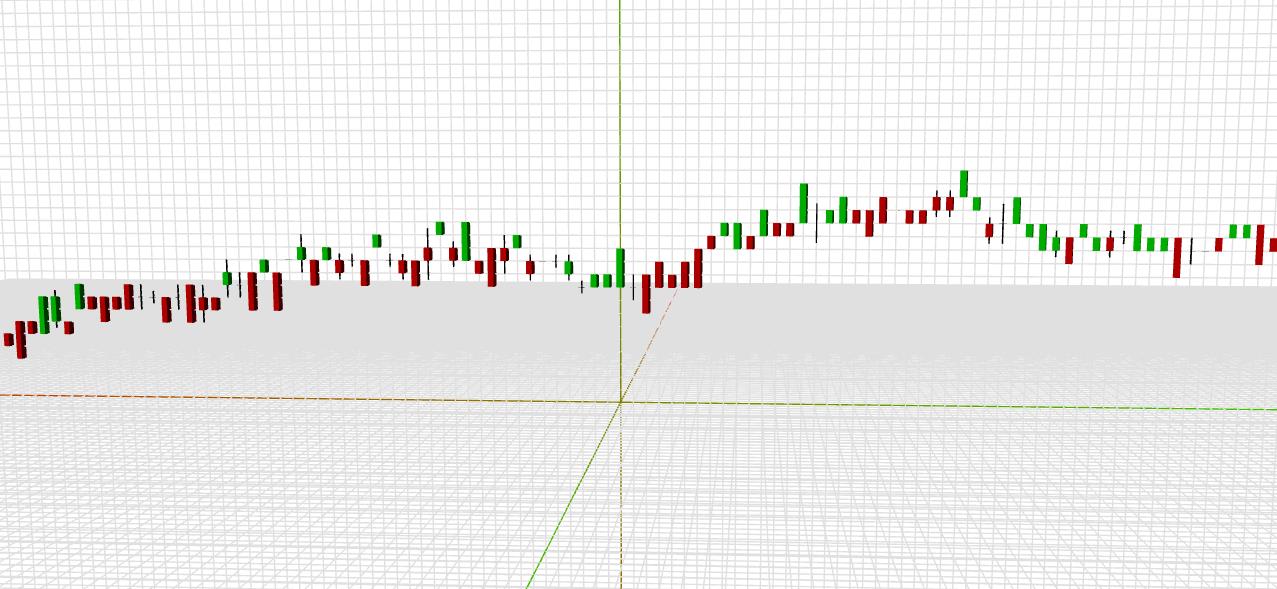
鸟瞰
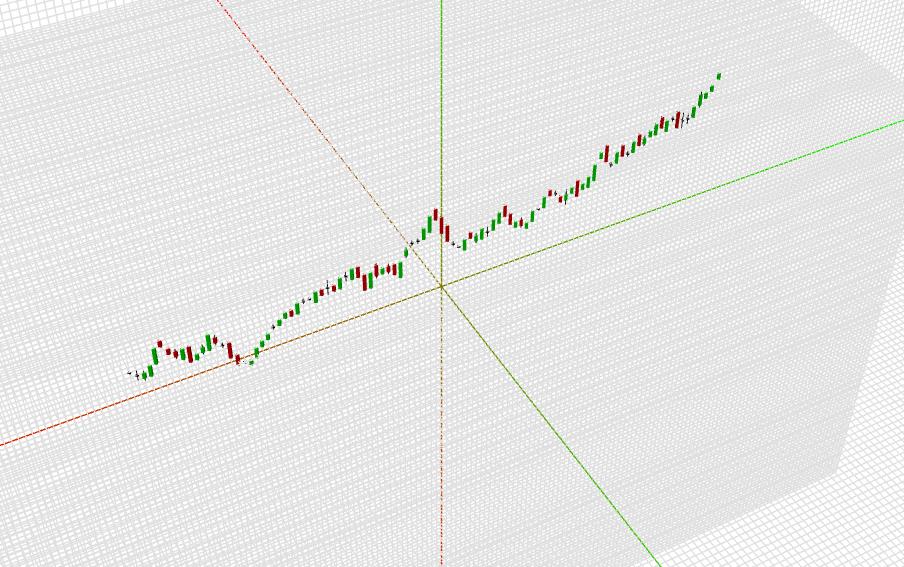
侧面
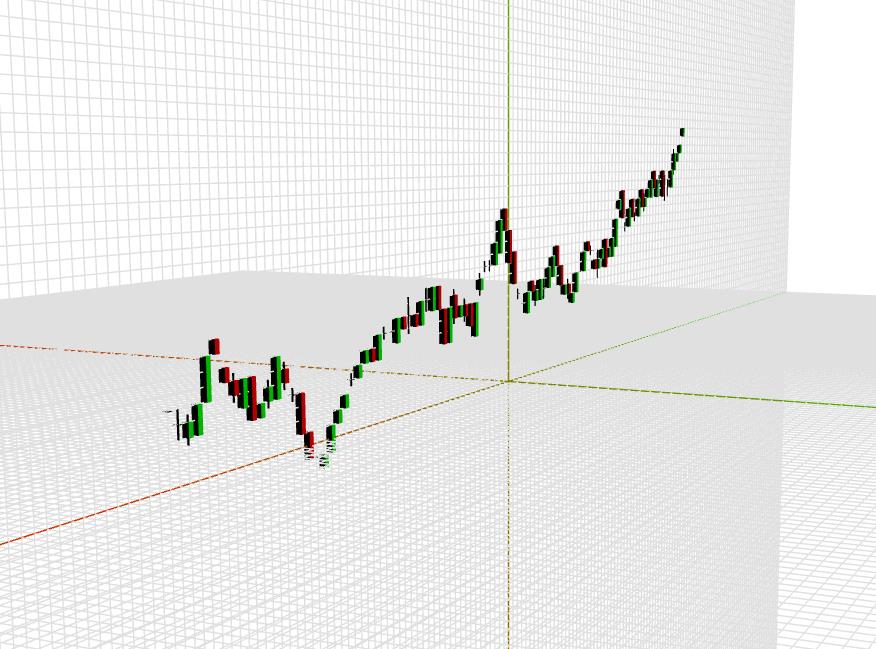
近观俯视
构建一个类
class three_d

	constructor()
初始化环境
/**
* @property Function initThree 初始化整个容器
* @param Number
* @returns NaN 无返回
*/
initThree()
	var that = this;
	this.renderer = new THREE.WebGLRenderer(
		antialias : true, // 抗锯齿开关,设置为false,可以提高性能。
		alpha : this.alpha // 设置背景透明度
	);

	// 设置画布的尺寸
	this.renderer.setSize(this.width, this.height);

	// 绑定了点击事件
	this.renderer.domElement.onclick = that.onMouseClick.bind(this);

	// 绑定了右击事件
	this.renderer.domElement.oncontextmenu = that.oncontextmenu.bind(this);

	// 将初始化完成的画布,绑定到Dom树中。
	document.getElementById(this.canvasID).appendChild(this.renderer.domElement);
设置环境背景
/**
* @property Function setbg 设置背景
* @returns NaN 无返回
*/
setbg(color)
	this.renderer.setClearColor(color, 1.0);
初始化摄像机
/**
* @property Function initCamera 初始化摄像机
* @param Number width 画布的宽度
* @param Number height 画布的高度
* @returns NaN 无返回
*/
initCamera()
	/*
	PerspectiveCamera 透视相机:(fov,aspect,near,far)
	fov 视角(类似眼睛的睁开的大小)
	aspect 宽高比
	near 近平面
	far 远平面
	*/
	this.camera = new THREE.PerspectiveCamera(30, this.width / this.height, 1, 10000);
设置相机的位置
/**
* @property Function setCameraposition 设置相机的位置
* @param Number x x坐标
* @param Number y y坐标
* @param Number z z坐标
* @returns NaN 无返回
*/
setCameraposition(x,y,z)
	//相机坐标的定位
	this.camera.position.x = x;
	this.camera.position.y = y;
	this.camera.position.z = z;

	this.setCameraUp(0,1,0);
设置相机镜头的位置
/**
* @property Function setCameraUp 设置相机顶部快门指向的矢量方向
* @param Number x 相机顶部快门指向的矢量方向的x坐标
* @param Number y 相机顶部快门指向的矢量方向的y坐标
* @param Number z 相机顶部快门指向的矢量方向的z坐标
* @param Object lookAt  x : 0, y : 0, z : 0
* @returns NaN 无返回
*/
setCameraUp(x,y,z,lookAt)
	var lookAt = lookAt ||
		x : 0,
		y : 0,
		z : 0


	// up 代表相机顶部快门指向的矢量方向
	this.camera.up.set(x,y,z);

	// lookAt 代表镜头对准的方向
	this.camera.lookAt(lookAt);
	console.log(this.camera.position)
	this.camera.updateProjectionMatrix();
初始化场景
/**
* @property Function initScene 初始化场景
* @returns NaN 无返回
*/
initScene()
	this.scene = new THREE.Scene();
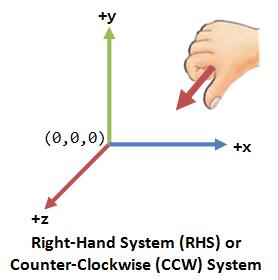
创建坐标系
由于画K线图是基于右手坐标系的,如下图:
/**
* @property Function initcoordinate 创建坐标系
* @param Number size 坐标系的尺寸
*/
initcoordinate(size)
	// 首先创建一个对象元素组
	var group = new THREE.Group();

	// size 是设置坐标系的尺寸边界。因为是以 0 作为原点,所以如果size = 100,那么以0开始的话,就是最大值为99。
	var min = -1*size-1;

	// 开始画辅助线
	for(var i = size;i>min;i--)
		group.add(this.creatLine([-1*size,i,0,0xe0e0e0],[size,i,0,0xe0e0e0]));
		group.add(this.creatLine([i,-1*size,0,0xe0e0e0],[i,size,0,0xe0e0e0]));
		group.add(this.creatLine([-1*size,0,i,0xe0e0e0],[size,0,i,0xe0e0e0]));
		group.add(this.creatLine([i,0,-1*size,0xe0e0e0],[i,0,size,0xe0e0e0]));

	var x = this.creatLine([-1*size,0,0,0xff0000],[size,0,0,0x00ff00]); // 创建一个纯色的线段
	var y = this.creatLine([0,-1*size,0,0xff0000],[0,size,0,0x00ff00]); // 创建一个纯色的线段
	var z = this.creatLine([0,0,-1*size,0xff0000],[0,0,size,0x00ff00]); // 创建一个纯色的线段
	group.add(x);
	group.add(y);
	group.add(z);

	this.scene.add(group); // 将画好的辅助线添加到画布场景中。
	return group;
蜡烛图的特点
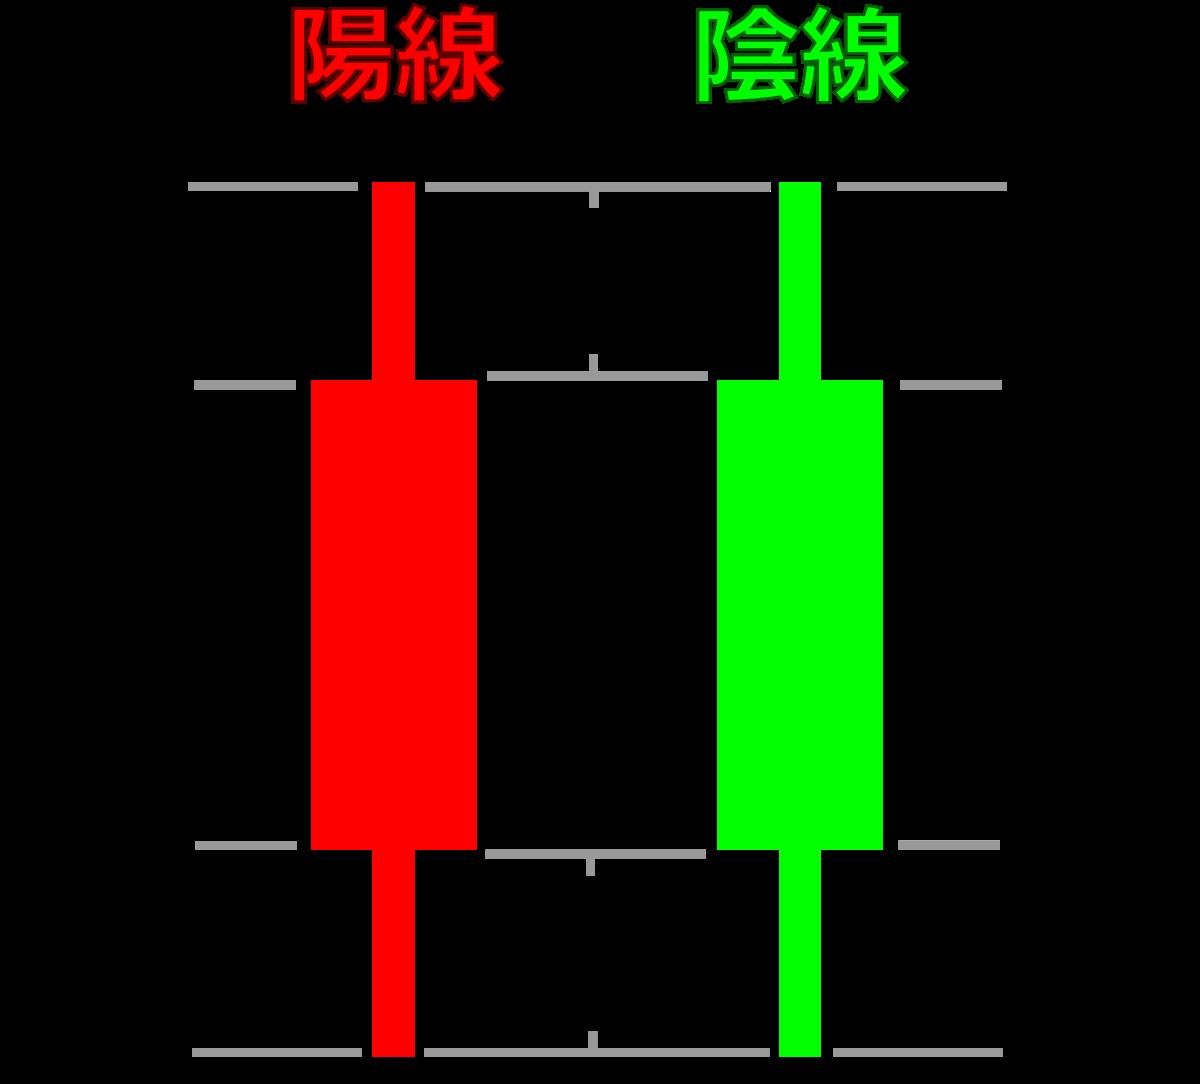
总结几个特点
- 颜色分为:红色,绿色
- 图形组成:矩形,一条线
画小方块
/**
	 * @property Function creatcolorCube 创建纯色方块
	 * @param Number w 宽
	 * @param Number h 高
	 * @param Number l 长
	 * @param Number x 横坐标
	 * @param Number y 纵坐标
	 * @param Number z 深度坐标
	 * @param Hex color 颜色(十六进制)
	 * @param Function action 回调函数
	 * @returns
	 */
	creatcolorCube(w,h,l,x,y,z,color,action)

		var geometry = new THREE.BoxGeometry(w,h,l);
		var material = new THREE.MeshLambertMaterial(color:color);
		var mesh = new THREE.Mesh(geometry,material);
		mesh.position.x = x;
		mesh.position.y = y;
		mesh.position.z = z;

		// 设置了图形的动作函数
		if(typeof action === "function")
			mesh._action = action;

		this.scene.add(mesh); // 添加到场景中
		return mesh;
画蜡烛图
/**
 * @property Function candleCube 画蜡烛图
 * @param Number open 开盘值
 * @param Number close 收盘值
 * @param Number high 区间最高点
 * @param Number low 区间最低点
 * @param Number x 横坐标位置
 */
candleCube(open,close,high,low,x)
	var weight = 0.5; // 矩形的宽度
	var color = 0x000000; // 设置蜡烛图颜色,初始值为黑色

	if(open > close) // 如果开盘值大于收盘值
		color = 0x00ff00; // 设置绿色
	else // 如果开盘值小于收盘值
		color = 0xff0000;

	var hsize = Math.abs(open-close); // 矩形的长度
	var highlowsize = Math.abs(high-low); // 线的长度
	var y = (open+close)/2; // 蜡烛图在Y轴的高度

	// 画线
	var highlow = this.creatcolorCube(0.1,highlowsize,0.1,x,y,0,0x000000);

	// 画矩形
	var openclose = this.creatcolorCube(weight,hsize,weight,x,y,0,color,(thisobj)=>
		thisobj.rotation.y -= 0.06;
	);

	// 当被点击时的事件
	openclose._onclick = function()
		console.log("openclose._onclick");


	// 当鼠标移入时的事件
	openclose._onMouseOn = function()
		console.log("openclose.position:");


	// 当鼠标移出时的事件
	openclose._onMouseLeave = function()
		console.log("openclose._onMouseLeave");
大致上,功能就基本完成了。我们开始测试一下。
测试数据
var data2 = [];
var size = 30;
var temp =
	open: 5 ,
	close: 5 ,
	high: 10 ,
	low: 10

data2.push(temp)
for(var i = 1;i<100;i++)
	// 对测试数据做了一些约束。以避免展示效果乱七八糟。
	temp =
		open: data2[data2.length-1].open + (-1)**Math.round(Math.random()*1)*Math.round(Math.random()*2) + (-1)**Math.round(Math.random()*1)*Math.round(Math.random()*1),
		close: data2[data2.length-1].open + (-1)**Math.round(Math.random()*1)*Math.round(Math.random()*1),
		high: data2[data2.length-1].high + (-1)**Math.round(Math.random()*1)*Math.round(Math.random()*2) + (-1)**Math.round(Math.random()*1)*Math.round(Math.random()*1),
		low: data2[data2.length-1].high + (-1)**Math.round(Math.random()*1)*Math.round(Math.random()*1)

	console.log(temp)
	data2.push(temp)
运行展示
var theChart = this.initcoordinate(100);

// 画坐标系与辅助线
theChart._action = (thisobj)=>
	// thisobj.rotation.y += 0.001;


// 导入数据,画蜡烛图
var length = data2.length;
for(var i=0; i<length;i++)
	console.log(i,':',data2[i].open,data2[i].close,data2[i].high,data2[i].low)

	this.candleCube(data2[i].open,data2[i].close,data2[i].high,data2[i].low,i-50);
以上是关于用JS自制表格软件玩数据9. 自制三维 K线图 蜡烛图的主要内容,如果未能解决你的问题,请参考以下文章