用JS自制表格软件玩数据5. 渲染出整个Excel单元格
Posted 妇男主任
tags:
篇首语:本文由小常识网(cha138.com)小编为大家整理,主要介绍了用JS自制表格软件玩数据5. 渲染出整个Excel单元格相关的知识,希望对你有一定的参考价值。
读取文件,渲染表格
当写完本系列后,我会把源代码分享出来给大家。本课程也会持续更新与矫正。欢迎留言指正!
经过前面几节内容的准备工作之后,终于到了要渲染表格的环节。渲染表格的模块,继承自渲染器。
结构设计
现在到了开始渲染表格的示例代码:
/**
 * 表格渲染类
 */
class table_render extends renderDOM

	/**
	* 初始化表格
	*/
	constructor()
		super();
在开始写代码的时候,先了解一下:表格如何工作的:
模块细节
全局计数器
安排了 creatGlobalId 作为一个简单的全局ID计数器。目前把它设计成为自增。
creatGlobalId()
	return "_"+this.GlobalId++;
渲染表格
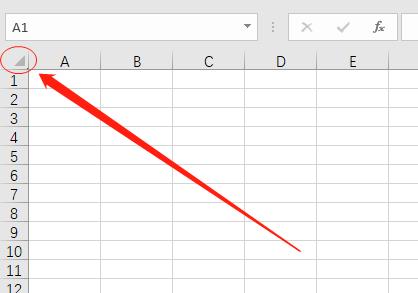
左上角的标签

Tags.push(
	"Tag" : "div", "ID" : this.creatGlobalId(), "ClassName" : "cells__spacer",
	"Action":
		"click":function()
			// console.log("选择全部");
			var cells__inputs = document.getElementsByClassName("cells__input");
			var length = cells__inputs.length;
			for(var i = 0;i<length;i++)
				cells__inputs[i].style.backgroundColor = "#f3f2f1";
				that.focus["cells"].push(cells__inputs[i].getAttribute("id"));


			that.focus.x = 0;
			that.focus.y = 0;
			return false;
		,
		"change":function()

);
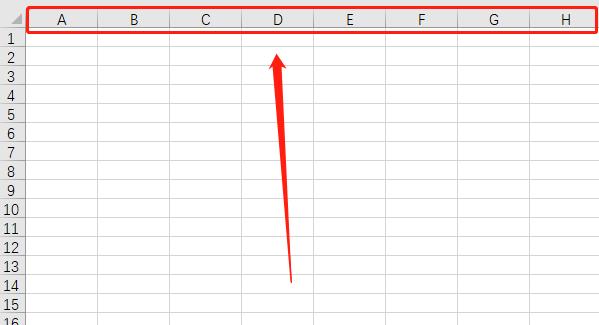
渲染列坐标

// 打印列号
while(col != x)

	Tags.push(
		"Tag" : "div", "ID" : col, "ClassName" : "cells__alphabet", "Text" : col,
		"Data" : [
			 "k":"x", "v":col ,
			 "k":"y", "v":"0"
		],
		"Action":
			"click":that.colclick.bind(that),
			"dblclick":function(),
			"change":function(),
			"mousemove":function()
				//更改鼠标样式
				if (event.offsetX > this.offsetWidth - 10)
					this.style.cursor = 'col-resize';
				else
					this.style.cursor = 'default';
			,
			"mouseover":function(),
			"mouseout":function(),
			"mousedown":function(),
			"mouseup":function(),
			"contextmenu":that.colcontextmenu.bind(that)

	);

	that.focus["ColumnsSize"].push("200px")
	col = that.charcode.excel_Row_Increase(col,1);
渲染行坐标

// 打印行号
for(i = 1; !(i > y); i++ )
	Tags.push(
		"Tag" : "div", "ID" : ""+i, "ClassName" : "cells__number", "Text" : ""+i,
		"Data" : [
			 "k":"x", "v":"0" ,
			 "k":"y", "v":i
		],
		"Action":
			"click":that.rowclick.bind(that),
			"change":function(),
			"mousemove":function()
				//更改鼠标样式
				if (event.offsetY > this.offsetHeight - 10)
					this.style.cursor = 'row-resize';
				else
					this.style.cursor = 'default';
			,
			"contextmenu":that.rowcontextmenu.bind(that)

	);
	that.focus["RowsSize"].push("25px")
渲染单元格
这是渲染结果

var cellsTags = [];
col = "A";
for(i = 1; !(i > y); i++ )
while(col != x)
cellsTags.push(
"Tag" : "div", "ID" : col+i, "ClassName" : "cells__input", "Text" : "",
"Data" : [
"k":"merge", "v": col+i+":"+col+i ,
"k":"t", "v":"" ,
"k":"v", "v":"" ,
"k":"w", "v":"" ,
"k":"f", "v":"" ,
"k":"x", "v":""+col ,
"k":"y", "v":i
],
"Action":
"click":that.cellclick.bind(that),
"dblclick":that.celldblclick.bind(that),
"change":that.cellchange.bind(that),
"mouseover":that.cellmouseover.bind(that),
"mouseout":that.cellmouseout.bind(that),
"mousedown":that.cellmousedown.bind(that),
"mouseup":that.cellmouseup.bind(that),
"contextmenu":that.cellcontextmenu.bind(that)
);
col = that.charcode.excel_Row_Increase(col,1);
col = "A";
this.renderDOM('cells',cellsTags,function(target) ,function(target)