Qt Widget使用QCustomPlot库实现二维螺旋曲线(螺旋曲线一)
Posted 火山上的企鹅
tags:
篇首语:本文由小常识网(cha138.com)小编为大家整理,主要介绍了Qt Widget使用QCustomPlot库实现二维螺旋曲线(螺旋曲线一)相关的知识,希望对你有一定的参考价值。
GitHub 源码: QWidgetLearningPro
QT 其它文章请点击这里: QT 学习笔记
姊妹篇: Qt QML 在Map中使用实现二维螺旋曲线(螺旋曲线二)
一、要实现的螺旋曲线
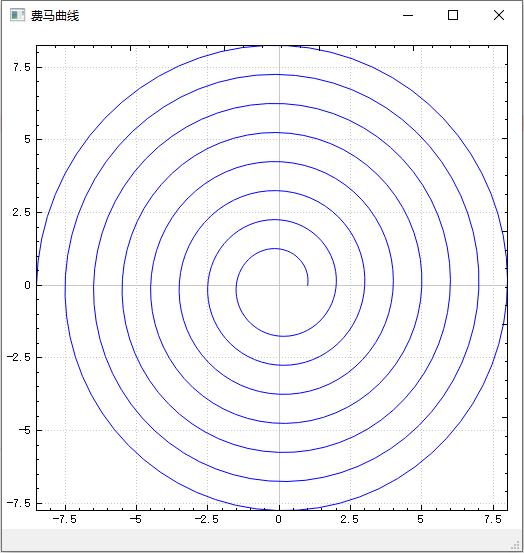
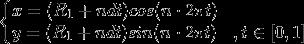
二、方程式:
设R1为内径,n为圈数,d为圈距。
提供的源码:
  // create empty curve objects:
    QCPCurve *fermatSpiral1 = new QCPCurve(m_customPlot->xAxis, m_customPlot->yAxis);
    // set the same step between xAxis and yAxis
    QCPAxisTickerFixed *ticker = new QCPAxisTickerFixed;
    ticker->setTickStep(1);
    m_customPlot->xAxis->setTicker(QSharedPointer<QCPAxisTicker>(ticker));
    m_customPlot->yAxis->setTicker(QSharedPointer<QCPAxisTicker>(ticker));
    // generate the curve data points:
    const int pointCount = 500;
    QVector<QCPCurveData> dataSpiral1(pointCount);
    for (int i=0; i<pointCount; ++i)

        double phi = i/(double)(pointCount-1);
        double N = 7.5;//圈数
        double d_Inner = 5;//内径
        double d = 0.81;//圈距
        double Dis =N*d*phi;//外径 - 内径
        dataSpiral1[i] = QCPCurveData(i, (d_Inner + Dis)*qCos(N*phi*2*M_PI), (d_Inner + Dis)*qSin(N*phi*2*M_PI));

    // pass the data to the curves; we know t (i in loop above) is ascending, so set alreadySorted=true (saves an extra internal sort):
    fermatSpiral1->data()->set(dataSpiral1, true);
    // color the curves:
    fermatSpiral1->setPen(QPen(Qt::blue));
以上参考:二维螺旋曲线方程式,弧长计算及作图实现
三、 QCustomPlot 图形库运用
QCustomPlot 它是一个基于Qt C++的图形库,用于绘制和数据可视化 - 制作漂亮的2D图 - 曲线图、趋势图、坐标图、柱状图等,并为实时可视化应用程序提供高性能服务。它没有进一步的依赖关系,并有着良好的文档记录。
① 官网下载源码:Download QCustomPlot
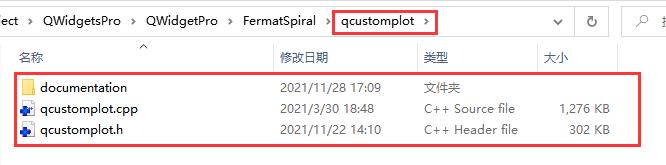
② 复制关键文件,包括qcustomplot.cpp、qcustomplot.h 和帮助文档
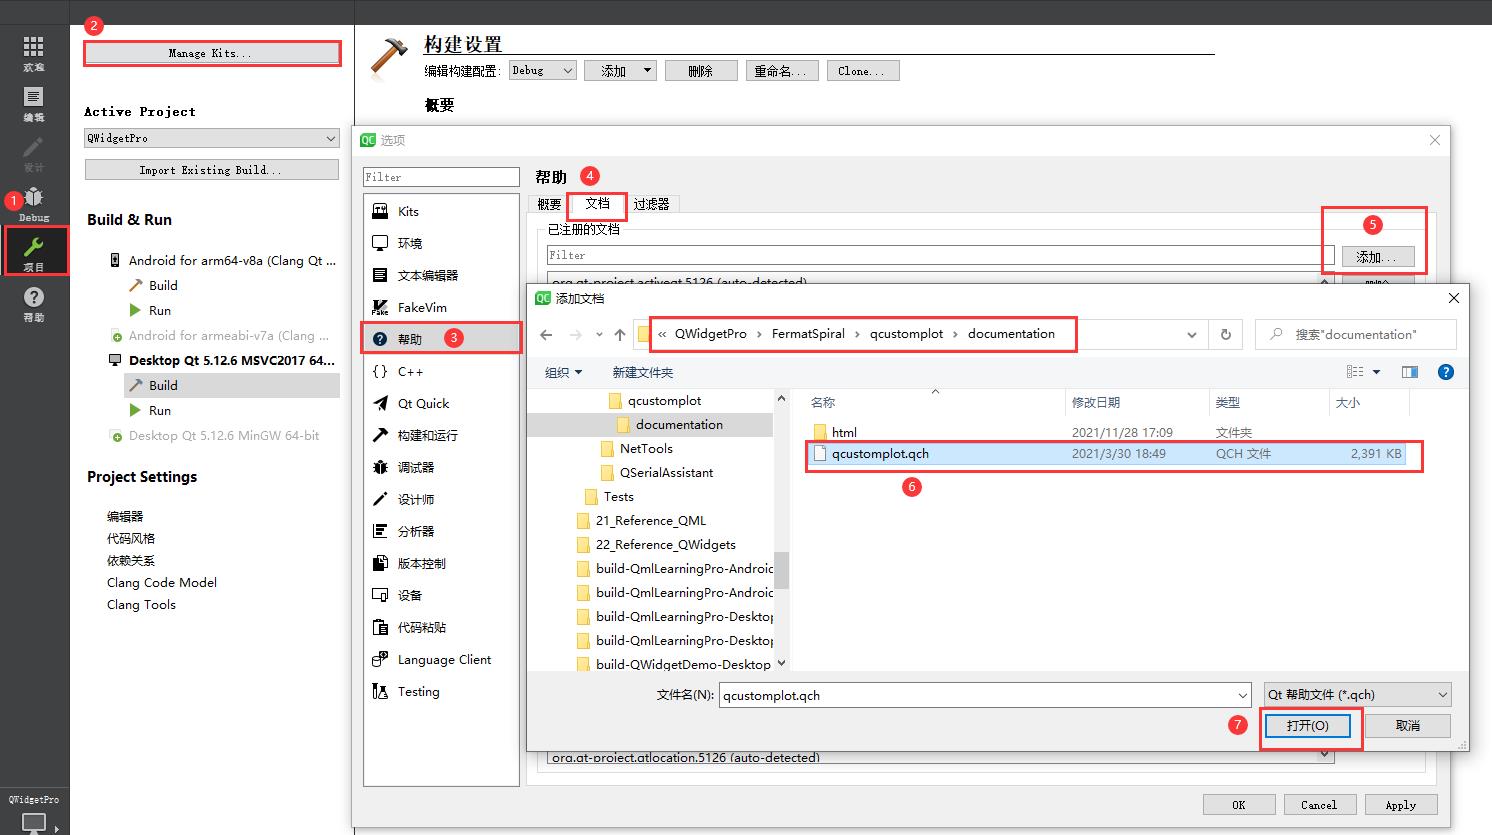
③ 添加帮助文档:
④ 工程文件配置:
#在 pro 中需要添加(由于QCustomPlot中存在导出功能,使用了printsupport模块)
QT += printsupport
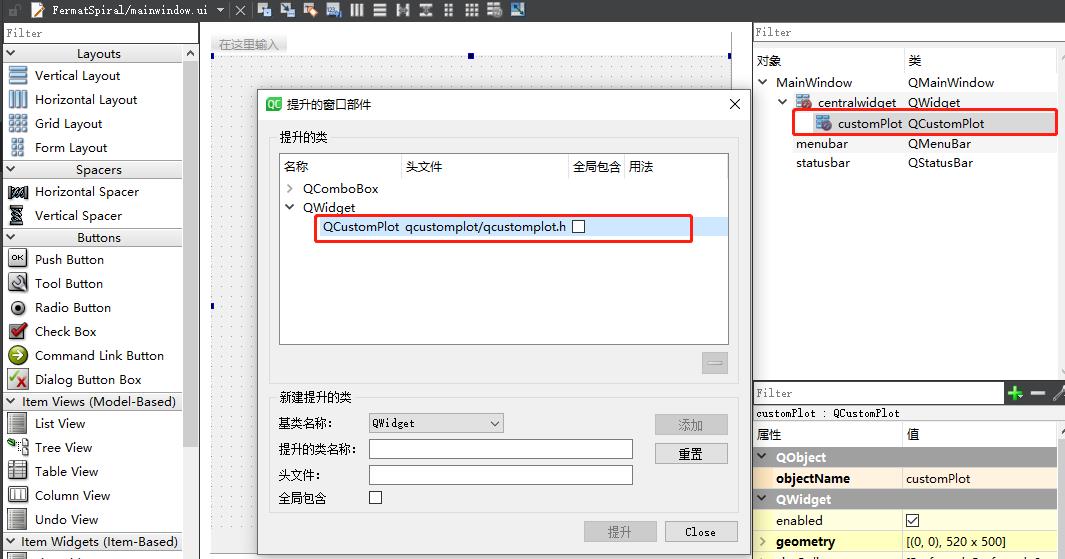
⑤ ui 中添加一个widget,然后提升为QCustom
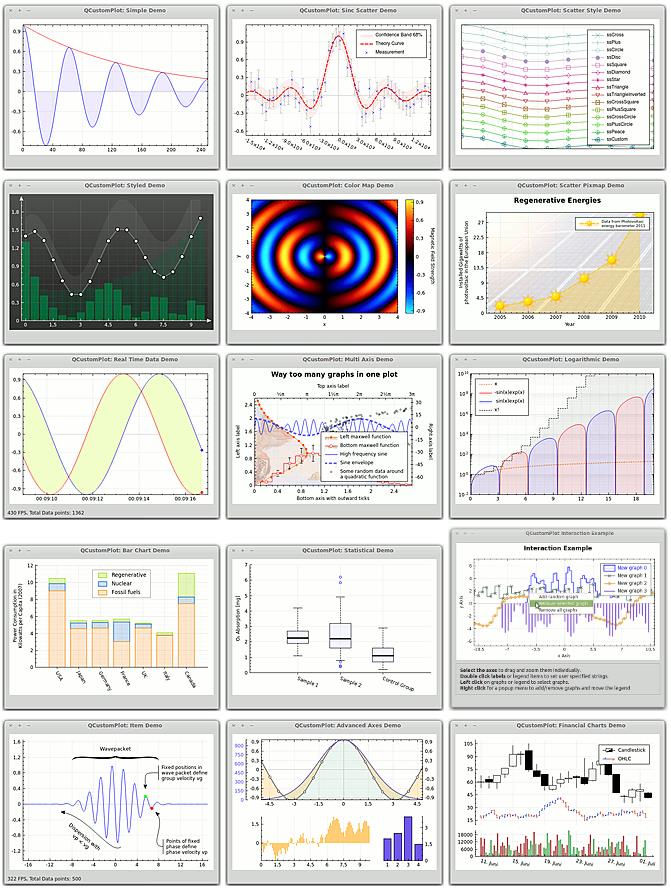
⑥ 原生 QCustomPlot 中实现的图表:
四、关键代码
添加自己的螺旋曲线的代码:
关键代码:(mainwindow.cpp 中)
#include "mainwindow.h"
#include "ui_mainwindow.h"

MainWindow::MainWindow(QWidget *parent)
    : QMainWindow(parent)
    , ui(new Ui::MainWindow)

    ui->setupUi(this);
    setWindowTitle("费马曲线");
    setupfermatSpiralDemo(ui->customPlot);


void MainWindow::setupfermatSpiralDemo(QCustomPlot *customPlot)

  // create empty curve objects:
  QCPCurve *fermatSpiral = new QCPCurve(customPlot->xAxis, customPlot->yAxis);

  // generate the curve data points:
  const int pointCount = 500;
  QVector<QCPCurveData> dataSpiral(pointCount),dataSpiral1(pointCount);

  double count =    7.5;        //圈数
  double disInner = 1;          //内径
  double interval = 1;          //圈距

  for (int i=0; i<pointCount; ++i)

    double phi = i/static_cast<double>((pointCount-1));
    double dis = count * interval * phi;                //外径 - 内径
    dataSpiral[i] = QCPCurveData(i, (disInner + dis)*qCos(count*phi*2*M_PI), (disInner + dis)*qSin(count*phi*2*M_PI));

  // pass the data to the curves; we know t (i in loop above) is ascending, so set alreadySorted=true (saves an extra internal sort):
  fermatSpiral->data()->set(dataSpiral, true);
  customPlot->axisRect()->setupFullAxesBox();
  customPlot->rescaleAxes();


MainWindow::~MainWindow()

    delete ui;
参考:
GitHub 源码: QWidgetLearningPro
QT 其它文章请点击这里: QT 学习笔记
以上是关于Qt Widget使用QCustomPlot库实现二维螺旋曲线(螺旋曲线一)的主要内容,如果未能解决你的问题,请参考以下文章
Qt Widget使用QCustomPlot库实现二维螺旋曲线(螺旋曲线一)