多渠道归因分析(Attribution):python实现Shapley Value
Posted 悟乙己
tags:
篇首语:本文由小常识网(cha138.com)小编为大家整理,主要介绍了多渠道归因分析(Attribution):python实现Shapley Value相关的知识,希望对你有一定的参考价值。
本篇主要是python实现马尔科夫链归因,关联的文章:
- 多渠道归因分析(Attribution):传统归因(一)
- 多渠道归因分析:互联网的归因江湖(二)
- 多渠道归因分析:python实现马尔可夫链归因(三)
- 多渠道归因分析(Attribution):python实现Shapley Value(四)
- 多渠道归因分析(Attribution):用attention-RNN来做归因建模(附代码demo)(五)

文章目录
1 概念
1.1 夏普里值(Shapley Value)
夏普里值(Shapley Value)指所得与自己的贡献匹配的一种分配方式,由诺贝尔奖获得者夏普里(Lloyd Shapley)提出,它对合作博弈在理论上的重要突破及其以后的发展带来了重大影响。

这里最终计算的值是特征i的重要程度。前面一部分分式表示的是权重, 后面一部分括号内表示的是新增特征i前后的变化值。
我们如何用这个方法来分析不同渠道的贡献度呢? 下面是一个例子,
假设有3个渠道:信息流(A),开屏(B),视频前贴©,他们的独自投放效果和两两投放效果如下图所标识。
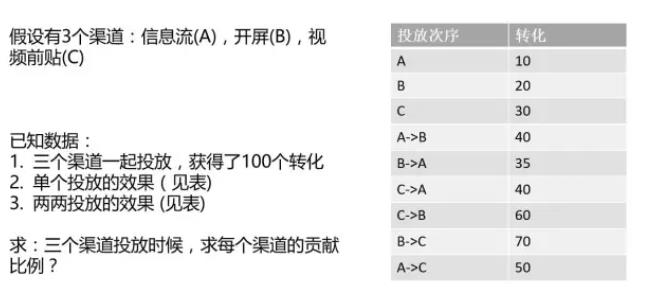
下面,我们来计算,每一个渠道的夏普里值,夏普里值的定义:是在各种可能的联盟次序下,参与者对联盟的边际贡献之和除以各种可能的联盟组合。
三个渠道,有3*2种联盟次序,具体计算如下:
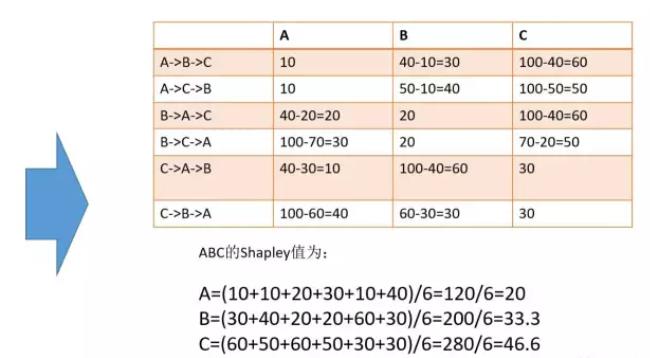
因此,信息流的夏普里值为20,开屏的夏普里值为33.3,视频前贴的夏普里值为46.6。
关于shap值计算,也可以参考:数据运营36计(四):互联网广告渠道归因分析之Sharply Value
1.2 SHAP值和马尔科夫链 归因的比较
相同点:
- 两者并非将每条转化路径归因后求和,而是理清关系后求整体中的每个渠道的影响力
- 不管是沙普利还是马尔科夫,积极地参与转化会是提高本身影响力的最佳方法
- 无论是沙普利值和马尔科夫链哪种方法得到的归因结果都只能代表过去,要应用于未来的预算分配和媒体采购的话,我们还需要进行测试比较变化
不同点:
- 相比沙普利值,马尔科夫链的接触点先后顺序更被突出,而且这种顺序表现在紧邻的两个接触点移动的概率。这里说的紧邻的含义是马尔可夫链就是这样一个任性的过程,它将来的状态分布只取决于现在,跟过去无关
- 从计算成本的角度上讲,沙普利值的计算只要参加的渠道总数不是很多计算还不会太复杂。因此谷歌采用沙普利值也容易理解,而且每天只更新一次。马尔科夫链的计算要复杂很多,现在通常的做法是用超过一百万条随机路径来模拟每一个参加渠道的影响,而不是像我们例子中精确计算,计算成本要大许多。
2 python实现
笔者暂时读了一篇blog (Marketing Attribution - Sharpley Value Approach) + paper(Shapley Value Methods for Attribution Modeling in Online Advertising),从两篇来看,有三种实现:
- 1.1提到的传统的shapley value的方式,出自:blog (Marketing Attribution - Sharpley Value Approach)
- paper中的简化传统版本的方法:Simplified Shapley Attribution Model
- paper中的升级版sharpley 模型:Ordered Shapley Attribution Model
2.1 传统的shapley value方式
博客链接:Marketing Attribution - Sharpley Value Approach
github代码:Multi-Touch-Attribution_ShapleyValue
While there are many data driven choices, two notable options stood out, Shapley Value Attribution and Markov-Chain Attribution.
简单来看看数据格式:
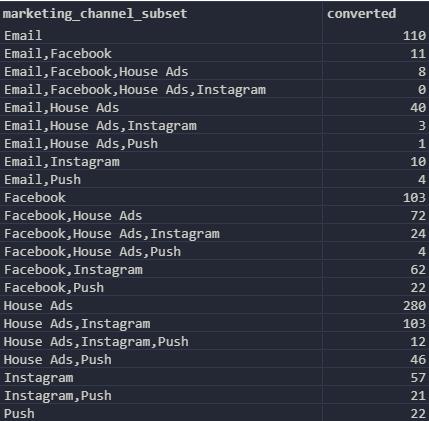
channel subset,都是成功转化的链路,用逗号分隔
converted是该链路出现的次数
核心计算shapley 函数为:
### calculate shapley value
def calculate_shapley(df, channel_name, conv_name):
    '''
    This function returns the shapley values
            - df: A dataframe with the two columns: ['channel_name', 'conv_name'].
            The channel_subset column is the channel(s) associated with the conversion and the
            count is the sum of the conversions.
            - channel_name: A string that is the name of the channel column
            - conv_name: A string that is the name of the column with conversions
            **Make sure that that each value in channel_subset is in alphabetical order.
            Email,PPC and PPC,Email are the same in regards to this analysis and
            should be combined under Email,PPC.
    '''
    # casting the subset into dict, and getting the unique channels
    c_values = df.set_index(channel_name).to_dict()[conv_name]
    df['channels'] = df[channel_name].apply(lambda x: x if len(x.split(",")) == 1 else np.nan)
    channels = list(df['channels'].dropna().unique())

    v_values = {}
    for A in power_set(channels): #generate all possible channel combination
        v_values[','.join(sorted(A))] = v_function(A,c_values)
    n=len(channels) #no. of channels
    shapley_values = defaultdict(int)

    for channel in channels:
        for A in v_values.keys():
            if channel not in A.split(","):
                cardinal_A=len(A.split(","))
                A_with_channel = A.split(",")
                A_with_channel.append(channel)
                A_with_channel=",".join(sorted(A_with_channel))
                weight = (factorial(cardinal_A)*factorial(n-cardinal_A-1)/factorial(n)) # Weight = |S|!(n-|S|-1)!/n!
                contrib = (v_values[A_with_channel]-v_values[A]) # Marginal contribution = v(S U {i})-v(S)
                shapley_values[channel] += weight * contrib
        # Add the term corresponding to the empty set
        shapley_values[channel]+= v_values[channel]/n

    return shapley_values
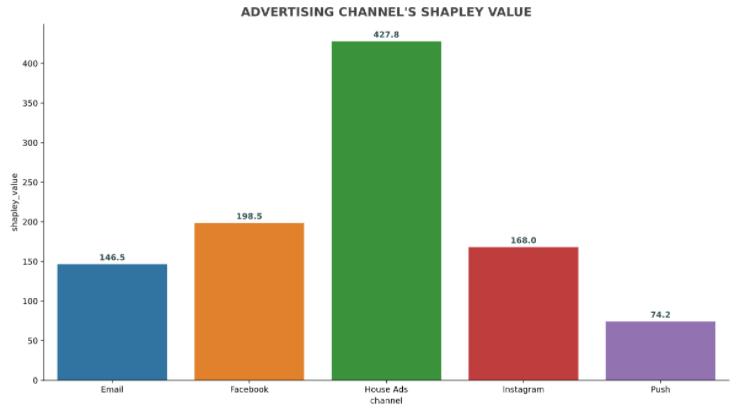
从计算结果来看,可以发现不同渠道的贡献度,计算的方式就跟1.1的一样:

那么作者在博客最后也提到了待改进的地方,没有考虑到channel之间的顺序
所有访问A/B渠道的用户都有相同的组合{A,B}
2.2 传统shapley 升级版
论文:Shapley Value Methods for Attribution Modeling in Online Advertising
github链接: ianchute/shapley-attribution-model-zhao-naive
2.2.1 Simplified Shapley Value Method
例如,在一个活动中有20个频道,总计排列组合的数目为1,048 576。
因此,执行原公式是不可行的对广告业绩进行大规模数据分析或及时评估,
因此,推导了一个简化的Shapley值计算公式。具体可参考论文,笔者着急复现,没细读。。
from simplified_shapley_attribution_model import SimplifiedShapleyAttributionModel
import json

with open("data/sample.json", "r") as f:
    journeys = json.load(f)

o = SimplifiedShapleyAttributionModel()
result = o.attribute(journeys)

print(f"Total value: {len(journeys)}")
total = 0
for k, v in result.items():
    print(f"Channel {k}: {v:.2f}")
    total += v

print(f"Total of attributed values: {total:.2f}")
输出结果:
Total value: 2392
Channel 1: 73.73
Channel 2: 92.38
Channel 3: 118.34
Channel 4: 248.21
Channel 5: 75.04
Channel 6: 55.02
Channel 7: 33.14
Channel 8: 52.95
Channel 9: 189.29
Channel 10: 209.82
Channel 11: 106.80
Channel 12: 77.08
Channel 13: 201.28
Channel 14: 55.02
Channel 15: 64.87
Channel 16: 154.71
Channel 17: 76.80
Channel 18: 5.06
Channel 19: 12.55
Channel 20: 489.91
Total of attributed values: 2392.00
返回的字典表示{渠道:渠道贡献度}
2.2.2 Ordered Shapley Value Method
在上一节简化公式的基础上,我们将Shapley值法进一步推广到结合用户访问的渠道的订购效果,我们称之为结果方法为有序Shapley值法。
一般Shapley值方法的一个主要问题是忽略了用户可能采取的特定路径来实现转换。
它以不考虑通道在转换路径中出现的顺序的方式处理通道。
(这里就是markov跟shapley的差异了)
touchpoints的长度是由最长的路径决定,
2.2.3 Ordered Shapley Value Method的解析
来看一个解析图:
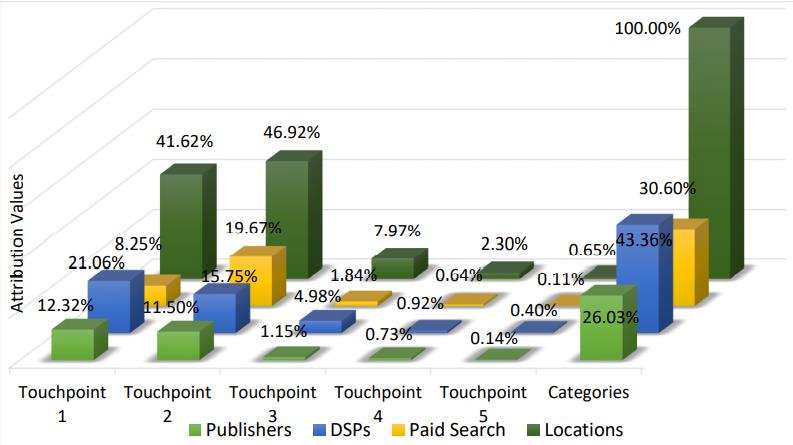
touchpoint的长度取决于,路径的最大长度:
The longest conversion journey in the current dataset consists of 11 touchpoints
所有数值相加等于100%,
Touchpoint 1 在所有传递路径中重要性最大,基本91.59%以上
- 在point 1 -> 2 ,paid search 渠道的重要性突出,
- 在point 3 -> 5,DSPs渠道发挥了更多作用
延申一个问题,如果point 1 贡献了91.59%以上,那么是不是直接用规则模型中的
first click就可以了?
先来新建一组实验,将【paid search -> conv】通过搜索进入,马上购买的人删除(只有两个渠道的),呈现了以下的结果:
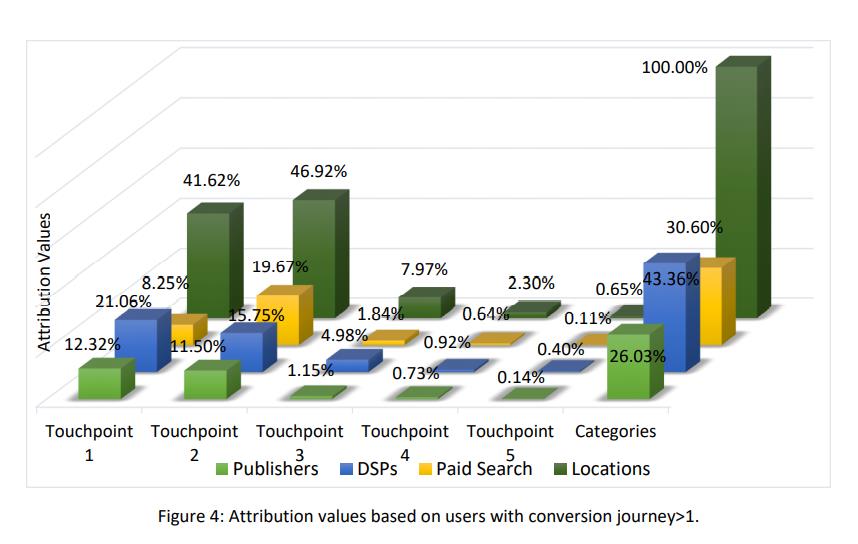
此图说明,如果将两个渠道的链路去掉的话,那么剩下的路径来做shapley value值,就会跟之前差异很大。
paid search 从43.76% -> 8.25%,其他两个渠道的重要性在上升。
所以,出于不同目的,已经对数据的预处理,都会非常影响整分析结果。
相对来说,paid search 对于Ordered Shapley Value Method来说,就是一种比较常见的异常情况了
不过,从paid search高份额来看,营销角度有多种可能:
- 忠诚客较多,目标非常明确
- 线下活动曝光充足,种草较好,直接进行搜索购买
以上是关于多渠道归因分析(Attribution):python实现Shapley Value的主要内容,如果未能解决你的问题,请参考以下文章
多渠道归因分析(Attribution):python实现Shapley Value
多渠道归因分析(Attribution):用attention-RNN来做归因建模(附代码demo)
多渠道归因分析(Attribution):用attention-RNN来做归因建模(附代码demo)