使用Python,EoN模拟网络中的疾病扩散模型,并结合matplotlib绘图
Posted 程序媛一枚~
tags:
篇首语:本文由小常识网(cha138.com)小编为大家整理,主要介绍了使用Python,EoN模拟网络中的疾病扩散模型,并结合matplotlib绘图相关的知识,希望对你有一定的参考价值。
写这篇博客源于博友的提问,好奇EoN是什么,然后安装研究了一下~。

1. EoN是什么
这本教科书为网络科学领域提供了一个令人兴奋的新的补充,其特点是模型与其数学起源的更强有力和更有条理的联系,并解释了这些模型如何相互关联,特别关注网络上的流行病传播。
作者开发了名为Eon的python包,可以非常方便地模拟网络中的疾病扩散模型。
2. 安装
https://epidemicsonnetworks.readthedocs.io/en/latest/GettingStarted.html#
pip install EoN
EoN需要numpy、scipy和matplotlib。如果您没有它们,并且您通过pip进行安装,这些将自动添加。一些可视化工具提供了对动画的支持,但是制作动画需要安装ffmpeg之类的东西。
3. 效果图
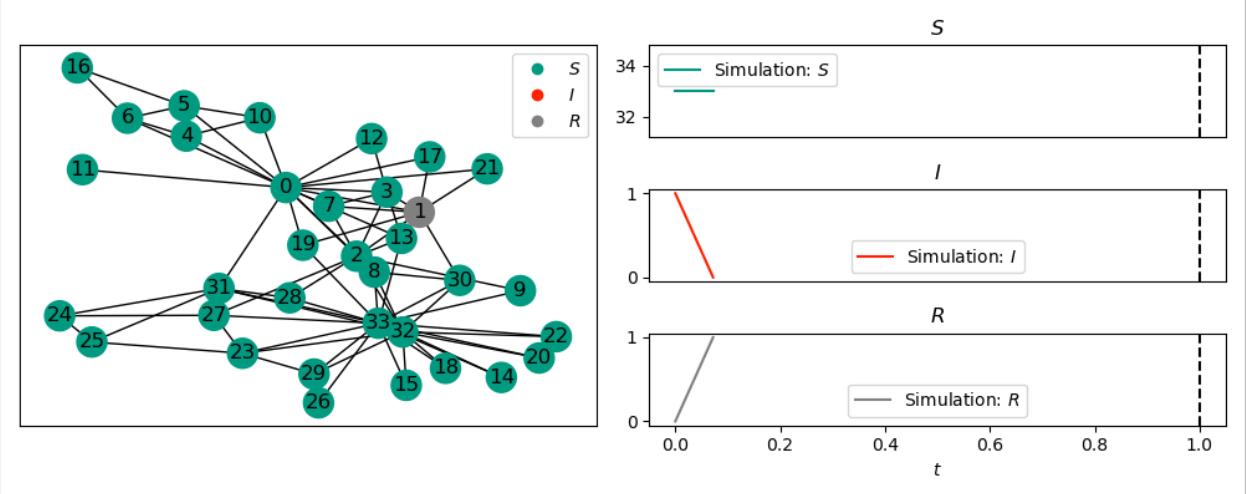
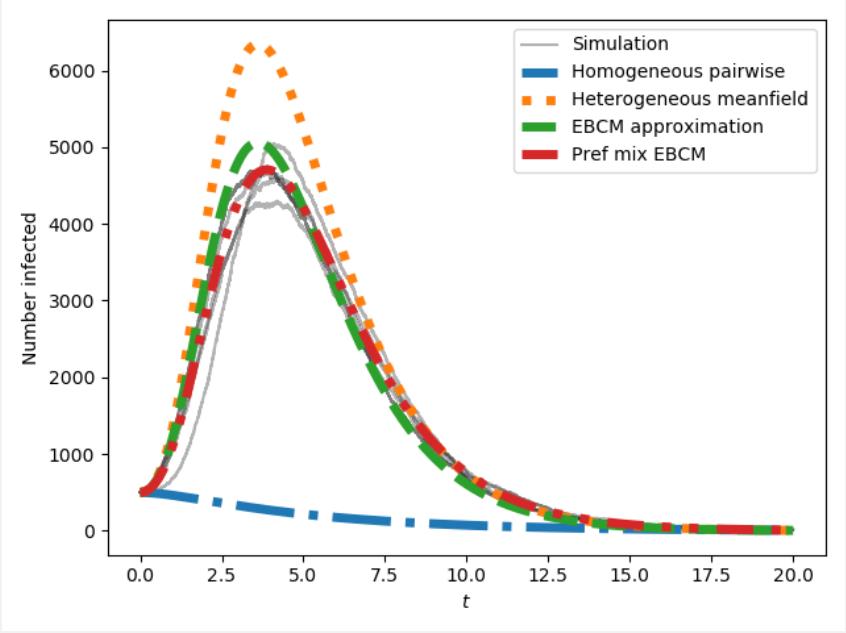
看不太懂是在整啥,看一个demo的效果图:

demo2效果图:

4. 源代码
4.1 源码
import EoN
import matplotlib.pyplot as plt
import networkx as nx

G = nx.karate_club_graph()
nx_kwargs = {"with_labels": True}
print('doing Gillespie simulation')
sim = EoN.Gillespie_SIR(G, 1, 1, return_full_data=True)
print('done with simulation, now plotting')
sim.display(time=1, **nx_kwargs)

plt.show()
4.2 源码
# EoN官网demo

import EoN
import matplotlib.pyplot as plt
import networkx as nx

N = 10 ** 5
G = nx.barabasi_albert_graph(N, 5)  # create a barabasi-albert graph

tmax = 20
iterations = 5  # run 5 simulations
tau = 0.1  # transmission rate
gamma = 1.0  # recovery rate
rho = 0.005  # random fraction initially infected

for counter in range(iterations):  # run simulations
    t, S, I, R = EoN.fast_SIR(G, tau, gamma, rho=rho, tmax=tmax)
    if counter == 0:
        plt.plot(t, I, color='k', alpha=0.3, label='Simulation')
    plt.plot(t, I, color='k', alpha=0.3)

# Now compare with ODE predictions.  Read in the degree distribution of G
# and use rho to initialize the various model equations.
# There are versions of these functions that allow you to specify the
# initial conditions rather than starting from a graph.

# we expect a homogeneous model to perform poorly because the degree
# distribution is very heterogeneous
t, S, I, R = EoN.SIR_homogeneous_pairwise_from_graph(G, tau, gamma, rho=rho, tmax=tmax)
plt.plot(t, I, '-.', label='Homogeneous pairwise', linewidth=5)

# meanfield models will generally overestimate SIR growth because they
# treat partnerships as constantly changing.
t, S, I, R = EoN.SIR_heterogeneous_meanfield_from_graph(G, tau, gamma, rho=rho, tmax=tmax)
plt.plot(t, I, ':', label='Heterogeneous meanfield', linewidth=5)

# The EBCM model does not account for degree correlations or clustering
t, S, I, R = EoN.EBCM_from_graph(G, tau, gamma, rho=rho, tmax=tmax)
plt.plot(t, I, '--', label='EBCM approximation', linewidth=5)

# the preferential mixing model captures degree correlations.
t, S, I, R = EoN.EBCM_pref_mix_from_graph(G, tau, gamma, rho=rho, tmax=tmax)
plt.plot(t, I, label='Pref mix EBCM', linewidth=5, dashes=[4, 2, 1, 2, 1, 2])

plt.xlabel('$t$')
plt.ylabel('Number infected')

plt.legend()
plt.plot()
plt.show()
# plt.savefig('SIR_BA_model_vs_sim.png')
参考
以上是关于使用Python,EoN模拟网络中的疾病扩散模型,并结合matplotlib绘图的主要内容,如果未能解决你的问题,请参考以下文章