MATLAB 折线图手绘风格(漫画风格)修饰器
Posted slandarer
tags:
篇首语:本文由小常识网(cha138.com)小编为大家整理,主要介绍了MATLAB 折线图手绘风格(漫画风格)修饰器相关的知识,希望对你有一定的参考价值。
0效果


1实现方法
大部分实现方法都是保存为图片后再扭曲,欸,我就要直接画,就是玩。
2代码使用
很简单,就只需要加一行 comicAxes([]) 即可
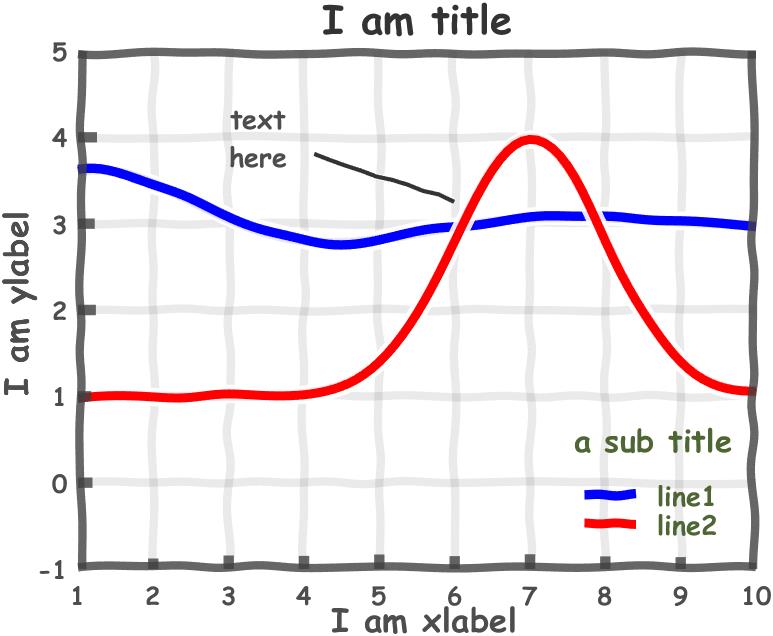
3demo
代码
x=1:0.1:10;
y1=sin(x).*exp(-x/3) + 3;
y2=3*exp(-(x-7).^2/2) + 1;

ax=gca;
ax.XLim=[1,10];
ax.YLim=[-1,5];
hold(ax,'on')
grid on
box on
plot(x,y1,'b');
plot(x,y2,'r');


title('I am title')
xlabel('I am xlabel')
ylabel('I am ylabel')
lgd=legend({'line1','line2'},'location','southeast');
title(lgd,'a sub title')

% annotation一定要被添加至UserData才能被检测到
ax.UserData{1}=annotation(ax.Parent,'textarrow',[0.4 0.56],[0.74 0.67],'String',{'text','here'},'HorizontalAlignment','left');
get(ax.UserData{1})


comicAxes(ax)
前

后

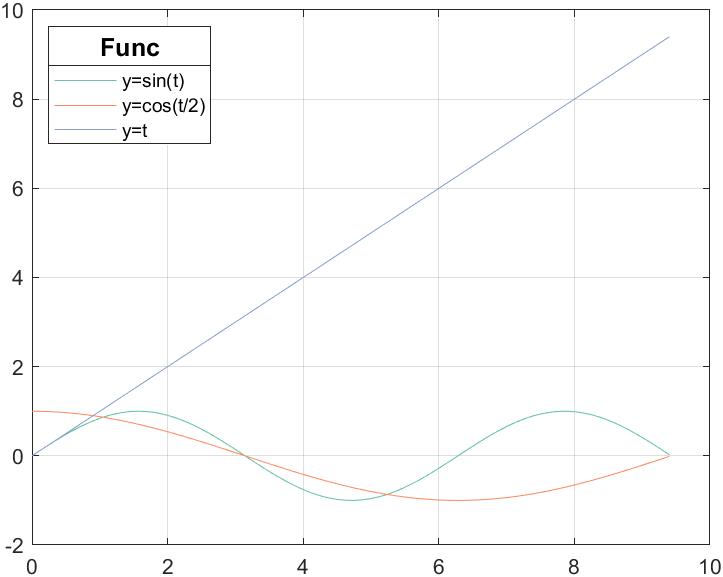
代码
t=0:0.1:3*pi;
plot(t,sin(t),'Color',[0.4 0.76 0.65])
hold on
grid on
plot(t,cos(t./2),'Color',[0.99 0.55 0.38])
plot(t,t,'Color',[0.55 0.63 0.8])

lgd=legend('y=sin(t)','y=cos(t/2)','y=t');
lgd.Location='northwest';
title(lgd,'Func','FontSize',12)


comicAxes([])
前
后

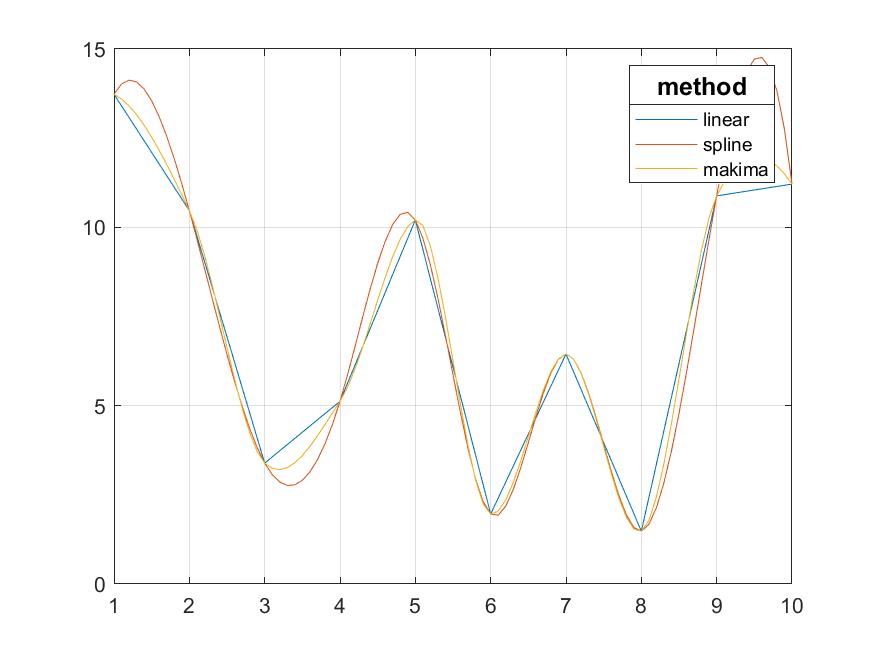
代码
t=1:10;
y1=rand([1,10])*15;
plot(t,y1)
hold on
grid on
tq=1:0.1:10;
y2=interp1(t,y1,tq,'spline');
plot(tq,y2)
y3=interp1(t,y1,tq,'makima');
plot(tq,y3)
lgd=legend('linear','spline','makima');
lgd.Location='northeast';
title(lgd,'method','FontSize',12)
saveas(gcf,'1.png')
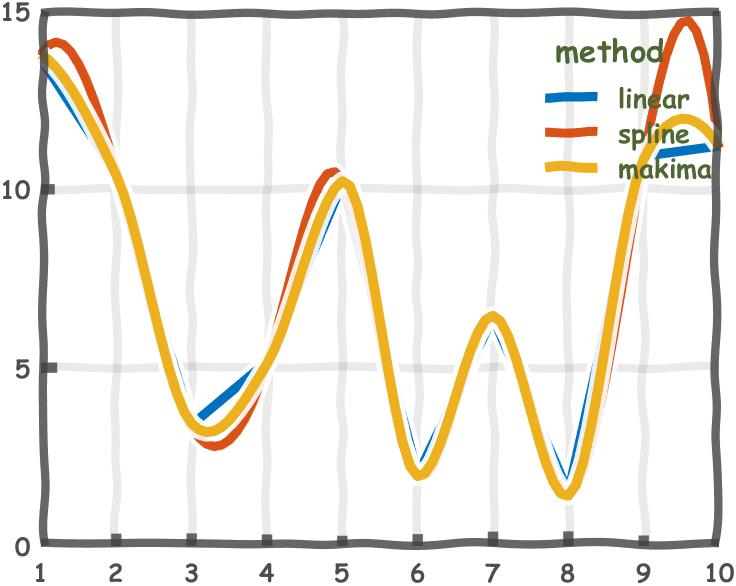
comicAxes([])
前
后
4完整代码
function ax=comicAxes(ax)
% @author:slandarer
% 获取要处理的坐标区域 ====================================================
if ~isempty(ax)
else
ax=gca;
end
hold(ax,'on')
% 为了保证各部分比例的初始修饰 ============================================
n=1;
for i=length(ax.Children):-1:1
if strcmp(get(ax.Children(i),'type'),'line')
ax.Children(i).LineWidth=4+rand();
lineSet(n)=ax.Children(i);
n=n+1;
end
end
n=1;textflag=false;
for i=length(ax.Children):-1:1
if strcmp(get(ax.Children(i),'type'),'text')
textflag=true;
textSet(n)=ax.Children(i);
n=n+1;
end
end
if ~isempty(ax.Title.String)
ax.Title.FontSize=19;
ax.Title.FontWeight='bold';
ax.Title.FontName='Comic Sans MS';
ax.Title.Color=[0.2,0.2,0.2];
end
if ~isempty(ax.XLabel.String)
ax.XLabel.FontSize=16;
end
if ~isempty(ax.YLabel.String)
ax.YLabel.FontSize=16;
end
if ~isempty(ax.Legend)
ax.Legend.AutoUpdate='off';
ax.Legend.FontSize=13;
ax.Legend.Title.FontSize=15;
ax.Legend.Title.FontWeight='bold';
ax.Legend.Title.FontName='Comic Sans MS';
ax.Legend.FontWeight='bold';
ax.Legend.FontName='Comic Sans MS';
ax.Legend.TextColor=[0.5,0.6,0.3];
ax.Legend.Box='off';
end
% 网格重绘 ================================================================
if strcmp(ax.XGrid,'on')&&~isempty(ax.XTick)
ax.XGrid='off';
for i=1:length(ax.XTick)
if ax.XTick(i)~=ax.XLim(1)&&ax.XTick(i)~=ax.XLim(2)
ySet=linspace(ax.YLim(1),ax.YLim(2),20);
xSet=ones(1,length(ySet)).*ax.XTick(i)+(rand([1,length(ySet)])-0.5).*(ax.XLim(2)-ax.XLim(1)).*0.006;
nYSet=linspace(ax.YLim(1),ax.YLim(2),100);
nXSet=interp1(ySet,xSet,nYSet,'spline');
plot(ax,nXSet,nYSet,'Color',[0.2 0.2 0.2 0.1],'LineWidth',4)
end
end
end
if strcmp(ax.YGrid,'on')&&~isempty(ax.YTick)
ax.YGrid='off';
for i=1:length(ax.YTick)
if ax.YTick(i)~=ax.YLim(1)&&ax.YTick(i)~=ax.YLim(2)
xSet=linspace(ax.XLim(1),ax.XLim(2),20);
ySet=ones(1,length(xSet)).*ax.YTick(i)+(rand([1,length(xSet)])-0.5).*(ax.YLim(2)-ax.YLim(1)).*0.006;
nXSet=linspace(ax.XLim(1),ax.XLim(2),100);
nYSet=interp1(xSet,ySet,nXSet,'spline');
plot(ax,nXSet,nYSet,'Color',[0.2 0.2 0.2 0.1],'LineWidth',4)
end
end
end
% 图像重绘 ================================================================
for i=1:length(lineSet)
if strcmp(get(lineSet(i),'type'),'line')
%lineSet(i).Visible='off';
xSet=linspace(ax.XLim(1),ax.XLim(2),20);
ySet=(rand([1,length(xSet)])-0.5).*(ax.YLim(2)-ax.YLim(1)).*0.01;
nYSet=interp1(xSet,ySet,lineSet(i).XData,'spline');
plot(ax,lineSet(i).XData,lineSet(i).YData+nYSet,'LineWidth',lineSet(i).LineWidth+4.5,'Color',[1 1 1 .9])
plot(ax,lineSet(i).XData,lineSet(i).YData+nYSet,'LineWidth',lineSet(i).LineWidth,'Color',lineSet(i).Color)
end
end
% 坐标轴重绘 ==============================================================
ax.XColor='none';
ax.YColor='none';
xSet=linspace(ax.XLim(1),ax.XLim(2),20);
ySet=ones(1,length(xSet)).*ax.YLim(1)+(rand([1,length(xSet)])+0.2).*(ax.YLim(2)-ax.YLim(1)).*0.006;
nXSet=linspace(ax.XLim(1),ax.XLim(2),100);
nYSet=interp1(xSet,ySet,nXSet,'spline');
plot(ax,nXSet,nYSet,'Color',[0.25,0.25,0.25,0.8],'LineWidth',4)
ySet=linspace(ax.YLim(1),ax.YLim(2),20);
xSet=ones(1,length(ySet)).*ax.XLim(1)+(rand([1,length(ySet)])+0.2).*(ax.XLim(2)-ax.XLim(1))以上是关于MATLAB 折线图手绘风格(漫画风格)修饰器的主要内容,如果未能解决你的问题,请参考以下文章
如何使用MATLAB绘制ggplot风格图片(散点图及折线图)
如何使用MATLAB绘制ggplot风格图片(散点图及折线图)
如何使用MATLAB绘制ggplot风格图片(散点图及折线图)
如何使用MATLAB绘制ggplot风格图片(散点图及折线图)
SCI期刊写作必备:代码|手把手绘制目标检测领域YOLO论文常见的性能对比折线图,一键生成YOLOv7等主流论文同款图表,包含多种不同功能风格对比图表