如何使用MATLAB绘制ggplot风格图片(散点图及折线图)
Posted slandarer
tags:
篇首语:本文由小常识网(cha138.com)小编为大家整理,主要介绍了如何使用MATLAB绘制ggplot风格图片(散点图及折线图)相关的知识,希望对你有一定的参考价值。
写了一个用来修饰MATLAB AXES的函数,目前只支持散点图及折线图,之后可能会再出曲面修饰函数或者柱状图修饰函数之类的一系列修饰器,效果如下:
0使用效果

1参数说明
程序主要有以下几个参数:
- ax | 程序的第一个参数,即要作用的AXES区域,如果设置为[]则自动获取gca作为ax。
- AxesTheme | 坐标区域风格,可设置为:‘gray’/‘economist’/‘wsj’/‘own1’
- ColorOrder | 图形对象颜色序列,可设置为:‘default’/‘none’/‘npg’/‘lancet’/‘starterk’/‘Set1’/‘Set2’/‘Set3’/‘Dark2’/‘own1’
- LegendStyle | 图例样式,可设置为:‘ggplot’/‘own1’
- EdgeStyle | 轮廓样式,可设置为:‘none’/‘gray’/‘white’/‘ori’
2基本使用
假设你编写了如下程序:
t=0:0.1:3*pi;
plot(t,sin(t))
hold on
plot(t,cos(t./2))
plot(t,t)

lgd=legend('y=sin(t)','y=cos(t/2)','y=t');
lgd.Location='northwest';
title(lgd,'Func','FontSize',12)
则绘制图像如下:

若在程序最后加上一行:
t=0:0.1:3*pi;
plot(t,sin(t))
hold on
plot(t,cos(t./2))
plot(t,t)

lgd=legend('y=sin(t)','y=cos(t/2)','y=t');
lgd.Location='northwest';
title(lgd,'Func','FontSize',12)

% 修饰用代码
ggplotAxes2D([]);
则结果如下:
这里啥参数都没设,用的就都是默认值。
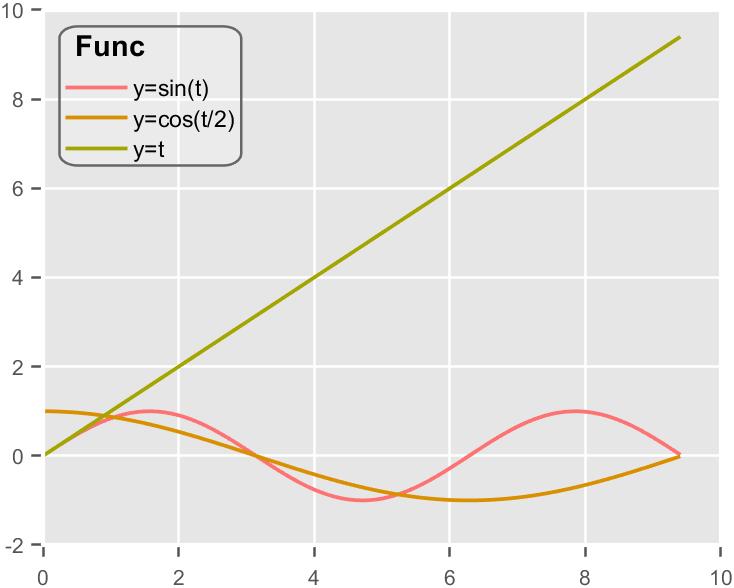
若将最后一句改为:
ggplotAxes2D([],'ColorOrder','Set2');
就能使用Set2风格的配色:

3AXES及图例风格
AxesTheme : gray
LegendStyle : ggplot
ggplotAxes2D([],'AxesTheme','gray','LegendStyle','ggplot','ColorOrder','Set2');
我们发现绘图效果不变,说明这俩是默认值

AxesTheme : economist
LegendStyle : ggplot
ggplotAxes2D([],'AxesTheme','economist','LegendStyle','ggplot','ColorOrder','Set2');

注,若通过该按钮保存则可把背景颜色一同保存:


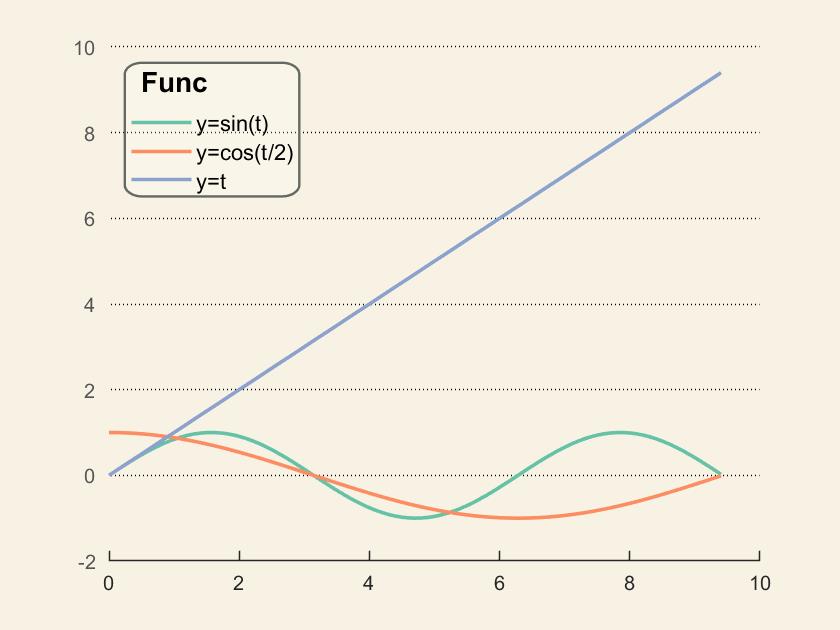
AxesTheme : wsj
LegendStyle : ggplot
ggplotAxes2D([],'AxesTheme','wsj','LegendStyle','ggplot','ColorOrder','Set2');
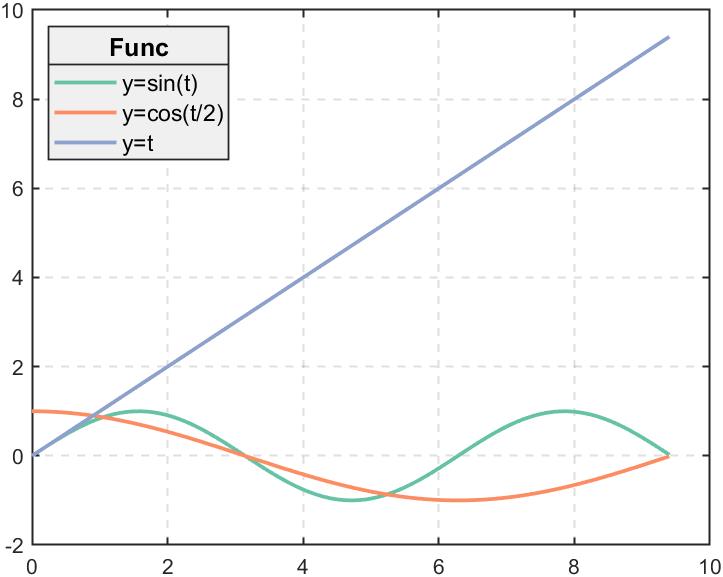
AxesTheme : own1
LegendStyle : own1
ggplotAxes2D([],'AxesTheme','own1','LegendStyle','own1','ColorOrder','Set2');
4边缘风格
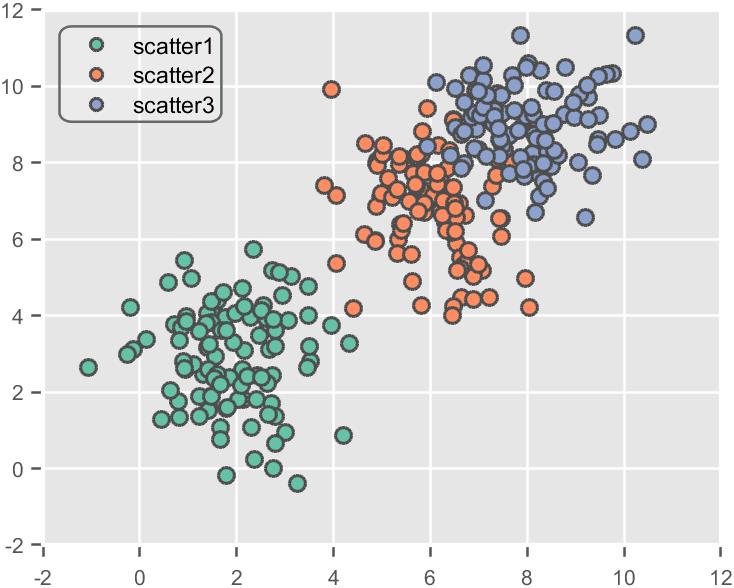
散点图边缘风格
假设编写以下散点图代码:
mu = [2 3];
SIGMA = [1 0; 0 2];
r = mvnrnd(mu,SIGMA,100);
scatter(r(:,1),r(:,2),'filled');
hold on;
mu = [6 7];
SIGMA = [ 1 0; 0 2];
r2 = mvnrnd(mu,SIGMA,100);
scatter(r2(:,1),r2(:,2),'filled')
mu = [8 9];
SIGMA = [ 1 0; 0 1];
r3 = mvnrnd(mu,SIGMA,100);
scatter(r3(:,1),r3(:,2),'filled')
lgd=legend('scatter1','scatter2','scatter3');
lgd.Location='northwest';
运行效果如下:

我们在用修饰器时加入EdgeStyle属性:
EdgeStyle : white
ggplotAxes2D([],'ColorOrder','Set2','EdgeStyle','white');

EdgeStyle : gray
ggplotAxes2D([],'ColorOrder','Set2','EdgeStyle','gray');

EdgeStyle : ori
ori即为边缘使用图形对象原色,但是亮度降低。
ggplotAxes2D([],'ColorOrder','Set2','EdgeStyle','ori');

折线边缘风格
假设我们编写了如下代码:
t=0:0.35:3*pi;
plot(t,sin(t),'Marker','d')
hold on
plot(t,cos(t./2),'Marker','o')
plot(t,t,'Marker','^')

lgd=legend('y=sin(t)','y=cos(t/2)','y=t');
lgd.Location='northwest';
title(lgd,'Func','FontSize',12)
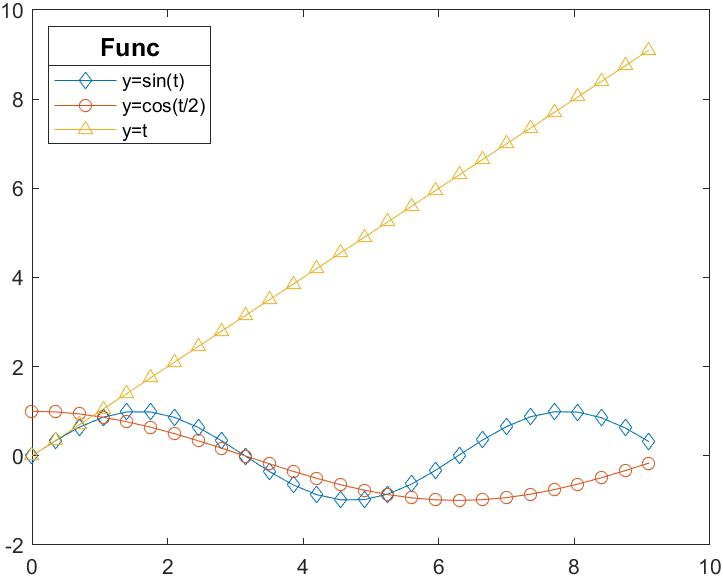
我们也可对其进行一系列修饰,例如:
ggplotAxes2D([],'AxesTheme','wsj','ColorOrder','Set2','EdgeStyle','gray');
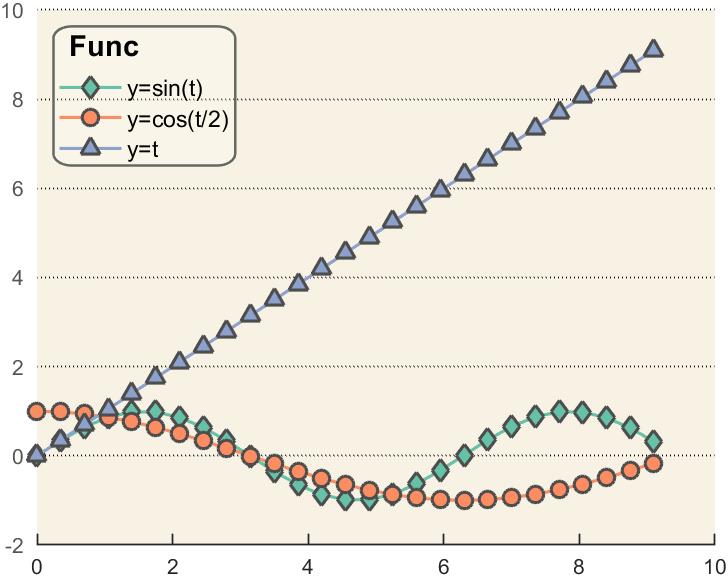
ggplotAxes2D([],'AxesTheme','own1','ColorOrder','own1','EdgeStyle','gray','LegendStyle','own1');

5完整代码
function ax=ggplotAxes2D(varargin)
%
% @author:slandarer
%
% 参数说明:
% -----------------------------------------------------
% AxesTheme   | 坐标区域风格       | 'gray'/'economist'/'wsj'/'own1'
% ColorOrder  | 图形对象颜色序列   | 'default'/'none'/'npg'/'lancet'/'starterk'
%                   'Set1'/'Set2'/'Set3'/'Dark2'/'own1'
% LegendStyle | 图例样式           | 'ggplot'/'own1'
% EdgeStyle   | 轮廓样式           | 'none'/'gray'/'white'/'ori'

% ax.Legend.UserData.NewBkg   图例新背景
% ax.Legend.UserData.NewTitle 图例新标题
% ax.UserData.NewYTick(i)     Y轴新标签

% 获取要处理的坐标区域=====================================================
if strcmp(get(varargin{1},'type'),'axes' )
    ax=varargin{1};
else
    ax=gca;
end
hold(ax,'on')


% default==================================================================
theme.AxesTheme='gray';
theme.ColorOrder='default';
theme.LegendStyle='ggplot';
theme.EdgeStyle='none';

%从可变长度变量中提取有用信息==============================================
for i=1:length(varargin)
    tempVar=varargin{i};
    if strcmp(tempVar,'AxesTheme')||strcmp(tempVar,'axesTheme')||strcmp(tempVar,'axestheme')
        theme.AxesTheme=varargin{i+1};
    end
    if strcmp(tempVar,'ColorOrder')||strcmp(tempVar,'colorOrder')||strcmp(tempVar,'colororder')
        theme.ColorOrder=varargin{i+1};
    end
    if strcmp(tempVar,'LegendStyle')||strcmp(tempVar,'legendStyle')||strcmp(tempVar,'legendstyle')
        theme.LegendStyle=varargin{i+1};
    end
    if strcmp(tempVar,'EdgeStyle')||strcmp(tempVar,'edgeStyle')||strcmp(tempVar,'edgestyle')
        theme.EdgeStyle=varargin{i+1};
    end
end


% 配色方案
switch theme.ColorOrder
    case 'none'
    case 'default'
        ax.ColorOrder=[0.9900    0.4500    0.4500
    0.8500    0.5600         0
    0.6400    0.6500         0
    0.2200    0.7100         0
         0    0.7500    0.4900
         0    0.7500    0.7700
         0    0.6900    0.9600
    0.5800    0.5600    1.0000
    0.9100    0.4200    0.9500
    1.0000    0.3800    0.7400];
    case 'npg'
        ax.ColorOrder=[0.9000    0.2900    0.2100
    0.3000    0.7300    0.8400
         0    0.6300    0.5300
    0.2400    0.3300    0.5300
    0.9500    0.6100    0.5000
    0.5200    0.5700    0.7100
    0.5700    0.8200    0.7600
    0.8600         0         0
    0.4900    0.3800    0.2800
    0.6900    0.6100    0.5200];
    case 'lancet'
        ax.ColorOrder=[     0    0.2700    0.5500
    0.9300         0         0
    0.2600    0.7100    0.2500
         0    0.6000    0.7100
    0.5700    0.3700    0.6200
    0.9900    0.6900    0.5700
    0.6800         0    0.1600
    0.6800    0.7100    0.7100
    0.1100    0.1000    0.1000];
    case 'starterk'
        ax.ColorOrder=[0.8000    0.0500         0
    0.3600    0.5300    0.8500
    0.5200    0.7400         0
    1.0000    0.8000         0
    0.4900    0.5300    0.5600
         0    0.7100    0.8900
         0    0.6900    0.4000];
    case 'Set1'
        ax.ColorOrder=[0.8900    0.1000    0.1100
    0.2200    0.4900    0.7200
    0.3000    0.6900    0.2900
    0.6000    0.3100    0.6400
    1.0000    0.5000         0
    1.0000    1.0000    0.2000
    0.6500    0.3400    0.1600
    0.9700    0.5100    0.7500
    0.6000    0.6000    0.6000];
    case 'Set2'
        ax.ColorOrder=[0.4000    0.7600    0.6500
    0.9900    0.5500    0.3800
    0.5500    0.6300    0.8000
    0.9100    0.5400    0.7600
    0.6500    0.8500    0.3300
    1.0000    0.8500    0.1800
    0.9000    0.7700    0.5800
    0.7000    0.7000    0.7000];
    case 'Set3'
        ax.ColorOrder=[0.5500    0.8300    0.7800
    1.0000    1.0000    0.7000
    0.7500    0.7300    0.8500
    0.9800    0.5000    0.4500
    0.5000    0.6900    0.8300
    0.9900    0.7100    0.3800
    0.7000    0.8700    0.4100
    0.9900    0.8000    0.9000
    0.8500    0.8500    0.8500
    0.7400    0.5000    0.7400
    0.8000    0.9200    0.7700
    0.8300    0.8300    0.8300];
    case 'Dark2'
        ax.ColorOrder=[0.1100    0.6200    0.4700
    0.8500    0.3700    0.0100
    0.4600    0.4400    0.7000
    0.9100    0.1600    0.5400
    0.4000    0.6500    0.1200
    0.9000    0.6700    0.0100
    0.6500    0.4600    0.1100
    0.4000    0.4000    0.4000];
    case 'own1'
        ax.ColorOrder=[0.8500    0.7100    0.8000
    0.3700    0.4400    0.6600
    0.7500    0.6900    0.8300
    0.3700    0.2200    0.5200
    0.8400    0.2500    0.5500
    0.7200    0.5200    0.5200
    0.6100    0.3800    0.6000
    0.0400    0.1400    0.2800
    1.0000    0.5800    0.3500
    0.9500    0.8900    0.7500];
end

% 部分plot scatter修饰
if false
childrenNum=length(ax.Children);
for i=1:childrenNum
    switch theme.EdgeStyle
        case 'none'
            EdgeColor=[];
        case 'gray'
            EdgeColor=[0.3 0.3 0.3];
        case 'white'
            EdgeColor=[0.96 0.96 0.96];
        case 'ori'
            EdgeColor=ax.ColorOrder(mod(i-1,size(ax.ColorOrder,1))+1,:).*0.5;
    end
    switch get(ax.Children(i),'type')
        case 'line'
            ax.Children(i).LineWidth=1.8;
            if ~isempty(EdgeColor)
                ax.Children(i).LineWidth=1.5;
                ax.Children(i).MarkerEdgeColor=EdgeColor;
                ax.Children(i).MarkerSize=8;
                ax.Children(i).MarkerFaceColor=ax以上是关于如何使用MATLAB绘制ggplot风格图片(散点图及折线图)的主要内容,如果未能解决你的问题,请参考以下文章