多层感知器波士顿房价预测
Posted ZHW_AI课题组
tags:
篇首语:本文由小常识网(cha138.com)小编为大家整理,主要介绍了多层感知器波士顿房价预测相关的知识,希望对你有一定的参考价值。
目录
1. 作者介绍
邓越,男,西安工程大学电子信息学院,2021级研究生
研究方向:机器视觉与人工智能
电子邮件:2570878225@qq.com
吴燕子,女,西安工程大学电子信息学院,2021级研究生,张宏伟人工智能课题组
研究方向:模式识别与人工智能
电子邮件:wuyanzi990502@163.com
2. 神经网络多层感知器
多层感知器(Multi-Layer Perceptron,MLP)也叫人工神经网络(Artificial Neural Network,ANN),神经网络通常包含一个输入层, 一个输出层以及若干隐藏层, 输入层只接收输入信息, 通常为数据样本的特征向量, 经过隐藏分层和输出层的处理, 由输出层输出结果. 隐藏层的层数和节点数可以根据实际情况进行调整. 神经网络能够通过学习得到输入与输出的映射关系, 整个训练过程就是不断更新权重以及偏置值, 使得模型预测越来越准确. 通常每个层之间可以加入激活函数引入非线性因素。

2.1 前向传播与反向传播
下式表示了神经网络的前向传播过程,其中,σ为激活函数,可以看出每个神经元的值由上一层的神经元的值与连接权重、偏置值以及激活函数共同决定。

神经网络的反向传播过程,是根据前向传播计算样本输出结果,利用计算结果计算各层梯度,然后根据输出结果及梯度更新权重系数及偏置。
2.2损失函数
损失函数用来评价模型的预测值和真实值不一样的程度,损失函数越好,通常模型的性能越好。不同的模型用的损失函数一般也不一样。
2.3激活函数
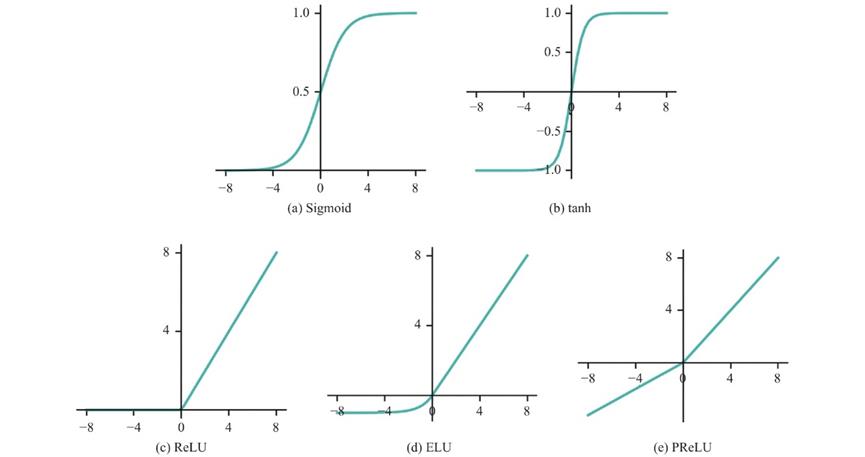
在人工神经网络中, 激活函数用于表示上层神经元输出与下层输入的非线性映射函数, 其主要作用就是增强神经网络的非线性建模能力. 如无特殊说明激活函数一般是非线性函数. 如果不用激活函数, 每一层的输出都是上一层输入的线性函数, 无论神经网络有多少层, 最终的输出都是初始输入的线性变换, 无法拟合现实中很多非线性问题. 引入激活函数后, 使得神经网络可以逼近任何非线性函数, 理论上可以拟合任意分布的数据。
常用的激活函数如图所示:
3. 实验过程
3.1波士顿房价数据集
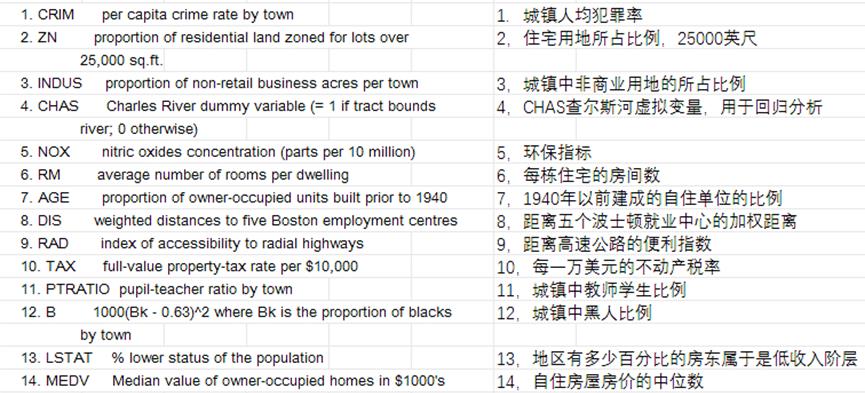
波士顿房价数据集是一个回归问题。每个类的观察值数量是均等的,共有 506 个观察,13 个输入变量和1个输出变量。每条数据包含房屋以及房屋周围的详细信息。其中包含城镇犯罪率,一氧化氮浓度,住宅平均房间数,到中心区域的加权距离以及自住房平均房价等等。
3.2实验代码
1.模块导入
import torch
import torch.nn as nn  # 搭建神经网络
from torch.optim import SGD  # 优化器SGD
import torch.utils.data as Data  # 数据预处理

from skimage.metrics import mean_squared_error
from sklearn.metrics import r2_score    # 使用r2_score对模型评估

from sklearn.datasets import load_boston  # 导入波士顿房价数据
from sklearn.preprocessing import StandardScaler  # 数据标准化
from sklearn.model_selection import train_test_split  # 导入数据集划分模块

import numpy as np

import matplotlib.pyplot as plt
import matplotlib.pyplot as plt2
2.数据预处理
需要将从sklearn导入的数据集中的数据进行划分,分为训练集和测试集,然后对数据进行标准化,因为需要将数据传入pytorch 创建的网络中,因此还要将数据从numpy转化为torch张量。
# 读入数据
boston_X, boston_y = load_boston(return_X_y=True)
x_train, x_test, y_train, y_test = train_test_split(
    boston_X, boston_y, test_size=0.3, random_state=0)

# 标准化数据
ss = StandardScaler(copy=True, with_mean=True, with_std=True)
xs_train = ss.fit_transform(x_train)
sst = StandardScaler(copy=True, with_mean=True, with_std=True)
xs_test = sst.fit_transform(x_test)

# 将数据转化为张量
test_xt = torch.from_numpy(xs_test.astype(np.float32)).cpu()
test_yt = torch.from_numpy(y_test.astype(np.float32)).cpu()
train_xt = torch.from_numpy(xs_train.astype(np.float32)).cpu()
train_yt = torch.from_numpy(y_train.astype(np.float32)).cpu()
3.定义网络模型
定义了一个包含一个输入层、两个隐藏层和一个输出层的多层感知器,在每个隐藏层之后连接了relu激活函数。
# 定义网络模型
class MLPmodel(nn.Module):
    def __init__(self):
        super(MLPmodel, self).__init__()
        # First hidden layer
        self.h1 = nn.Linear(in_features=13, out_features=30, bias=True)
        self.a1 = nn.ReLU()
        # Second hidden layer
        self.h2 = nn.Linear(in_features=30, out_features=10)
        self.a2 = nn.ReLU()
        # regression predict layer
        self.regression = nn.Linear(in_features=10, out_features=1)

    def forward(self, x):
        x = self.h1(x)
        x = self.a1(x)
        x = self.h2(x)
        x = self.a2(x)
        output = self.regression(x)
        return output
4.网络配置
配置DataLoader进行数据加载,设置batch_size大小为32;定义优化器为SGD优化器并设置学习率为0.001,定义了损失函数为均方差损失函数。
device = torch.device('cuda' if torch.cuda.is_available() else 'cpu')

# 制作训练用数据,即关联数据,将输房价特征数据train_xt与房价数据train_y关联
train_data = Data.TensorDataset(train_xt, train_yt)

# 定义一个数据加载器,用于批量加载训练用数据, 让数据分批次进入神经网络
train_loader = Data.DataLoader(dataset=train_data,
                               batch_size=32,
                               shuffle=True,
                               num_workers=0)

mlp_1 = MLPmodel().cpu()
print(mlp_1)

optimizer = SGD(mlp_1.parameters(), lr=0.001)  # 定义优化器 define Optimizer
loss_function = nn.MSELoss()  # 定义损失函数loss function

train_loss_all = []  # 存放每次迭代的误差数据,便于可视化训练过程
5.训练
迭代100次对网络进行训练。
# Train
for epoch in range(100):  # 迭代总轮数
    # 对每个批次进行迭代计算
    for step, (b_x, b_y) in enumerate(train_loader):
        output = mlp_1(b_x).flatten()
        train_loss = loss_function(output, b_y)  # 误差计算
        optimizer.zero_grad()  # 梯度置位,或称梯度清零
        train_loss.backward()  # 反向传播,计算梯度
        optimizer.step()  # 梯度优化
        train_loss_all.append(train_loss.item())
    print("train epoch %d, loss %s:" % (epoch + 1, train_loss.item()))

# 可视化训练过程(非动态)
plt.figure()
plt.plot(train_loss_all, "g-")
plt.title("MLPmodel1: Train loss per iteration")
plt.show()
6.测试及可视化
y_predict = mlp_1(test_xt).reshape(-1)  # 预测

# 网络输出有张量转为numpy
y_predict = y_predict.detach().numpy()
test_yt = test_yt.detach().numpy()

# 与验证值作比较
error = mean_squared_error(test_yt, y_predict).round(5)  # 平方差
score = r2_score(test_yt, y_predict).round(5)  # 相关系数

# 绘制真实值和预测值的对比图
fig = plt.figure(figsize=(13, 7))
plt.rcParams['font.family'] = "sans-serif"
plt.rcParams['font.sans-serif'] = "SimHei"
plt.rcParams['axes.unicode_minus'] = False  # 绘图
plt.plot(range(test_yt.shape[0]), test_yt, color='red', linewidth=1, linestyle='-')
plt.plot(range(test_yt.shape[0]), y_predict, color='blue', linewidth=1, linestyle='dashdot')
plt.legend(['真实值', '预测值'])
plt.title("波士顿房价预测", fontsize=20)
error = "标准差d=" + str(error)+"\\n"+"相关指数R^2="+str(score)
plt.xlabel(error, size=18, color="black")
plt.grid()
plt.show()

plt2.rcParams['font.family'] = "sans-serif"
plt2.rcParams['font.sans-serif'] = "SimHei"
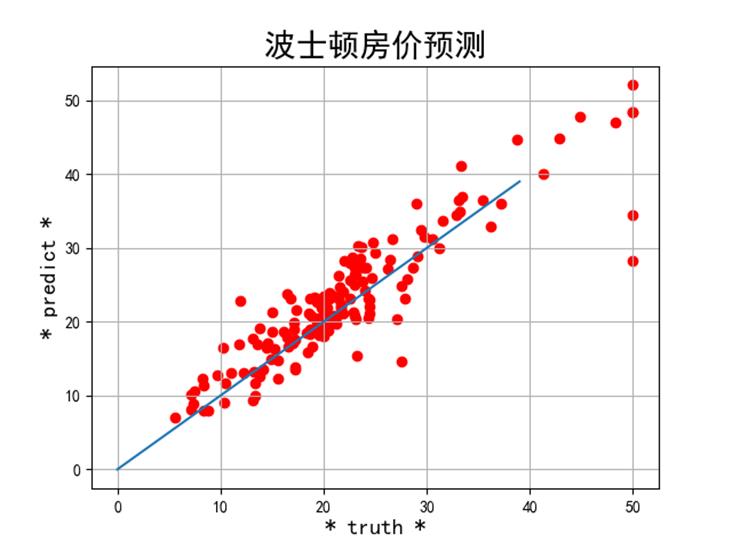
plt2.title('波士顿房价预测', fontsize=20)
xx = np.arange(0, 40)
yy = xx
plt2.xlabel('* truth *', fontsize=14)
plt2.ylabel('* predict *', fontsize=14)
plt2.plot(xx, yy)
plt2.scatter(test_yt, y_predict, color='red')
plt2.grid()
plt2.show()
3.3运行结果
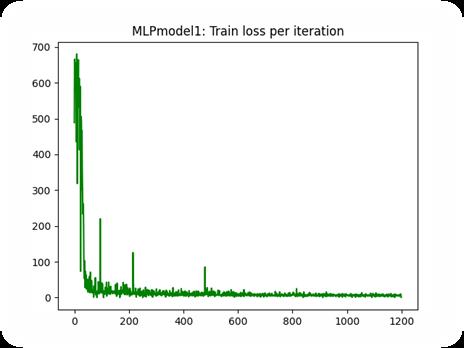
训练过程损失值曲线变化曲线如图:
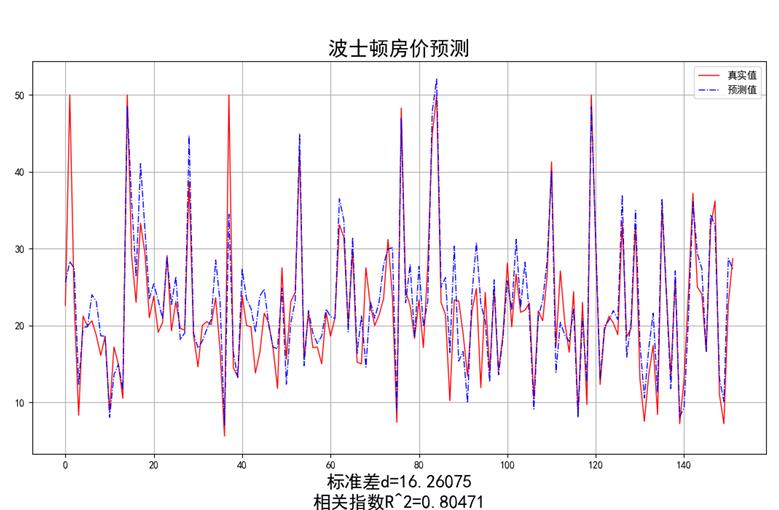
计算测试集上的预测值与真实值标准差和r2相关指数并绘制,如图:
以上是关于多层感知器波士顿房价预测的主要内容,如果未能解决你的问题,请参考以下文章
[Pytorch系列-27]:神经网络基础 - 多输入神经元实现波士顿房价预测