R语言Bass模型进行销售预测
Posted 拓端数据部落
tags:
篇首语:本文由小常识网(cha138.com)小编为大家整理,主要介绍了R语言Bass模型进行销售预测相关的知识,希望对你有一定的参考价值。
原文:http://tecdat.cn/?p=3937
BASS扩散模型
BASS扩散模型三个参数:#最终购买产品的总人数,m; 创新系数p; 和#系数的模仿,
exampleT79<-1:10Tdelt<-(1:100)/10Sales<-c(840,1470,2110,4000,7590,10950,10530,9470,7790,5890)Cusales<-cumsum(Sales)Bass.nls<-nls(Sales~M*(((P+Q)^2/P)*exp(-(P+Q)*T79))/(1+(Q/P)*exp(-(P+Q)*T79))^2,start=list(M=60630,P=0.03,Q=0.38))summary(Bass.nls)#### Formula: Sales ~ M * (((P + Q)^2/P) * exp(-(P + Q) * T79))/(1 + (Q/P) *## exp(-(P + Q) * T79))^2#### Parameters:## Estimate Std. Error t value Pr(>|t|)## M 6.80e+04 3.13e+03 21.74 1.1e-07 ***## P 6.59e-03 1.43e-03 4.61 0.0025 **## Q 6.38e-01 4.14e-02 15.41 1.2e-06 ***## ---## Signif. codes: 0 '***' 0.001 '**' 0.01 '*' 0.05 '.' 0.1 ' ' 1#### Residual standard error: 727 on 7 degrees of freedom#### Number of iterations to convergence: 8## Achieved convergence tolerance: 7.32e-06# get coefficientBcoef <- coef(Bass.nls)m <- Bcoef[1]p <- Bcoef[2]q <- Bcoef[3]
#将M的起始值设置为记录的总销售额。
ngete <- exp(-(p + q) * Tdelt)# plot pdfBpdf <- m * ((p + q)^2/p) * ngete/(1 + (q/p) * ngete)^2plot(Tdelt, Bpdf, xlab = "Year from 1979", ylab = "Sales per year", type = "l")points(T79, Sales)
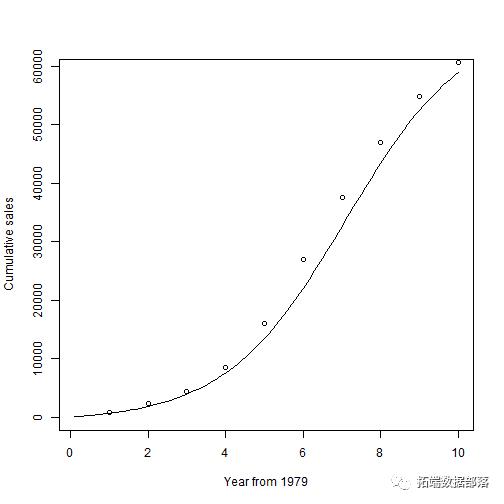
plot cdfBcdf <- m * (1 - ngete)/(1 + (q/p) * ngete)plot(Tdelt, Bcdf, xlab = "Year from 1979", ylab = "Cumulative sales", type = "l")points(T79, Cusales)

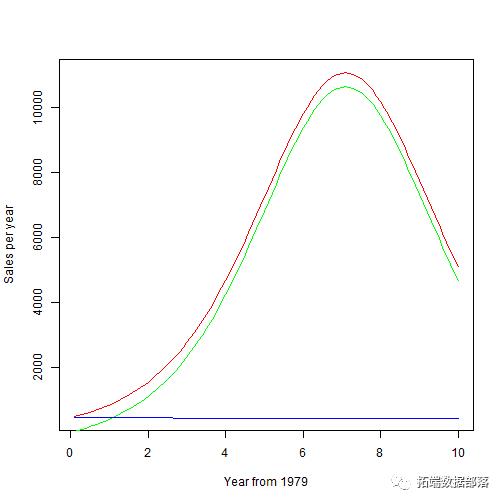
#当q = 0时,只有创新者没有模仿者。Ipdf <- m * ((p + 0)^2/p) * exp(-(p + 0) * Tdelt)/(1 + (0/p) * exp(-(p + 0) *Tdelt))^2# plot(Tdelt, Ipdf, xlab = 'Year from 1979',ylab = 'Isales per year',# type='l')Impdf <- Bpdf - Ipdfplot(Tdelt, Bpdf, xlab = "Year from 1979", ylab = "Sales per year", type = "l",col = "red")lines(Tdelt, Impdf, col = "green")lines(Tdelt, Ipdf, col = "blue")

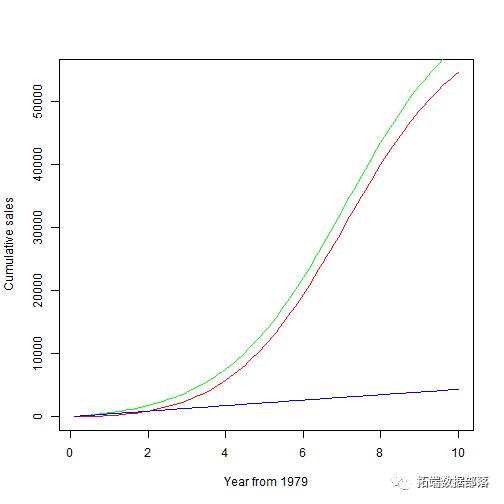
#当q = 0时Icdf <- m * (1 - exp(-(p + 0) * Tdelt))/(1 + (0/p) * exp(-(p + 0) * Tdelt))# plot(Tdelt, Icdf, xlab = 'Year from 1979',ylab = 'ICumulative sales',# type='l')Imcdf <- m * (1 - ngete)/(1 + (q/p) * ngete) - Icdfplot(Tdelt, Imcdf, xlab = "Year from 1979", ylab = "Cumulative sales", type = "l",col = "red")lines(Tdelt, Bcdf, col = "green")lines(Tdelt, Icdf, col = "blue")

点击标题查阅往期内容
更多内容,请点击左下角“阅读原文”查看


![]()
案例精选、技术干货 第一时间与您分享
长按二维码加关注
更多内容,请点击左下角“阅读原文”查看
以上是关于R语言Bass模型进行销售预测的主要内容,如果未能解决你的问题,请参考以下文章
R语言构建xgboost模型:使用xgboost的第一颗树(前N颗树)进行预测推理或者使用全部树进行预测推理比较误分类率指标
R语言基于自定义函数构建xgboost模型并使用LIME解释器进行模型预测结果解释:基于训练数据以及模型构建LIME解释器解释多个iris数据样本的预测结果使用LIME解释器进行模型预测结果解释
R语言基于自定义函数构建xgboost模型并使用LIME解释器进行模型预测结果解释:基于训练数据以及模型构建LIME解释器解释一个iris数据样本的预测结果LIME解释器进行模型预测结果解释并可视化