概率论实验 02 - | 基于Matlab随机数的产生和特性统计
Posted Neutionwei
tags:
篇首语:本文由小常识网(cha138.com)小编为大家整理,主要介绍了概率论实验 02 - | 基于Matlab随机数的产生和特性统计相关的知识,希望对你有一定的参考价值。
一、实验目的
1.了解随机数的产生方法;
2.了解随机数的概率特性;
3.产生实际随机数进行验证。
二、实验原理
随机数的产生有好多方法,可以利用乘积法和同余法产生[0,1]之间的均匀分布,然后利用函数变换法产生所需不同分布的随机数。可以按照所产生的随机数,对落在不同区间的数据进行统计,从而画出所产生随机数的统计特性。所有这些工作我们可以自己动手用MATLAB,VC或VB等语言进行编程实现。
三、实验内容与步骤
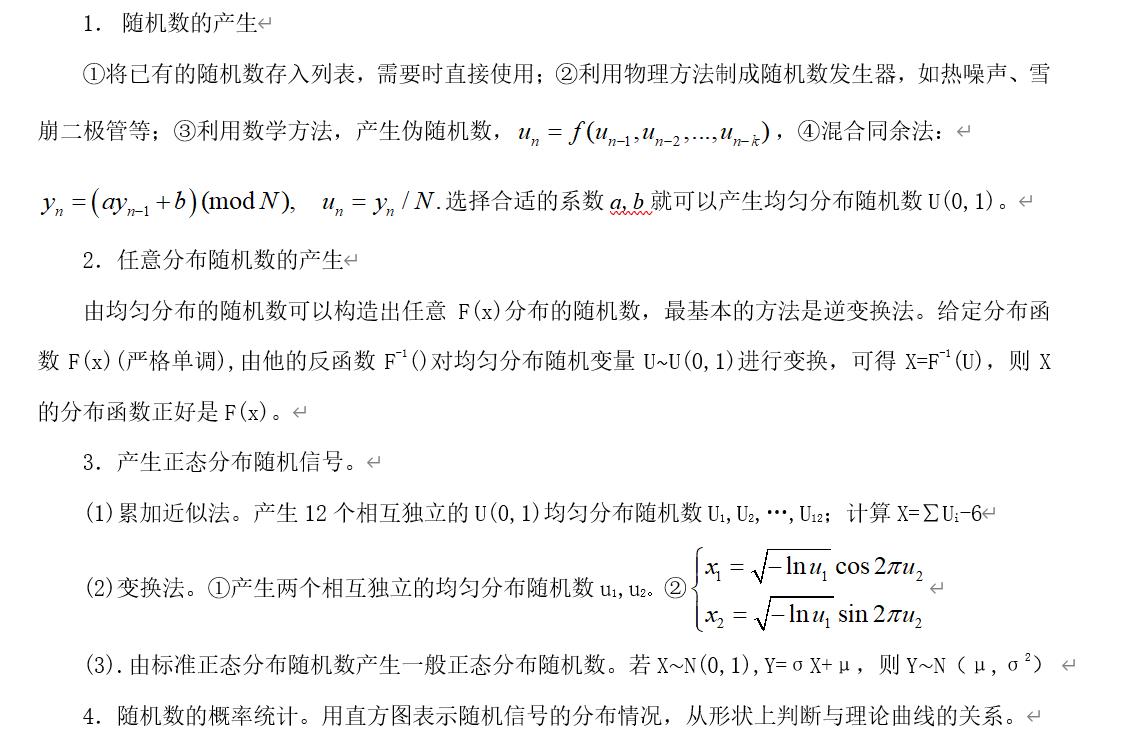
1.
close all
clear all
n=5000;
m=100;
xmin=0,xmax=1;
x=rand(1,n);
subplot(3,1,1);
plot(x,'.');
cc=sprintf('Uniform Distribution,n=%d',n);
title(cc);
subplot(3,1,2);
m1=mean(x);
c2=var(x);
x1=xmin:(xmax-xmin)/m:xmax;
h=hist(x,x1);
bar(x1,h);
grid on
cc=sprintf('Uniform Distribution Histogram n=%d',n);
title(cc);
cc=sprintf('mean=%5.2f',m1);
gtext(cc);
cc=sprintf('C^2=%5.3f',c2);
gtext(cc);
subplot(3,1,3);
pdf1=h/n/((xmax-xmin)/m);
plot(x1,pdf1);
grid on
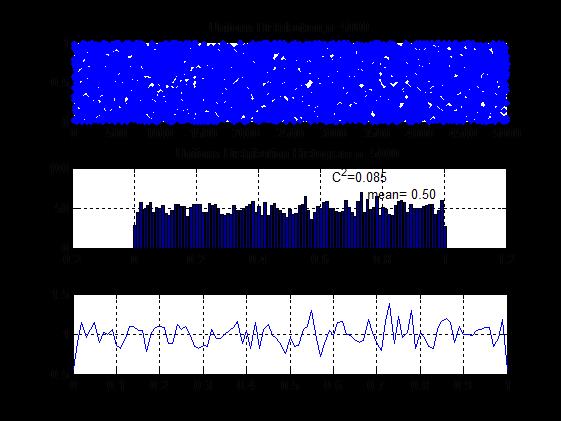
2.
close all
clear all
n=5000;
m=100;
xmin=-5,xmax=5;
x=randn(1,n);
subplot(3,1,1);
plot(x,'.');
cc=sprintf('Uniform Distribution,n=%d',n);
title(cc);
subplot(3,1,2);
m1=mean(x);
c2=var(x);
x1=xmin:(xmax-xmin)/m:xmax;
h=hist(x,x1);
bar(x1,h);
grid on
cc=sprintf('Uniform Distribution Histogram n=%d',n);
title(cc);
cc=sprintf('mean=%5.2f',m1);
gtext(cc);
cc=sprintf('C^2=%5.3f',c2);
gtext(cc);
subplot(3,1,3);
pdf1=h/n/((xmax-xmin)/m);
plot(x1,pdf1);
grid on
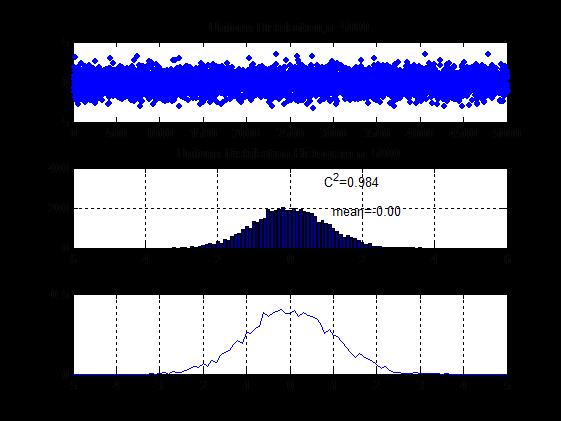
3.
close all
clear all
n=5000;
m=100;
xmin=-5,xmax=5;
x=rand(12,n);
x=sum(x)-6;
subplot(3,1,1);
plot(x,'.');
cc=sprintf('Uniform Distribution,n=%d',n);
title(cc);
subplot(3,1,2);
m1=mean(x);
c2=var(x);
x1=xmin:(xmax-xmin)/m:xmax;
h=hist(x,x1);
bar(x1,h);
grid on
cc=sprintf('Uniform Distribution Histogram n=%d',n);
title(cc);
cc=sprintf('mean=%5.2f',m1);
gtext(cc);
cc=sprintf('C^2=%5.3f',c2);
gtext(cc);
subplot(3,1,3);
pdf1=h/n/((xmax-xmin)/m);
plot(x1,pdf1);
grid on
4.
close all
clear all
n=5000;
m=100;
xmin=-5,xmax=5;
u1=rand(1,n);
u2=rand(1,n)
x=sqrt(-log(u1)).*cos(2*pi*u2);
subplot(3,1,1);
plot(x,'.');
cc=sprintf('Uniform Distribution,n=%d',n);
title(cc);
subplot(3,1,2);
m1=mean(x);
c2=var(x);
x1=xmin:(xmax-xmin)/m:xmax;
h=hist(x,x1);
bar(x1,h);
grid on
cc=sprintf('Uniform Distribution Histogram n=%d',n);
title(cc);
cc=sprintf('mean=%5.2f',m1);
gtext(cc);
cc=sprintf('C^2=%5.3f',c2);
gtext(cc);
subplot(3,1,3);
pdf1=h/n/((xmax-xmin)/m);
plot(x1,pdf1);
grid on
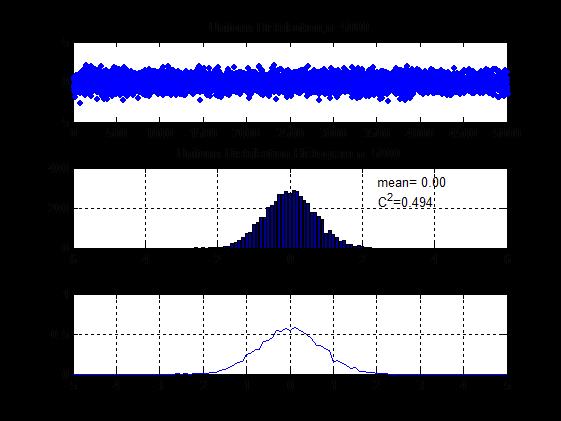
5.
close all
clear all
n=5000;
m=100;
xmin=-3,xmax=8;
y=randn(1,n);
x=y*1+2;
subplot(3,1,1);
plot(x,'.');
cc=sprintf('Uniform Distribution,n=%d',n);
title(cc);
subplot(3,1,2);
m1=mean(x);
c2=var(x);
x1=xmin:(xmax-xmin)/m:xmax;
h=hist(x,x1);
bar(x1,h);
grid on
cc=sprintf('Uniform Distribution Histogram n=%d',n);
title(cc);
cc=sprintf('mean=%5.2f',m1);
gtext(cc);
cc=sprintf('C^2=%5.3f',c2);
gtext(cc);
subplot(3,1,3);
pdf1=h/n/((xmax-xmin)/m);
plot(x1,pdf1);
grid on
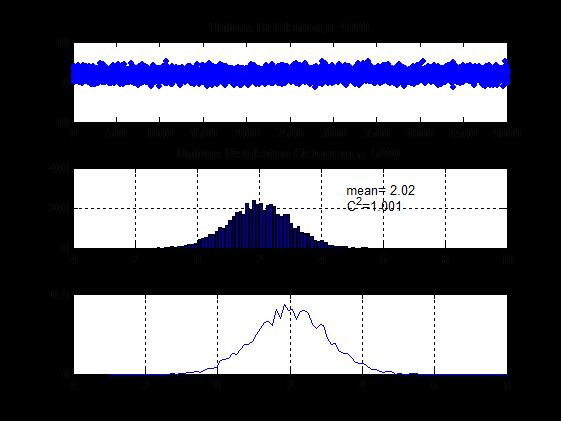
以上是关于概率论实验 02 - | 基于Matlab随机数的产生和特性统计的主要内容,如果未能解决你的问题,请参考以下文章