视觉基础篇15 # 如何用极坐标系绘制有趣图案?
Posted 凯小默
tags:
篇首语:本文由小常识网(cha138.com)小编为大家整理,主要介绍了视觉基础篇15 # 如何用极坐标系绘制有趣图案?相关的知识,希望对你有一定的参考价值。
说明
【跟月影学可视化】学习笔记。
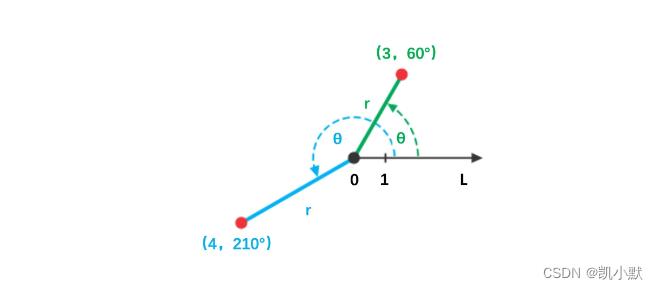
极坐标示意图
极坐标系使用相对极点的距离,以及与 x 轴正向的夹角来表示点的坐标,如(3,60°)。
直角坐标和极坐标相互转换
// 直角坐标影射为极坐标
function toPolar(x, y)
  const r = Math.hypot(x, y);
  const θ= Math.atan2(y, x);
  return [r, θ];


// 极坐标映射为直角坐标
function fromPolar(r, θ)
  const x = r * cos(θ);
  const y = r * sin(θ);
  return [x, y];
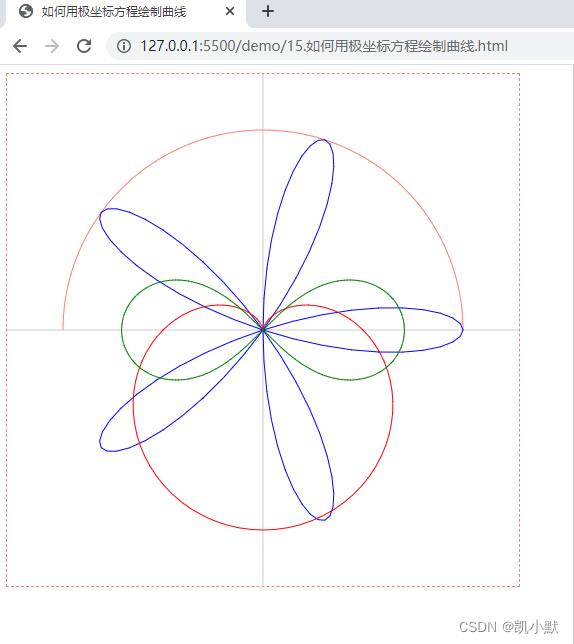
如何用极坐标方程绘制曲线
<!DOCTYPE html>
<html lang="en">
    <head>
        <meta charset="UTF-8" />
        <meta http-equiv="X-UA-Compatible" content="IE=edge" />
        <meta name="viewport" content="width=device-width, initial-scale=1.0" />
        <title>如何用极坐标方程绘制曲线</title>
        <style>
            canvas
                border: 1px dashed salmon;

        </style>
    </head>
    <body>
        <canvas width="512" height="512"></canvas>
        <script type="module">
            import  parametric  from "./common/lib/parametric.js";

            const canvas = document.querySelector("canvas");
            const ctx = canvas.getContext("2d");
            const  width, height  = canvas;
            const w = 0.5 * width,
                h = 0.5 * height;
            ctx.translate(w, h);
            ctx.scale(1, -1);

            function drawAxis()
                ctx.save();
                ctx.strokeStyle = "#ccc";
                ctx.beginPath();
                ctx.moveTo(-w, 0);
                ctx.lineTo(w, 0);
                ctx.stroke();
                ctx.beginPath();
                ctx.moveTo(0, -h);
                ctx.lineTo(0, h);
                ctx.stroke();
                ctx.restore();


            drawAxis();

            // fromPolar 作为 parametric 的参数是坐标映射函数,通过它可以将任意坐标映射为直角坐标
            const fromPolar = (r, theta) =>
                return [r * Math.cos(theta), r * Math.sin(theta)];
            ;

            // 画一个半径为 200 的半圆
            const arc = parametric(
                (t) => 200,
                (t) => t,
                fromPolar
            );
            arc(0, Math.PI).draw(ctx);

            // 玫瑰线
            const rose = parametric(
                (t, a, k) => a * Math.cos(k * t),
                (t) => t,
                fromPolar
            );
            rose(0, Math.PI, 100, 200, 5).draw(ctx,  strokeStyle: "blue" );

            // 心形线
            const heart = parametric(
                (t, a) => a - a * Math.sin(t),
                (t) => t,
                fromPolar
            );
            heart(0, 2 * Math.PI, 100, 100).draw(ctx,  strokeStyle: "red" );

            // 双纽线
            const foliumRight = parametric(
                (t, a) => Math.sqrt(2 * a ** 2 * Math.cos(2 * t)),
                (t) => t,
                fromPolar
            );
            const foliumLeft = parametric(
                (t, a) => -Math.sqrt(2 * a ** 2 * Math.cos(2 * t)),
                (t) => t,
                fromPolar
            );
            foliumRight(-Math.PI / 4, Math.PI / 4, 100, 100).draw(ctx,
                strokeStyle: "green",
            );
            foliumLeft(-Math.PI / 4, Math.PI / 4, 100, 100).draw(ctx,
                strokeStyle: "green",
            );
        </script>
    </body>
</html>
如何使用片元着色器与极坐标系绘制图案?
<!DOCTYPE html>
<html lang="en">
    <head>
        <meta charset="UTF-8" />
        <meta http-equiv="X-UA-Compatible" content="IE=edge" />
        <meta name="viewport" content="width=device-width, initial-scale=1.0" />
        <title>如何使用片元着色器与极坐标系绘制图案</title>
        <style>
            canvas
                border: 1px dashed salmon;

        </style>
    </head>
    <body>
        <script src="./common/lib/gl-renderer.js"></script>
        <canvas width="512" height="512"></canvas>
        <script>
            const vertex = `
                attribute vec2 a_vertexPosition;
                attribute vec2 uv;

                varying vec2 vUv;

                void main()
                    gl_PointSize = 1.0;
                    vUv = uv;
                    gl_Position = vec4(a_vertexPosition, 1, 1);

            `;

            // // 三瓣玫瑰线
            // const fragment = `
            //     #ifdef GL_ES
            //     precision highp float;
            //     #endif

            //     varying vec2 vUv;

            //     vec2 polar(vec2 st)
            //         return vec2(length(st), atan(st.y, st.x));
            //

            //     void main()
            //         vec2 st = vUv - vec2(0.5);
            //         st = polar(st);
            //         float d = 0.5 * cos(st.y * 3.0) - st.x;
            //         gl_FragColor.rgb = smoothstep(-0.01, 0.01, d) * vec3(1.0);
            //         gl_FragColor.a = 1.0;
            //
            // `;
            // // 不同瓣数的玫瑰线图案
            // const fragment = `
            //     #ifdef GL_ES
            //     precision highp float;
            //     #endif

            //     varying vec2 vUv;
            //     uniform float u_k;

            //     vec2 polar(vec2 st)
            //         return vec2(length(st), atan(st.y, st.x));
            //

            //     void main()
            //         vec2 st = vUv - vec2(0.5);
            //         st = polar(st);
            //         float d = 0.5 * cos(st.y * u_k) - st.x;
            //         gl_FragColor.rgb = smoothstep(-0.01, 0.01, d) * vec3(1.0);
            //         gl_FragColor.a = 1.0;
            //
            // `;

            // 花瓣线
            const fragment = `
                #ifdef GL_ES
                precision highp float;
                #endif

                varying vec2 vUv;
                uniform float u_k;

                vec2 polar(vec2 st)
                    return vec2(length(st), atan(st.y, st.x));


                void main()
                    vec2 st = vUv - vec2(0.5);
                    st = polar(st);
                    float d = 0.5 * abs(cos(st.y * u_k * 0.5)) - st.x;
                    gl_FragColor.rgb = smoothstep(-0.01, 0.01, d) * vec3(1.0);
                    gl_FragColor.a = 1.0;

            `;

            // // 葫芦图案
            // const fragment = `
            //     #ifdef GL_ES
            //     precision highp float;
            //     #endif

            //     varying vec2 vUv;
            //     uniform float u_k;
            //     uniform float u_scale;
            //     uniform float u_offset;

            //     vec2 polar(vec2 st)
            //         return vec2(length(st), atan(st.y, st.x));
            //

            //     void main()
            //         vec2 st = vUv - vec2(0.5);
            //         st = polar(st);
            //         float d = u_scale * 0.5 * abs(cos(st.y * u_k * 0.5)) - st.x + u_offset;
            //         gl_FragColor.rgb = smoothstep(-0.01, 0.01, d) * vec3(1.0);
            //         gl_FragColor.a = 1.0;
            //
            // `;
            // 花苞图案
            // const fragment = `
            //     #ifdef GL_ES
            //     precision highp float;
            //     #endif

            //     varying vec2 vUv;
            //     uniform float u_k;
            //     uniform float u_scale;
            //     uniform float u_offset;

            //     vec2 polar(vec2 st)
            //         return vec2(length(st), atan(st.y, st.x));
            //

            //     void main()
            //         vec2 st = vUv - vec2(0.5);
            //         st = polar(st);
            //         float d = smoothstep(-0.3, 1.0, u_scale * 0.5 * cos(st.y * u_k) + u_offset) - st.x;
            //         gl_FragColor.rgb = smoothstep(-0.01, 0.01, d) * vec3(1.0);
            //         gl_FragColor.a = 1.0;
            //
            // `;

            const canvas = document.querySelector("canvas");
            const renderer = new GlRenderer(canvas);
            const program = renderer.compileSync(fragment, vertex);
            renderer.useProgram(program);

            // // 不同瓣数的玫瑰线图案
            // renderer.uniforms.u_k = 2;
            // setInterval(() =>
            //     renderer.uniforms.u_k += 2;
            // , 200);

            // 花瓣线
            // renderer.uniforms.u_k = 3;
            renderer.uniforms.u_k = 1.3; // 1.3 的情况下是苹果

            // // 葫芦图案
            // renderer.uniforms.u_k = 1.7;
            // renderer.uniforms.u_scale = 0.5; // default 1.0
            // renderer.uniforms.u_offset = 0.2; // default 0.0

            // // 花苞图案
            // renderer.uniforms.u_k = 5;
            // renderer.uniforms.u_scale = 0.2; // default 1.0
            // renderer.uniforms.u_offset = 0.2; // default 0.0

            renderer.setMeshData([

                    positions: [
                        [-1, -1],
                        [-1, 1],
                        [1, 1],
                        [1, -1],
                    ],
                    attributes:
                        uv: [
                            [0, 0],
                            [0, 1],
                            [1, 1],
                            [1, 0],
                        ],
                    ,
                    cells: [
                        [0, 1, 2],
                        [2, 0, 3],
                    ],
                ,
            ]);
            renderer.render();
        </script>
    </body>
</html>

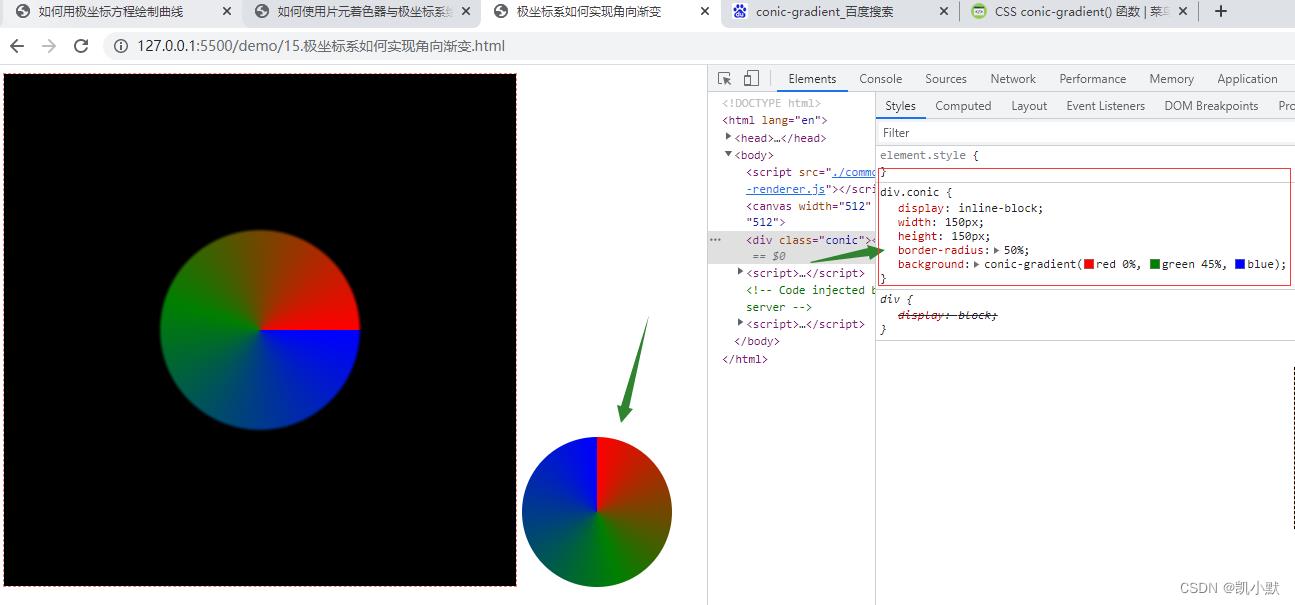
极坐标系如何实现角向渐变?
角向渐变(Conic Gradients)就是以图形中心为轴,顺时针地实现渐变效果。
<!DOCTYPE html>
<html lang="en">
<head>
    <meta charset="UTF-8">
    <meta http-equiv="X-UA-Compatible" content="IE=edge">
    <meta name="viewport" content="width=device-width, initial-scale=1.0">
    <title>极坐标系如何实现角向渐变</title>
    <style>
        canvas
            border: 1px dashed salmon;


        div.conic
            display: inline-block;
            width: 150px;
            height: 150px;
            border-radius: 50%;
            background: conic-gradient(red 0%, green 45%, blue);

    </style>
</head>
<body>
    <script src="./common/lib/gl-renderer.js"></script>
    <canvas width="512" height="512"></canvas>
    <div class="conic"></div>
    <script>
        const vertex = `
            attribute vec2 a_vertexPosition;
            attribute vec2 uv;

            varying vec2 vUv;

            void main()
                gl_PointSize = 1.0;
                vUv = uv;
                gl_Position = vec4(a_vertexPosition, 1, 1);

        `;

        const fragment = `
            #ifdef GL_ES
            precision highp float;
            #endif

            varying vec2 vUv;

            vec2 polar(vec2 st)
                return vec2(length(st), atan(st.y, st.x));


            void main()
                vec2 st = vUv - vec2(0.5);
                st = polar(st);
                float d = smoothstep(st.x, st.x + 0.01, 0.2);
                // 将角度范围转换到0到2pi之间
                if(st.y < 0.0) st.y += 6.28;
                // 计算p的值,也就是相对角度,p取值0到1
                float p = st.y / 6.28;
                if(p < 0.45)
                    // p取0到0.45时从红色线性过渡到绿色
                    gl_FragColor.rgb = d * mix(vec3(1.0, 0, 0), vec3(0, 0.5, 0), p /  0.45);
                 else
                    // p超过0.45从绿色过渡到蓝色
                    gl_FragColor.rgb = d * mix(vec3(0, 0.5, 0), vec3(0, 0, 1.0), (p - 0.45) / (1.0 - 0.45));

                gl_FragColor.a = 1.0;

        `;

        const canvas = document.querySelector("canvas");
        const renderer = new GlRenderer(canvas);
        const program = renderer.compileSync(fragment, vertex);
        renderer.useProgram(program);

        renderer.setMeshData([

                positions: [
                    [-1, -1],
                    [-1, 1],
                    [1, 1],
                    [1, -1],
                ],
                attributes:
                    uv: [
                        [0, 0],
                        [0, 1],
                        [1, 1],
                        [1, 0],
                    ],
                ,
                cells: [
                    [0, 1, 2],
                    [2, 0, 3],
                ],
            ,
        ]);
        renderer.render();
    </script>
</body>
</html>
极坐标如何绘制 HSV 色轮?
只需要将像素坐标转换为极坐标,再除以 2π,就能得到 HSV 的 H 值。然后用鼠标位置的 x、y 坐标来决定 S 和 V 的值。
<!DOCTYPE html>
<html lang="en">
<head>
<meta charset="UTF-8">
<meta http-equiv视觉基础篇11 # 图案生成:如何生成重复图案分形图案以及随机效果?
图形基础篇02 # 指令式绘图系统:如何用Canvas绘制层次关系图?