Echart--多个柱形图
Posted LWJ_jay
tags:
篇首语:本文由小常识网(cha138.com)小编为大家整理,主要介绍了Echart--多个柱形图相关的知识,希望对你有一定的参考价值。
设置数据:
效果图:
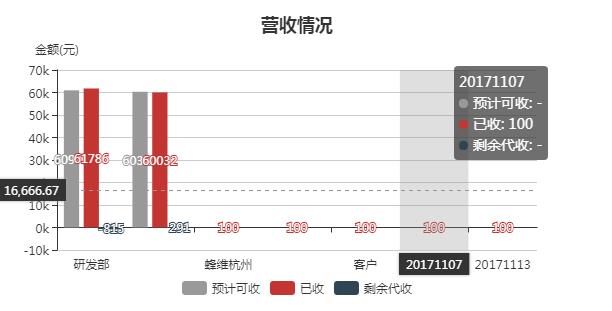
optionAll: {
          title: {
            text: \'营收情况\',
            left: \'center\'
          },
          tooltip: {
            trigger: \'axis\',
            axisPointer: {
              type: \'cross\',
              crossStyle: {
                color: \'#999\'
              }
            }
          },
          legend: {
            // bottom: 10,
            // data: [\'金额\']
            bottom: 10,
            left: \'center\',
            data: [\'预计可收\', \'已收\', \'剩余代收\']
          },
          xAxis: [
            {
              type: \'category\',
              data: [],
              axisPointer: {
                type: \'shadow\'
              }
            }
          ],
          yAxis: [
            {
              type: \'value\',
              name: \'金额(元)\',
              // min: 0,
              // max: 500,
              // interval: 100,
              axisLabel: {
                formatter: function(value) {
                  let num = value / 1000
                  return num + \'k\'
                }
              }
            }
          ],
          series: [//一组显示多条柱形图
            {
              barMaxWidth: \'30\',
              itemStyle: {normal: {color: \'#999\', label: {show: true}}},
              name: \'预计可收\',
              type: \'bar\',
              data: []//[a,a,a,a]
            }, {
              barMaxWidth: \'30\',
              itemStyle: {normal: {label: {show: true}}},
              name: \'已收\',
              type: \'bar\',
              data: []//[b,b,b,b]
            }, {
              name: \'剩余代收\',
              itemStyle: {normal: {label: {show: true}}},
              type: \'bar\',
              data: []//[c,c,c,c]
            }
          ]
        }
以上是关于Echart--多个柱形图的主要内容,如果未能解决你的问题,请参考以下文章