摘要: 本文介绍了如何把机器学习算法应用到具体问题中。 以电信运营商客户流失率问题为例,从问题的提出, 数据的分析, 算法的评估, 到最终的结果展示, ,一步步介绍机器学习基本流程。 用户数据来源于互联网。
1 定义问题
客户流失率问题是电信运营商面临得一项重要课题,也是一个较为流行的案例。根据测算,招揽新的客户比保留住既有客户的花费大得多(通常5-20倍的差距)。因此,如何保留住现在的客户对运营商而言是一项非常有意义的事情。 本文希望通过一个公开数据的客户流失率问题分析,能够带着大家理解如何应用机器学习预测算法到实际应用中。
当然, 实际的场景比本文例子复杂的多,如果想具体应用到项目, 还需要针对不同的场景和数据进行具体的分析。
从机器学习的分类来讲, 这是一个监督问题中的分类问题。 具体来说, 是一个二分类问题。 所有的数据中包括一些特征, 最后就是它的分类:流失或者在网。接下来我们就开始具体的处理。
2 分析数据
首先我们来导入数据, 然后查看数据的基本情况。
2.1 数据导入
通过pandas来导入csv, 然后我们来查看一下数据的基本情况
from __future__ import division
import pandas as pd
import numpy as np

ds = pd.read_csv(‘./churn.csv‘)
col_names = ds.columns.tolist()
print "Column names:"
print col_names
print(ds.shape)
输出:
Column names:
[‘State‘, ‘Account Length‘, ‘Area Code‘, ‘Phone‘, "Int‘l Plan", ‘VMail Plan‘, ‘VMail Message‘, ‘Day Mins‘, ‘Day Calls‘, ‘Day Charge‘, ‘Eve Mins‘, ‘Eve Calls‘, ‘Eve Charge‘, ‘Night Mins‘, ‘Night Calls‘, ‘Night Charge‘, ‘Intl Mins‘, ‘Intl Calls‘, ‘Intl Charge‘, ‘CustServ Calls‘, ‘Churn?‘]
(3333, 21)
可以看到, 整个数据集有3333条数据, 20个维度, 最后一项是分类。
2.2 基本信息以及类型
我们可以打印一些数据, 对数据和取值有一个基本的理解。
peek = data.head(5)
print(peek)
输出:
   State  Account Length  Area Code     Phone Int‘l Plan VMail Plan  0     KS             128        415  382-4657         no        yes
1     OH             107        415  371-7191         no        yes
2     NJ             137        415  358-1921         no         no
3     OH              84        408  375-9999        yes         no
4     OK              75        415  330-6626        yes         no
    Eve Charge  Night Mins  Night Calls  Night Charge  Intl Mins  Intl Calls  0        16.78       244.7           91         11.01       10.0           3
1        16.62       254.4          103         11.45       13.7           3
2        10.30       162.6          104          7.32       12.2           5
3         5.26       196.9           89          8.86        6.6           7
4        12.61       186.9          121          8.41       10.1           3
    Intl Charge  CustServ Calls  Churn?
0          2.70               1  False.
1          3.70               1  False.
2          3.29               0  False.
3          1.78               2  False.
4          2.73               3  False.
我们可以看到, 数据集有20项特征,分别是州名, 账户长度, 区号, 电话号码, 国际计划,语音邮箱, 白天通话分钟数, 白天电话个数, 白天收费, 晚间通话分钟数,晚间电话个数, 晚间收费, 夜间通话分钟数,夜间电话个数, 夜间收费, 国际分钟数, 国际电话个数, 国际收费, 客服电话数,流失与否.
- 可以看到这里面有个人信息,应该可以看到有些信息与流失与否关系不大。 州名, 区号可以指明客户的位置, 和流失有关系么, 不知道, 具体位置如果不分类, 应该完全没有关系。 而州名, 也许某个州有了某个强劲的竞争对手? 这也是瞎猜, 暂时意义不大, 删除。
- 账号长度, 电话号码, 不需要
- 国际计划, 语音邮箱。 可能有关系, 先留着吧。
- 分别统计了白天, 晚间, 夜间的通话分钟, 电话个数, 收费情况。 这是重要信息保留
- 客服电话, 客户打电话投诉多那流失率可能会大。 这个是重要信息保留。
- 流失与否。 这是分类结果。
然后我们可以看一下数据的类型, 如下:
ds.info()输出:
RangeIndex: 3333 entries, 0 to 3332
Data columns (total 21 columns):
State             3333 non-null object
Account Length    3333 non-null int64
Area Code         3333 non-null int64
Phone             3333 non-null object
Int‘l Plan        3333 non-null object
VMail Plan        3333 non-null object
VMail Message     3333 non-null int64
Day Mins          3333 non-null float64
Day Calls         3333 non-null int64
Day Charge        3333 non-null float64
Eve Mins          3333 non-null float64
Eve Calls         3333 non-null int64
Eve Charge        3333 non-null float64
Night Mins        3333 non-null float64
Night Calls       3333 non-null int64
Night Charge      3333 non-null float64
Intl Mins         3333 non-null float64
Intl Calls        3333 non-null int64
Intl Charge       3333 non-null float64
CustServ Calls    3333 non-null int64
Churn?            3333 non-null object
dtypes: float64(8), int64(8), object(5)
memory usage: 546.9+ KB
看见, 有int, float, object。 对于不是数据型的数据, 后面除非决策树等算法, 否则应该会转化成数据行。
所以我们把churn? 结果转化, 以及"Int‘l Plan","VMail Plan", 这两个参数只有yes, no 两种, 所以也进行转化成01值。
2.3 描述性统计
describe() 可以返回具体的结果, 对于每一列。
数量
平均值
标准差
25% 分位
50% 分位数
75% 分位数
最大值 很多时候你可以得到NA的数量和比例。
       Account Length    Area Code  VMail Message     Day Mins    Day Calls  count     3333.000000  3333.000000    3333.000000  3333.000000  3333.000000
mean       101.064806   437.182418       8.099010   179.775098   100.435644
std         39.822106    42.371290      13.688365    54.467389    20.069084
min          1.000000   408.000000       0.000000     0.000000     0.000000
25%         74.000000   408.000000       0.000000   143.700000    87.000000
50%        101.000000   415.000000       0.000000   179.400000   101.000000
75%        127.000000   510.000000      20.000000   216.400000   114.000000
max        243.000000   510.000000      51.000000   350.800000   165.000000

        Day Charge     Eve Mins    Eve Calls   Eve Charge   Night Mins  count  3333.000000  3333.000000  3333.000000  3333.000000  3333.000000
mean     30.562307   200.980348   100.114311    17.083540   200.872037
std       9.259435    50.713844    19.922625     4.310668    50.573847
min       0.000000     0.000000     0.000000     0.000000    23.200000
25%      24.430000   166.600000    87.000000    14.160000   167.000000
50%      30.500000   201.400000   100.000000    17.120000   201.200000
75%      36.790000   235.300000   114.000000    20.000000   235.300000
max      59.640000   363.700000   170.000000    30.910000   395.000000

       Night Calls  Night Charge    Intl Mins   Intl Calls  Intl Charge  count  3333.000000   3333.000000  3333.000000  3333.000000  3333.000000
mean    100.107711      9.039325    10.237294     4.479448     2.764581
std      19.568609      2.275873     2.791840     2.461214     0.753773
min      33.000000      1.040000     0.000000     0.000000     0.000000
25%      87.000000      7.520000     8.500000     3.000000     2.300000
50%     100.000000      9.050000    10.300000     4.000000     2.780000
75%     113.000000     10.590000    12.100000     6.000000     3.270000
max     175.000000     17.770000    20.000000    20.000000     5.400000

       CustServ Calls
count     3333.000000
mean         1.562856
std          1.315491
min          0.000000
25%          1.000000
50%          1.000000
75%          2.000000
max          9.000000
2.4 图形化理解你的数据
之前的一些信息, 只是一些很初步的理解, 但是对于机器学习算法来讲是不够的。 下面我们从几个维度去进一步理解你的数据。工具可以用数字表格, 也可以用图形(matplotlib) 这里画图较多。
- 特征自己的信息
- 特征和分类之间的关系
- 特征和特征之间的关系
-- 这里鉴于时间的关系, 有些关系并没有直接应用于算法本身, 但是在进一步的算法提升中是很有意义的, 这里更多的是一种展示。
2.4.1 特征本身的信息
我们先来看一下流失比例, 以及关于打客户电话的个数分布
import matplotlib.pyplot as plt
%matplotlib inline
fig = plt.figure()
fig.set(alpha=0.2)  # 设定图表颜色alpha参数

plt.subplot2grid((2,3),(0,0))             # 在一张大图里分列几个小图
ds[‘Churn?‘].value_counts().plot(kind=‘bar‘)# plots a bar graph of those who surived vs those who did not.
plt.title(u"stat for churn") # puts a title on our graph
plt.ylabel(u"number")

plt.subplot2grid((2,3),(0,2))
ds[‘CustServ Calls‘].value_counts().plot(kind=‘bar‘)# plots a bar graph of those who surived vs those who did not.
plt.title(u"stat for cusServCalls") # puts a title on our graph
plt.ylabel(u"number")

plt.show()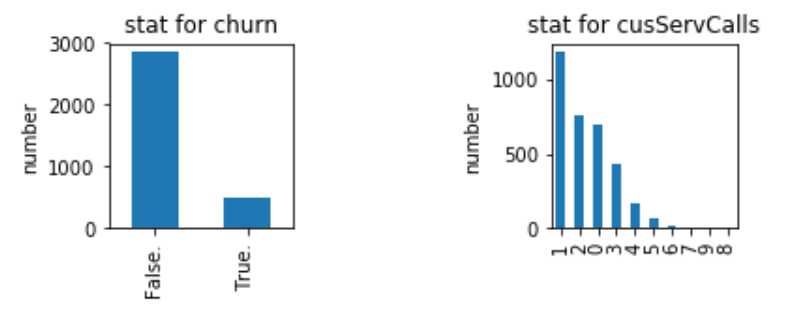
很容易理解。
然后呢, 我们的数据的特点是对白天, 晚上, 夜间,国际都有分钟数, 电话数, 收费三种维度。 那么我们拿白天的来举例。
import matplotlib.pyplot as plt
%matplotlib inline
fig = plt.figure()
fig.set(alpha=0.2)  # 设定图表颜色alpha参数

plt.subplot2grid((2,5),(0,0))             # 在一张大图里分列几个小图
ds[‘Day Mins‘].plot(kind=‘kde‘)    # plots a kernel desnsity estimate of customer
plt.xlabel(u"Mins")# plots an axis lable
plt.ylabel(u"density")
plt.title(u"dis for day mins")

plt.subplot2grid((2,5),(0,2))
ds[‘Day Calls‘].plot(kind=‘kde‘)    # plots a kernel desnsity estimate of customer
plt.xlabel(u"call")# plots an axis lable
plt.ylabel(u"density")
plt.title(u"dis for day calls")

plt.subplot2grid((2,5),(0,4))
ds[‘Day Charge‘].plot(kind=‘kde‘)   # plots a kernel desnsity estimate of customer
plt.xlabel(u"Charge")# plots an axis lable
plt.ylabel(u"density")
plt.title(u"dis for day charge")

plt.show()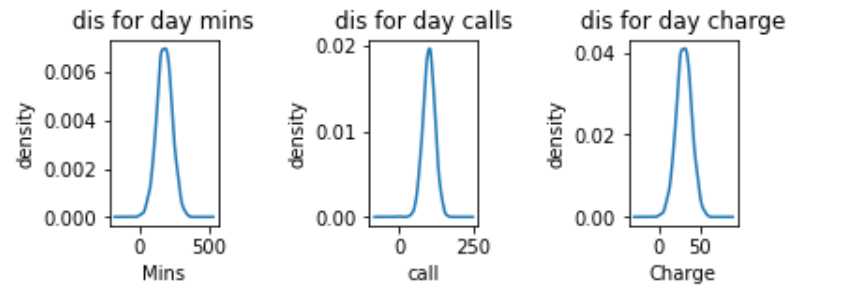
可以看到分布基本上都是高斯分布, 这也符合我们的预期, 而高斯分布对于我们后续的一些算法处理是个好消息。
2.4.2 特征和分类的关联
我们来看一下一些特征和分类之间的关联。 比如下面int plan
import matplotlib.pyplot as plt
fig = plt.figure()
fig.set(alpha=0.2)  # 设定图表颜色alpha参数

int_yes = ds[‘Churn?‘][ds[‘Int\\‘l Plan‘] == ‘yes‘].value_counts()
int_no = ds[‘Churn?‘][ds[‘Int\\‘l Plan‘] == ‘no‘].value_counts()
df_int=pd.DataFrame({u‘int plan‘:int_yes, u‘no int plan‘:int_no})
df_int.plot(kind=‘bar‘, stacked=True)
plt.title(u"statistic between int plan and churn")
plt.xlabel(u"int or not")
plt.ylabel(u"number")

plt.show()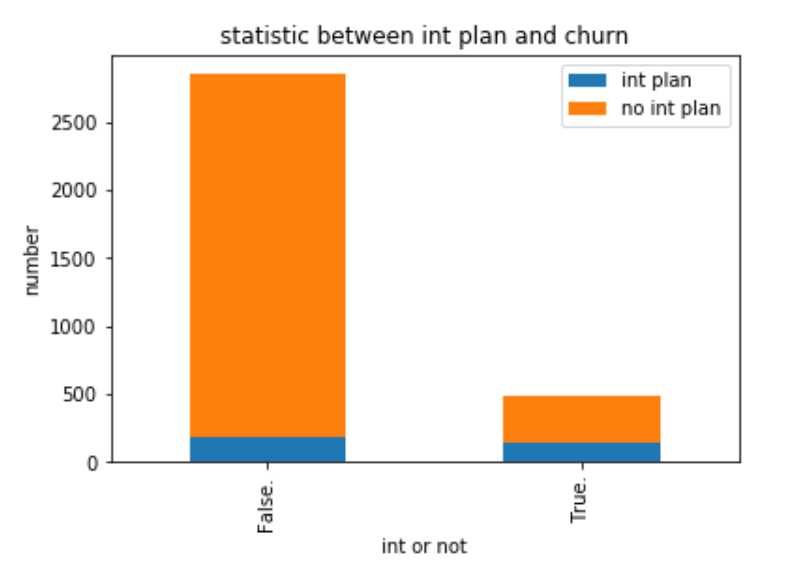
我们可以看到, 有国际电话的流失率较高。 猜测也许他们有更多的选择, 或者对服务有更多的要求。 需要特别对待。 也许你需要电话多收集一下意见了。
再来看一下
#查看客户服务电话和结果的关联
fig = plt.figure()
fig.set(alpha=0.2)  # 设定图表颜色alpha参数

cus_0 = ds[‘CustServ Calls‘][ds[‘Churn?‘] == ‘False.‘].value_counts()
cus_1 = ds[‘CustServ Calls‘][ds[‘Churn?‘] == ‘True.‘].value_counts()
df=pd.DataFrame({u‘churn‘:cus_1, u‘retain‘:cus_0})
df.plot(kind=‘bar‘, stacked=True)
plt.title(u"Static between customer service call and churn")
plt.xlabel(u"Call service")
plt.ylabel(u"Num")

plt.show()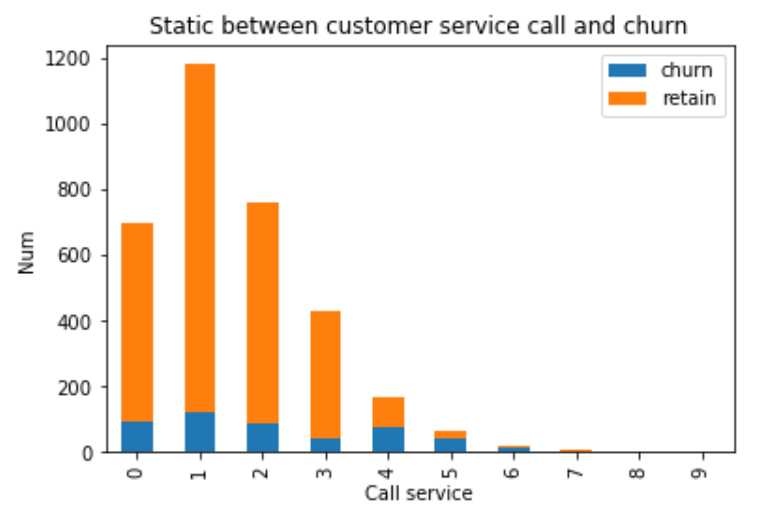
基本上可以看出, 打客户电话的多少和最终的分类是强相关的, 打电话3次以上的流失率比例急速升高。 这是一个非常关键的指标。
3 准备数据
好的, 我们已经看了很多,对数据有了一定的理解。 下面我们开始具体对数据进行操作。
3.1 去除无关列
首先, 根据对问题的分析, 我们做第一件事情, 去除三列无关列。 州名, 电话, 区号。
- 我们和下一步一起做
3.2 转化成数值类型
对于有些特征, 本身不是数值类型的, 这些数据是不能被算法直接使用的, 所以我们来处理一下
# Isolate target data
ds_result = ds[‘Churn?‘]
Y = np.where(ds_result == ‘True.‘,1,0)

dummies_int = pd.get_dummies(ds[‘Int\\‘l Plan‘], prefix=‘_int\\‘l Plan‘)
dummies_voice = pd.get_dummies(ds[‘VMail Plan‘], prefix=‘VMail‘)

ds_tmp=pd.concat([ds, dummies_int, dummies_voice], axis=1)

# We don‘t need these columns
to_drop = [‘State‘,‘Area Code‘,‘Phone‘,‘Churn?‘, ‘Int\\‘l Plan‘, ‘VMail Plan‘]
df = ds_tmp.drop(to_drop,axis=1)

print "after convert "
print df.head(5)
输出:
after convert 01
   Account Length  VMail Message  Day Mins  Day Calls  Day Charge  Eve Mins  0             128             25     265.1        110       45.07     197.4
1             107             26     161.6        123       27.47     195.5
2             137              0     243.4        114       41.38     121.2
3              84              0     299.4         71       50.90      61.9
4              75              0     166.7        113       28.34     148.3

   Eve Calls  Eve Charge  Night Mins  Night Calls  Night Charge  Intl Mins  0         99       16.78       244.7           91         11.01       10.0
1        103       16.62       254.4          103         11.45       13.7
2        110       10.30       162.6          104          7.32       12.2
3         88        5.26       196.9           89          8.86        6.6
4        122       12.61       186.9          121          8.41       10.1

   Intl Calls  Intl Charge  CustServ Calls  _int‘l Plan_no  _int‘l Plan_yes  0           3         2.70               1               1                0
1           3         3.70               1               1                0
2           5         3.29               0               1                0
3           7         1.78               2               0                1
4           3         2.73               3               0                1

   VMail_no  VMail_yes
0         0          1
1         0          1
2         1          0
3         1          0
4         1          0
我们可以看到结果, 所有的数据都是数值型的, 而且除去了对我们没有意义的列。
3.3 scale 数据范围
我们需要做一些scale的工作。 就是有些属性的scale 太大了。
- 对于逻辑回归和梯度下降来说, 个属性的scale 差距太大, 会对收敛速度有很大的影响。
- 我们这里对所有的都做, 其实可以对一些突出的特征做这种处理。
#scale
X = df.as_matrix().astype(np.float)

# This is important
from sklearn.preprocessing import StandardScaler
scaler = StandardScaler()
X = scaler.fit_transform(X)

print "Feature space holds %d observations and %d features" % X.shape
print "Unique target labels:", np.unique(y)
输出:
Feature space holds 3333 observations and 19 features
Unique target labels: [0 1]
其他的呢, 还可以考虑降维等各种方式。 但是再实际使用中, 我们往往首先做出一个模型, 得到一个参考结果, 然后逐步优化。 所以我们准备数据就到这里。
4 评估算法
我们会使用多个算法来计算结果, 然后选择较好的。 如下
# prepare models
models = []
models.append((‘LR‘, LogisticRegression()))
models.append((‘LDA‘, LinearDiscriminantAnalysis()))
models.append((‘KNN‘, KNeighborsClassifier()))
models.append((‘CART‘, DecisionTreeClassifier()))
models.append((‘NB‘, GaussianNB()))
models.append((‘SVM‘, SVC()))
# evaluate each model in turn
results = []
names = []
scoring = ‘accuracy‘
for name, model in models:
    kfold = KFold(n_splits=10, random_state=7)
    cv_results = cross_val_score(model, X, Y, cv=kfold, scoring=scoring)
    results.append(cv_results)
    names.append(name)
    msg = "%s: %f (%f)" % (name, cv_results.mean(), cv_results.std())
    print(msg)
# boxplot algorithm comparison
fig = pyplot.figure()
fig.suptitle(‘Algorithm Comparison‘)
ax = fig.add_subplot(111)
pyplot.boxplot(results)
ax.set_xticklabels(names)
pyplot.show()
LR: 0.860769 (0.021660)
LDA: 0.852972 (0.021163)
KNN: 0.896184 (0.016646)
CART: 0.920491 (0.012471)
NB: 0.857179 (0.015487)
SVM: 0.921091 (0.016828)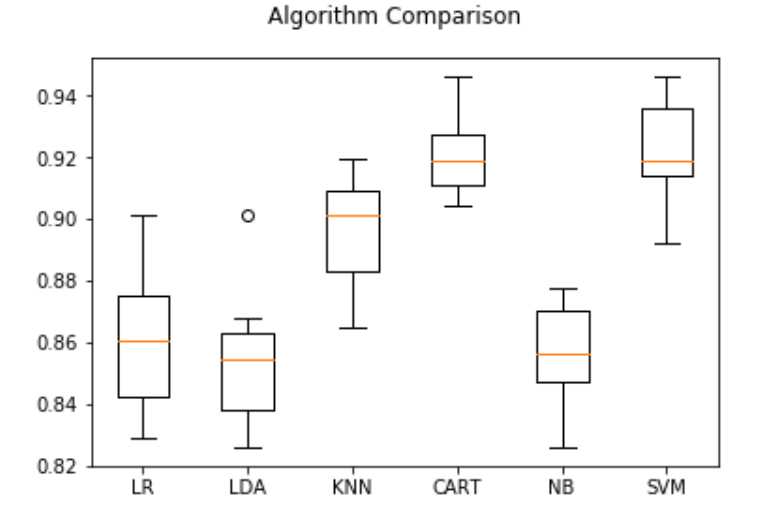
可以看到什么呢, 看到SVM 和 CART 效果相对较好。
5 提升结果
提升的部分, 如何使用提升算法。
比如随机森林。 xgboost
from sklearn.ensemble import RandomForestClassifier
num_trees = 100
max_features = 3
kfold = KFold(n_splits=10, random_state=7)
model = RandomForestClassifier(n_estimators=num_trees, max_features=max_features)
results = cross_val_score(model, X, Y, cv=kfold)
print(results.mean())
# 0.954696013379
from sklearn.ensemble import GradientBoostingClassifier
seed = 7
num_trees = 100
kfold = KFold(n_splits=10, random_state=seed)
model = GradientBoostingClassifier(n_estimators=num_trees, random_state=seed)
results = cross_val_score(model, X, Y, cv=kfold)
print(results.mean())
# 0.953197209185可以看到, 这两种算法对单个算法的提升还是很明显的。 进一步的, 也可以继续调整tree的数目, 但是效果应该差不多了。
6 展示结果
这里展示了如何保存这个算法, 以及如何取出然后应用。
#store
from sklearn.model_selection import train_test_split
from pickle import dump
from pickle import load

X_train, X_test, Y_train, Y_test = train_test_split(X, Y, test_size=0.33, random_state=7)
from sklearn.ensemble import GradientBoostingClassifier
seed = 7
num_trees = 100
kfold = KFold(n_splits=10, random_state=seed)
model = GradientBoostingClassifier(n_estimators=num_trees, random_state=seed)
model.fit(X_train, Y_train)
# save the model to disk
filename = ‘finalized_model.sav‘
dump(model, open(filename, ‘wb‘))
# some time later...
# load the model from disk
loaded_model = load(open(filename, ‘rb‘))
result = loaded_model.score(X_test, Y_test)
print(result)
7 后记
本文展示了通过用户流失率问题, 如何把机器学习的预测过程应用到实际项目中。
- 从业务的角度, 这个只是一个demo性质的应用, 实际场景可能复杂的多。
- 从流程的角度, 通过对数据的分析可以进一步提升算法的性能, 对于某些的特征, 可以采取不同的处理方式。 比如缺失值的处理, 这里很完整, 就省去了这个步骤。
- 对于一些步骤, 这里解释并不是很详细, 读者可以参考博客的 掌握python机器学习 系列
参考文章
1 http://blog.yhat.com/posts/predicting-customer-churn-with-sklearn.html
2 http://blog.csdn.net/han_xiaoyang/article/details/49797143 寒小阳的博客。