线性回归模型(Linear Regression)及Python实现
Posted
tags:
篇首语:本文由小常识网(cha138.com)小编为大家整理,主要介绍了线性回归模型(Linear Regression)及Python实现相关的知识,希望对你有一定的参考价值。
线性回归模型(Linear Regression)及Python实现
1.模型
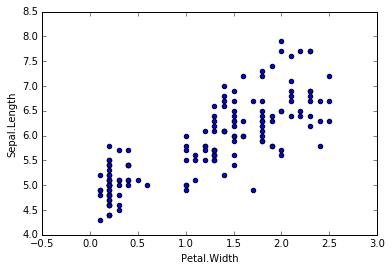
对于一份数据,它有两个变量,分别是Petal.Width和Sepal.Length,画出它们的散点图。我们希望可以构建一个函数去预测Sepal.Length,当我们输入Petal.Width时,可以返回一个预测的Sepal.Length。从散点图可以发现,可以用一条直线去拟合,这时我们可以构建一元线性回归模型:hθ(x) = θ0 + θ1x1 (x1= Petal.Width)。当然,如果我们的特征X不止一个的话,我们可以构造多元线性回归模型,hθ(x) = ∑θixi (i = 0,...,n , x0 = 1)。

2.评价
对于上述的线性回归模型hθ(x),我们需要求出θ来。可以想象,参数θ的取值有无数多种,那么我们应该怎么样选取合适的参数θ? 直观的去理解,我们希望估计出来的hθ(x)与实际的Y值尽量的靠近,因此我们可以定义一个损失函数J(θ) = ½∑(hθ(x(i)) − y(i))2。当然,损失函数可以有很多种定义方法,这种损失函数是最为经典的,由此得到的线性回归模型称为普通最小二乘回归模型(OLS)。
3.优化
我们已经定义好了损失函数J(θ),接下来的任务就是求出参数θ。我们的目标很明确,就是找到一组θ,使得我们的损失函数J(θ)最小。最常用的求解方法有两种:批量梯度下降法(batch gradient descent), 正规方程方法(normal equations)。 前者是一种通过迭代求得的数值解,后者是一种通过的公式一步到位求得的解析解。在特征个数不太多的情况下,后者的速度较快,一旦特征的个数成千上万的时候,前者的速度较快。另外,先对特征标准化可以加快求解速度。
批量梯度下降法:θj := θj − α· ∂J(θ)/∂θj (j = 0,1,...,n, α为学习速率, J(θ)/∂θj 为J的偏导数) 不断同时更新θj直到收敛
正规方程法:θ = (XTX)−1XTY
4.python代码实现
 1 # -*- coding: utf-8 -*-
 2 """
 3 Created on Tue Feb 23 16:06:54 2016
 4
 5 @author: SumaiWong
 6 """
 7
 8 import numpy as np
 9 import pandas as pd
10 from numpy.linalg import inv
11 from numpy import dot
12
13 iris = pd.read_csv(‘iris.csv‘)
14 # 拟合线性模型: Sepal.Length ~ Sepal.Width + Petal.Length + Petal.Width
15
16 # 正规方程法
17 temp = iris.iloc[:, 1:4]
18 temp[‘x0‘] = 1
19 X = temp.iloc[:,[3,0,1,2]]
20 Y = iris.iloc[:, 0]
21 Y = Y.reshape(len(iris), 1)
22 theta_n = dot(dot(inv(dot(X.T, X)), X.T), Y) # theta = (X‘X)^(-1)X‘Y
23 print theta_n
24
25 #批量梯度下降法
26 theta_g = np.array([1., 1., 1., 1.]) #初始化theta
27 theta_g = theta_g.reshape(4, 1)
28 alpha = 0.1
29 temp = theta_g
30 X0 = X.iloc[:, 0].reshape(150, 1)
31 X1 = X.iloc[:, 1].reshape(150, 1)
32 X2 = X.iloc[:, 2].reshape(150, 1)
33 X3 = X.iloc[:, 3].reshape(150, 1)
34 J = pd.Series(np.arange(800, dtype = float))
35 for i in range(800):
36 # theta j := theta j + alpha*(yi - h(xi))*xi
37     temp[0] = theta_g[0] + alpha*np.sum((Y- dot(X, theta_g))*X0)/150.
38     temp[1] = theta_g[1] + alpha*np.sum((Y- dot(X, theta_g))*X1)/150.
39     temp[2] = theta_g[2] + alpha*np.sum((Y- dot(X, theta_g))*X2)/150.
40     temp[3] = theta_g[3] + alpha*np.sum((Y- dot(X, theta_g))*X3)/150.
41     J[i] = 0.5*np.sum((Y - dot(X, theta_g))**2) #计算损失函数值
42     theta_g = temp #更新theta
43
44 print theta_g
45 print J.plot(ylim = [0, 50])
代码所用的数据下载地址:http://files.cnblogs.com/files/sumai/iris.rar
以上是关于线性回归模型(Linear Regression)及Python实现的主要内容,如果未能解决你的问题,请参考以下文章
R语言广义线性模型函数GLM广义线性模型(Generalized linear models)glm函数构建逻辑回归模型(Logistic regression)
机器学习---线性回归(Machine Learning Linear Regression)
R语言plotly可视化:使用plotly可视化简单线性回归模型的回归线(simple regression model linear regression plots)