python使用matplotlib绘制多个子图时出现标题轴标签等文字重叠的解决
Posted first_code
tags:
篇首语:本文由小常识网(cha138.com)小编为大家整理,主要介绍了python使用matplotlib绘制多个子图时出现标题轴标签等文字重叠的解决相关的知识,希望对你有一定的参考价值。
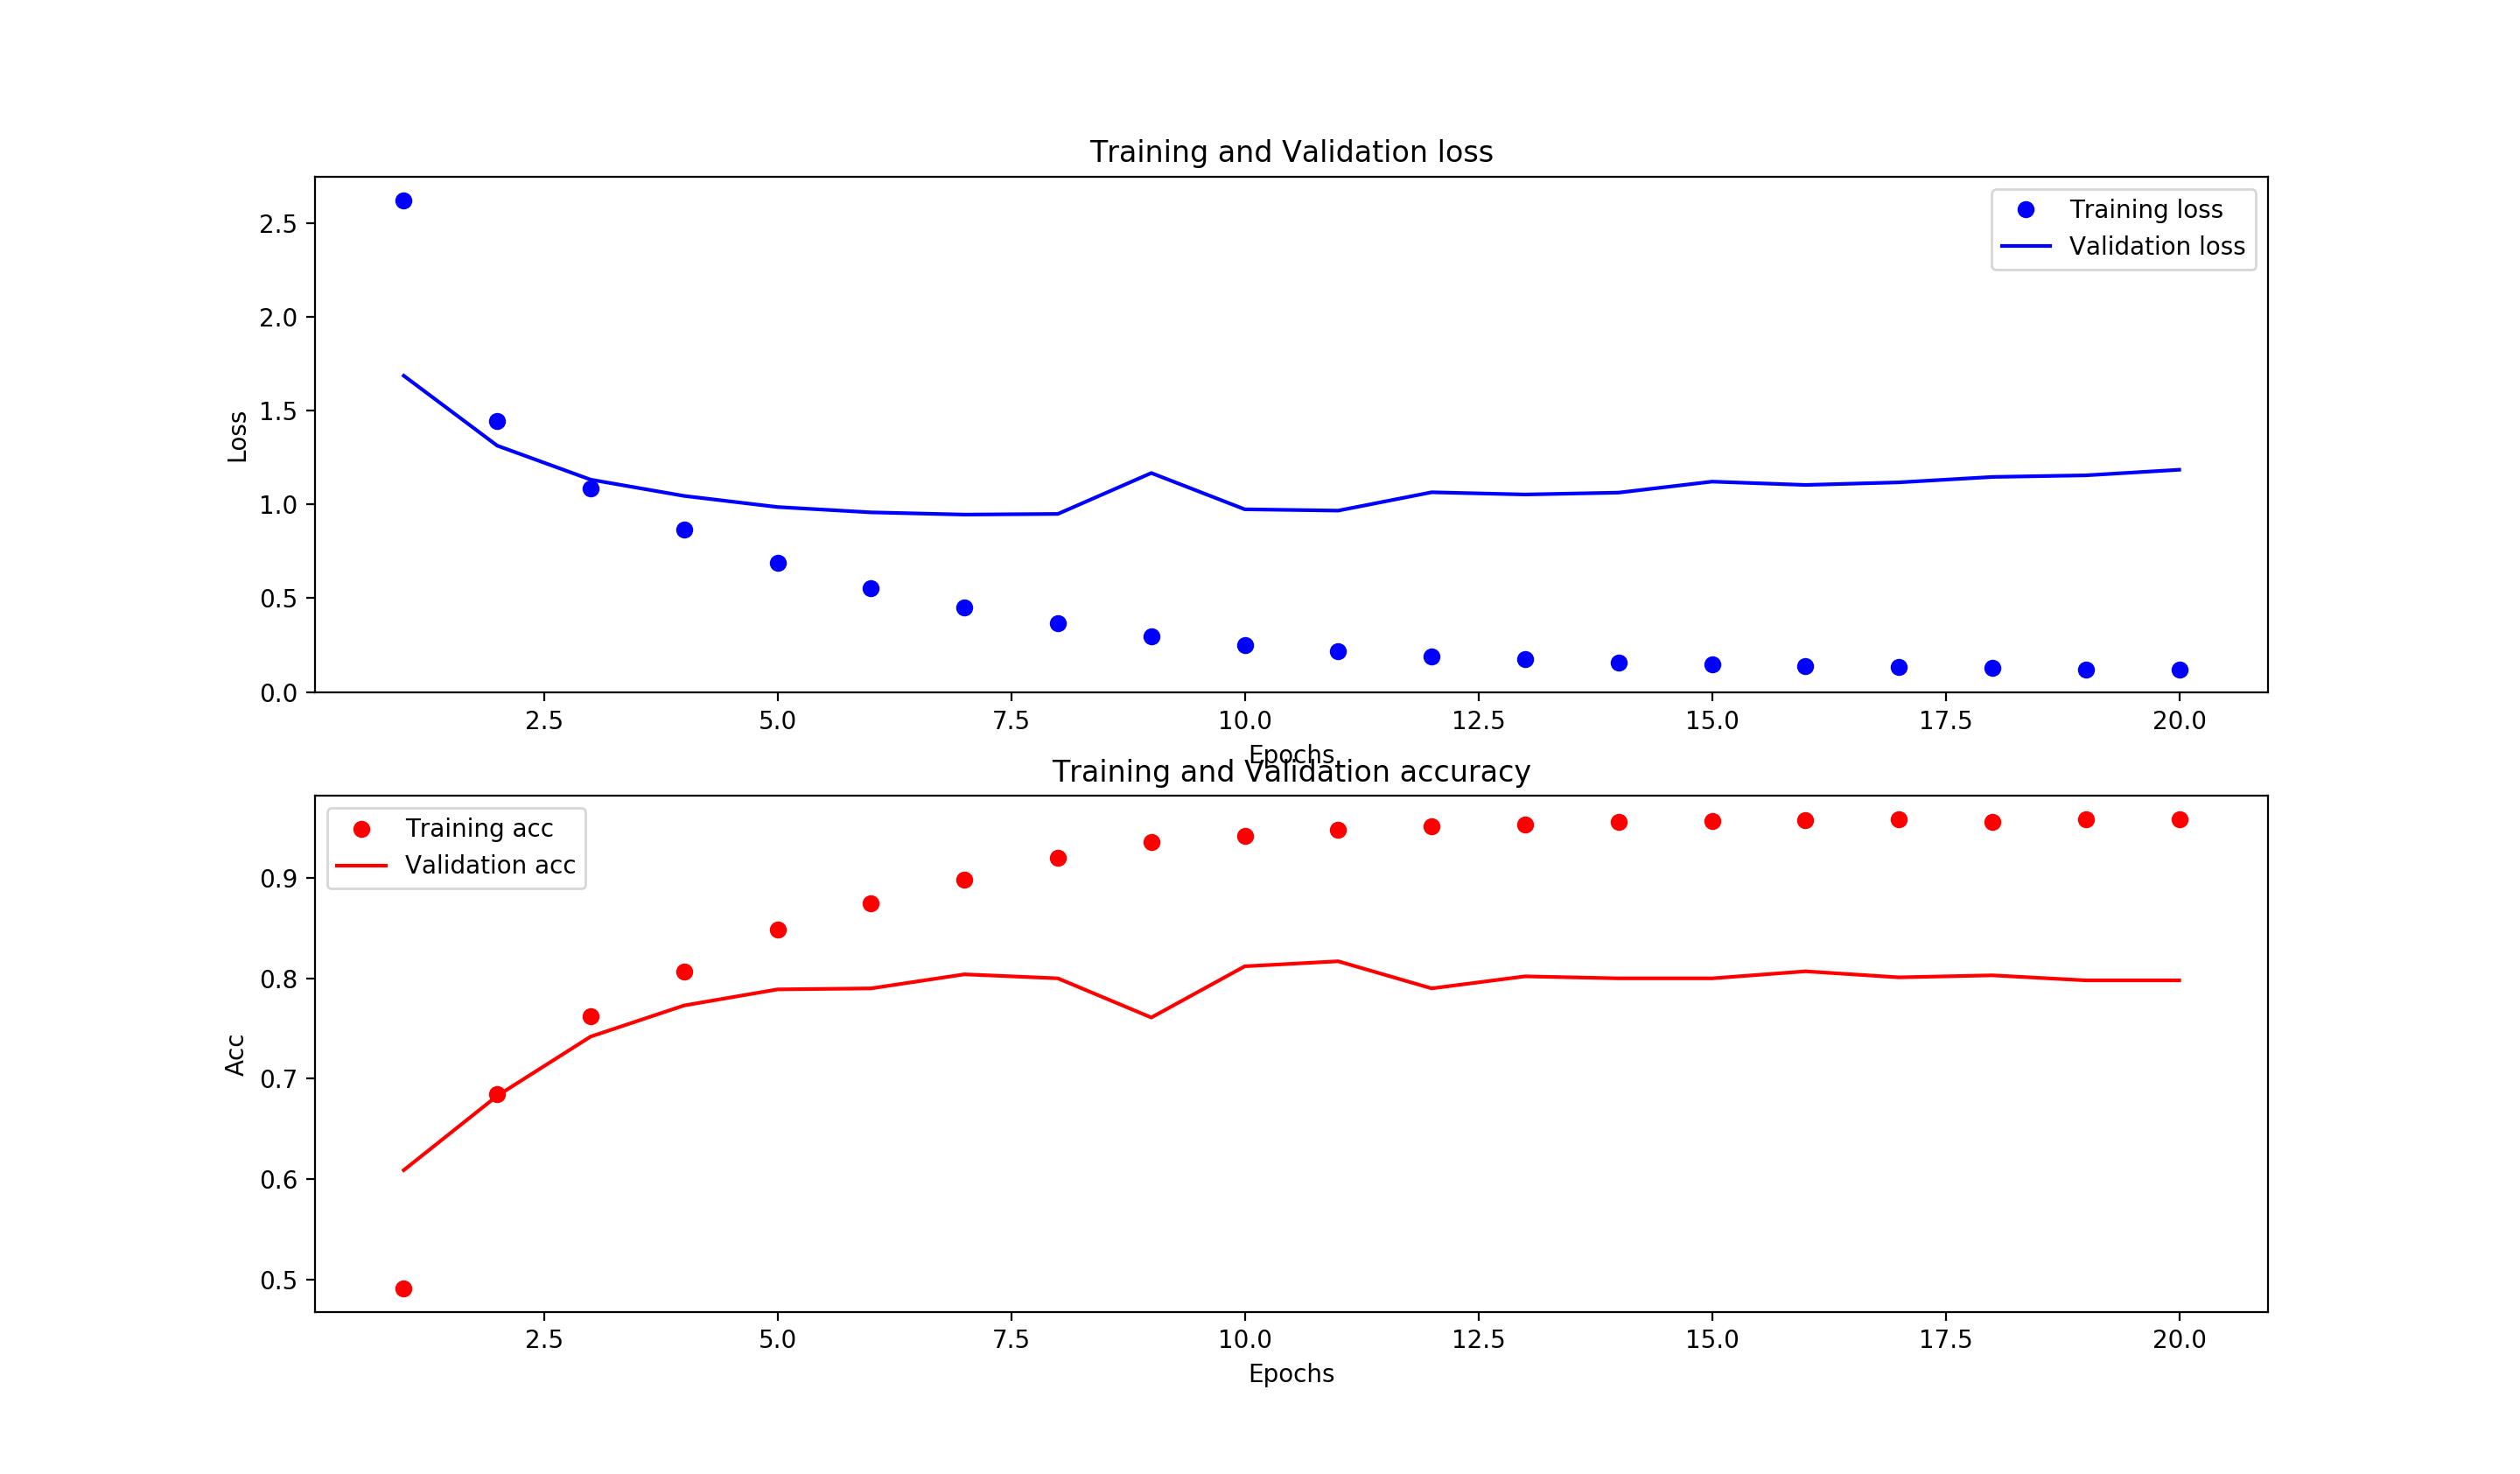
当前代码绘制的图片会出现下图中文字重叠的情况:
plt.subplot(211)
plt.plot(epochs,loss,\'bo\',label=\'Training loss\')
plt.plot(epochs,val_loss,\'b\',label=\'Validation loss\')
plt.title(\'Training and Validation loss\')
plt.xlabel(\'Epochs\')
plt.ylabel(\'Loss\')
plt.legend()

plt.subplot(212)
plt.plot(epochs,acc,\'ro\',label=\'Training acc\')
plt.plot(epochs,val_acc,\'r\',label=\'Validation acc\')
plt.title(\'Training and Validation accuracy\')
plt.xlabel(\'Epochs\')
plt.ylabel(\'Acc\')
plt.legend()

plt.show()

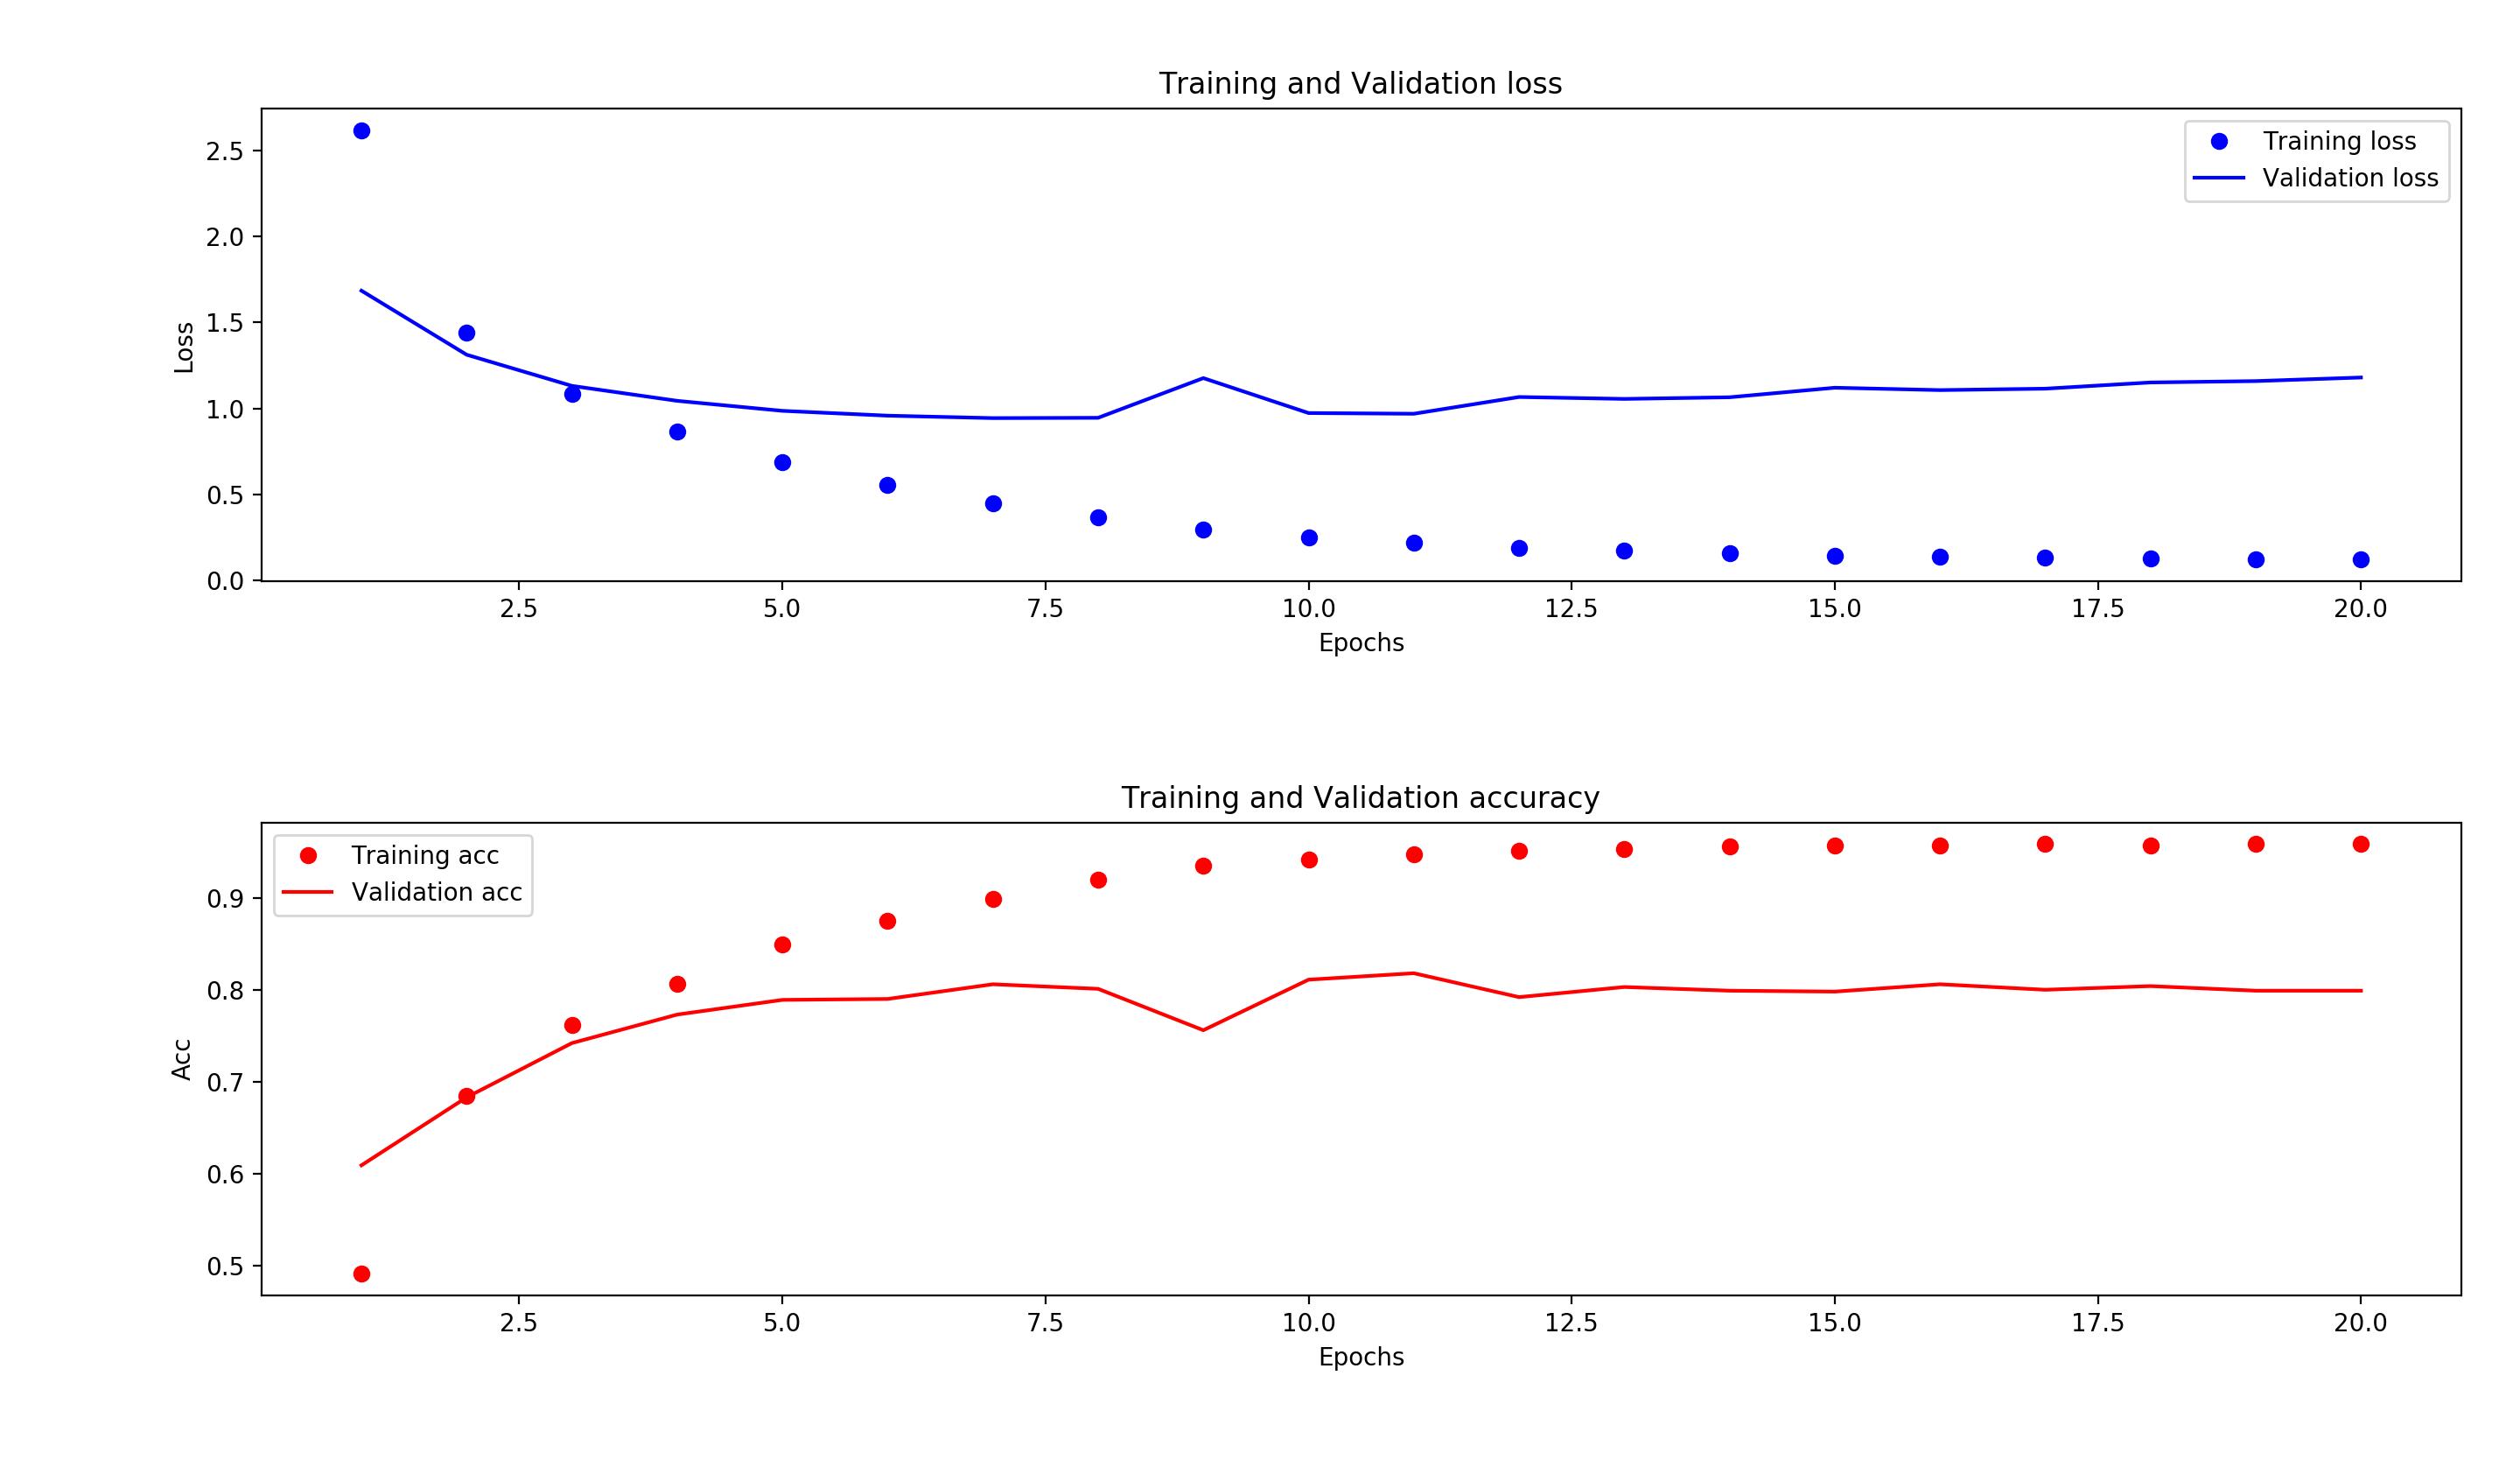
可通过tight_layout()方法解决,可根据自己喜好自动移参数:
plt.subplot(211)
plt.plot(epochs,loss,\'bo\',label=\'Training loss\')
plt.plot(epochs,val_loss,\'b\',label=\'Validation loss\')
plt.title(\'Training and Validation loss\')
plt.xlabel(\'Epochs\')
plt.ylabel(\'Loss\')
plt.tight_layout()
plt.legend()

plt.subplot(212)
plt.plot(epochs,acc,\'ro\',label=\'Training acc\')
plt.plot(epochs,val_acc,\'r\',label=\'Validation acc\')
plt.title(\'Training and Validation accuracy\')
plt.xlabel(\'Epochs\')
plt.ylabel(\'Acc\')
plt.tight_layout()
plt.legend()

plt.show()

以上是关于python使用matplotlib绘制多个子图时出现标题轴标签等文字重叠的解决的主要内容,如果未能解决你的问题,请参考以下文章
python使用matplotlib可视化subplots子图subplots绘制子图并为可视化的多个子图设置共享的X轴
python使用matplotlib可视化subplots子图subplots绘制子图并为可视化的多个子图设置共享的Y轴