Graphviz 绘制流程图
Posted
tags:
篇首语:本文由小常识网(cha138.com)小编为大家整理,主要介绍了Graphviz 绘制流程图相关的知识,希望对你有一定的参考价值。
凝视说明非常具体。不再详述。
digraph G{

	//dot 是一种画图语言,它能够方便你採用图形的方式高速、直观地表达一些想法,
	//比方描写叙述某个问题的解决方式,构思一个程序的流程,澄清一堆貌似散乱无章的事物之间的联系……等等。
	//总之,当你打算使用铅笔在纸上乱画一些圈圈框框并用一些带箭头的线将它们联系起来的时候。
	//最好还是考虑一下使用 dot 来完毕这个工作。

	//digraph 是 dot 用于定义有向图的命令,在这里它定义了一幅名为 G 的有向图,
	//花括号里所包括的内容即为该有向图的内容,也就是结点和边。
	//'->' 符号表示有向边,从一个结点指向还有一个结点。

	//graph是 dot 用于定义无向图的命令。
	//'--'符号表示无向边。

	//1.定义一个图,并向图中加入须要的顶点和边
	//2.为顶点和边加入样式
	//3.使用布局引擎进行绘制


	//【1】图的属性
	//默认的顶点中的文字为顶点变量的名称,形状为椭圆; 边的默认样式为黑色实线箭头。
	label    = "图的属性设置演示样例";		//标签
	fontsize = 10;					//字体大小
	fontname = "Microsoft YaHei";	//字体名称

	//默认结点属性
	node [shape = Mrecord, style = filled, fillcolor = ".7 .3 1.0", color = green, fontsize = 10];

	//默认边属性
	edge [arrowsize = .5];  //箭头为原来的0.5


	//【1】 声明结点ID
	a[shape = component, color = green];  //形状为component 边框颜色为green
	b[shape = polygon, sides = 5, peripheries = 3];   //多边形 有五条边 3条边框
	c[shape = polygon, sides = 4, skew = 0.4, label="CC"];  //多边形 有四条边 倾斜角度为0.4 标签文本为CC
	d;
	e;
	f[shape = circle, color = red, style = solid]; //圆形 边框颜色为red

	//【2】 构造连接关系。採用 '->'  ,后面的[]中用于定义边的属性
	a->b[color="red"]; //边为red色
	a->c[style = dashed];  //边为虚线
	a->d[style = bold, label="100 times"]; //边加粗,线的标签为100 times

	b->e;

	e->{f; d}; //同一时候连接两个

	b->s0[arrowhead = "normal", dir=both]; //边的箭头类型为正常类型,方位为双向

	//[3] 结点分组 -- 子图subgraph
	//子图的名称必须以cluster开头,否则graphviz无法设别。
	subgraph cluster_1{
		label = "process 1"; //子图的标签
		bgcolor="mintcream"; //子图的背景色
		s0->s1->s2; 		 //构造连接关系
	};

	//[4] 多条数据的记录 shape = "record"
	//採用'|'切割数据 '\l'换行
	Animal[label = "{Animal | + name : String\l+ age : int\l |+ die() : void\l}", shape = "record" ];
	subgraph clusterAnimalImpl{
		bgcolor = "yellow";
		Dog[label = "{Dog| |+ bark() : void\l}" , shape = "record"];
		Cat[label = "{Cat| |+ meow() : void\l}" , shape = "record"];
	};

	edge[arrowhead = "empty"];
	Dog->Animal;
	Cat->Animal;
	Dog->Cat[arrowhead="none", label="0..*"];
}
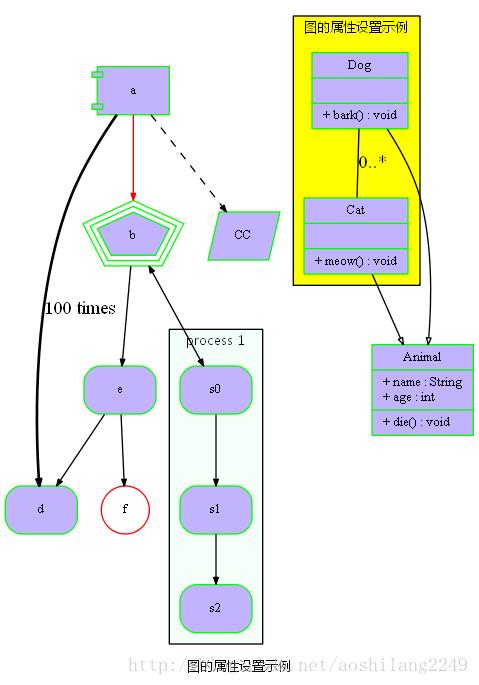
效果图:

很多其它參考:
安装完Graphviz软件后,在安装文件夹的..\Graphviz\share\graphviz\doc\html,获取很多其它的參考资料。
以上是关于Graphviz 绘制流程图的主要内容,如果未能解决你的问题,请参考以下文章