决策树算法
Posted 周虽旧邦其命维新
tags:
篇首语:本文由小常识网(cha138.com)小编为大家整理,主要介绍了决策树算法相关的知识,希望对你有一定的参考价值。
1、决策树的概念
决策树是非参数学习算法,可以解决分类问题,天然可以解决多分类问题,也可以解决回归问题,有非常好的可解释性。
编写PlotDecisionBoundary.py文件
import numpy as np
import matplotlib.pyplot as plt

def plot_decison_boundary(model, axis):
    x0, x1 = np.meshgrid(
        np.linspace(axis[0], axis[1],int((axis[1] - axis[0]) * 100)).reshape(-1, 1),
        np.linspace(axis[2], axis[3],int((axis[1] - axis[0]) * 100)).reshape(-1, 1)
    )
    X_new = np.c_[x0.ravel(), x1.ravel()]

    y_predict = model.predict(X_new)
    zz = y_predict.reshape(x0.shape)

    from matplotlib.colors import ListedColormap
    custom_cmap = ListedColormap(['#EF9A9A', '#FFF59D', '#90CAF9'])

    plt.contourf(x0, x1, zz, linewidth=5, cmap=custom_cmap)
使用决策树对鸢尾花数据分类:
import numpy as np
import matplotlib.pyplot as plt
from sklearn import datasets
from sklearn.tree import DecisionTreeClassifier
from common.PlotDecisionBoundary import plot_decison_boundary

# 使用鸢尾花数据集演示决策树思路
iris = datasets.load_iris()
X = iris.data[:,2:]
y = iris.target

# max_depth树的最大深度为2
dt_clf = DecisionTreeClassifier(max_depth=2, criterion='entropy')
dt_clf.fit(X,y)
print(dt_clf.score(X,y))

plot_decison_boundary(dt_clf, axis=[0.5,7.5,0,3])
plt.scatter(X[y==0,0],X[y==0,1])
plt.scatter(X[y==1,0],X[y==1,1])
plt.scatter(X[y==2,0],X[y==2,1])
plt.show()
从决策边界图像可以看出,首先X小于2.4被划分为A类,其余数据被分做一类,然后y小于1.8被划分为B类,大于1.8被划分为C类。
问题:
每个节点在哪个维度做划分?
某个维度在哪个值上做划分?
2、信息熵
2.1 信息熵的概念
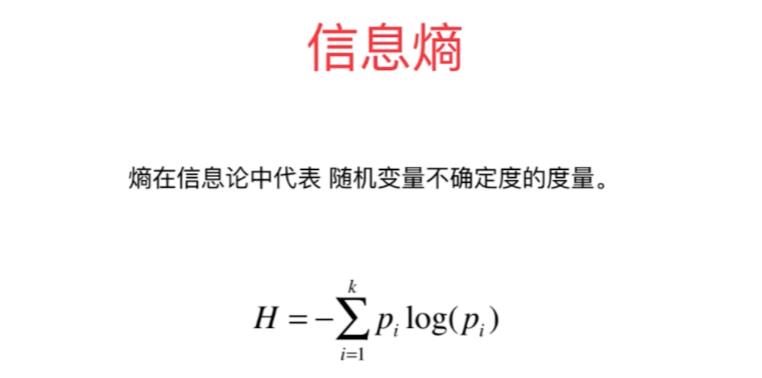
熵在信息论中代表随机变量的不确定度的度量。熵越大,数据的不确定性越高,熵越小,数据的不确定性越低。
式1.1 是一种表示样本集纯度的指标,被称为信息熵(Information Entropy),其中k 表示样本集分类数,pi表示第 i 类样本在样本集所占比例。H的值越小,样本集的纯度越高。

对于二分类问题,信息熵的公式也可以写成:

2.2 代码演示信息熵变化规律
代码演示二分类问题信息熵的变化规律:
import numpy as np
import matplotlib.pyplot as plt

# 二分类问题信息熵计算函数
def entropy(p):
    return - p * np.log(p) - (1 - p) * np.log(1 - p)

x = np.linspace(0.01, 0.99, 200)
# 根据绘制出来的图像可以看出,二分类问题当两种类别在样本集的占比都是0.5时,信息熵最大
plt.plot(x, entropy(x))
plt.show()
通过绘制曲线可以看出,样本集的数据越偏向某一类别,信息熵越小,数据的不确定性越低。
2.3 使用信息熵寻找最优划分
使用信息熵来寻找第一章决策树中的问题,在哪个维度上的哪个值做划分
import numpy as np
import matplotlib.pyplot as plt
from sklearn import datasets
from sklearn.tree import DecisionTreeClassifier
from collections import Counter
from math import log

# 使用鸢尾花数据集演示决策树思路
iris = datasets.load_iris()
X = iris.data[:, 2:]
y = iris.target


def split(X, y, d, value):
    index_a = (X[:, d] <= value)
    index_b = (X[:, d] > value)
    return X[index_a], X[index_b], y[index_a], y[index_b]


def try_split(X, y):
    best_entropy = float('inf')
    best_d, best_v = -1, -1
    for d in range(X.shape[1]):
        sortedIndex = np.argsort(X[:, d])
        for i in range(1, len(X)):
            if X[sortedIndex[i - 1], d] != X[sortedIndex[i], d]:
                v = X[sortedIndex[i - 1], d] + X[sortedIndex[i], d] / 2
                X_l, X_r, y_l, y_r = split(X, y, d, v)
                e = entropy(y_l) + entropy(y_r)
                if e < best_entropy:
                    best_entropy, best_d, best_v = e, d, v
    return best_entropy, best_d, best_v


def entropy(y):
    counter = Counter(y)
    res = 0.0
    for num in counter.values():
        p = num / len(y)
        res += - p * log(p)
    return res


best_entropy, best_d, best_v = try_split(X, y)
X_l, X_r, y_l, y_r = split(X, y, best_d, best_v)
print(entropy(y_l))
print(entropy(y_r))
best_entropy2, best_d2, best_v2 = try_split(X_r, y_r)
print(best_d2,best_v2)
X_l2, X_r2, y_l2, y_r2 = split(X_r, y_r, best_d2, best_v2)
print(entropy(y_l2))
print(entropy(y_r2))
3、基尼系数
式1.2 是另一种表示样本集纯度的指标,被称为基尼系数(Gini index),其中k 表示样本集分类数,pi表示第 i 类样本在样本集所占比例。G的值越小,样本集的纯度越高。

使用基尼系数训练决策树:
import numpy as np
import matplotlib.pyplot as plt
from sklearn import datasets
from sklearn.tree import DecisionTreeClassifier
from common.PlotDecisionBoundary import plot_decison_boundary

# 使用鸢尾花数据集演示决策树
iris = datasets.load_iris()
X = iris.data[:,2:]
y = iris.target

# max_depth树的最大深度为2
dt_clf = DecisionTreeClassifier(max_depth=2, criterion='gini')
dt_clf.fit(X,y)
print(dt_clf.score(X,y))

plot_decison_boundary(dt_clf, axis=[0.5,7.5,0,3])
plt.scatter(X[y==0,0],X[y==0,1])
plt.scatter(X[y==1,0],X[y==1,1])
plt.scatter(X[y==2,0],X[y==2,1])
plt.show()
使用基尼系数寻找最优划分:
import numpy as np
import matplotlib.pyplot as plt
from sklearn import datasets
from sklearn.tree import DecisionTreeClassifier
from collections import Counter
from math import log

# 使用鸢尾花数据集演示决策树思路
iris = datasets.load_iris()
X = iris.data[:, 2:]
y = iris.target


def split(X, y, d, value):
    index_a = (X[:, d] <= value)
    index_b = (X[:, d] > value)
    return X[index_a], X[index_b], y[index_a], y[index_b]


def try_split(X, y):
    best_g = float('inf')
    best_d, best_v = -1, -1
    for d in range(X.shape[1]):
        sortedIndex = np.argsort(X[:, d])
        for i in range(1, len(X)):
            if X[sortedIndex[i - 1], d] != X[sortedIndex[i], d]:
                v = X[sortedIndex[i - 1], d] + X[sortedIndex[i], d] / 2
                X_l, X_r, y_l, y_r = split(X, y, d, v)
                g = gini(y_l) + gini(y_r)
                if g < best_g:
                    best_g, best_d, best_v = g, d, v
    return best_g, best_d, best_v


def gini(y):
    counter = Counter(y)
    res = 1.0
    for num in counter.values():
        p = num / len(y)
        res -= p ** 2
    return res


best_gini, best_d, best_v = try_split(X, y)
X_l, X_r, y_l, y_r = split(X, y, best_d, best_v)
print(best_gini)
print(gini(y_l))
print(gini(y_r))
print('==========================')
best_gini2, best_d2, best_v2 = try_split(X_r, y_r)
print(best_gini2, best_d2, best_v2)
X_l2, X_r2, y_l2, y_r2 = split(X_r, y_r, best_d2, best_v2)
print(gini(y_l2))
print(gini(y_r2))
信息熵的计算比基尼系数稍慢,scikilearn中默认为基尼系数,大多数时候使用信息熵和基尼系数训练的效果相近。
4、CART与决策树中的超参数
决策树的生成算法有ID3, C4.5和CART等,sklearn中使用的是CART的方式生成决策树。
import numpy as np
import matplotlib.pyplot as plt
from sklearn import datasets
from sklearn.tree import DecisionTreeClassifier
from common.PlotDecisionBoundary import plot_decison_boundary

X,y = datasets.make_moons(noise=0.25, random_state=666)

# plt.scatter(X[y==0,0],X[y==0,1])
# plt.scatter(X[y==1,0],X[y==1,1])
# plt.show()

# 决策树最多可以有多少个叶子节点
dt_clf = DecisionTreeClassifier(max_leaf_nodes=4)
# 一个叶子节点至少要有多少个元素
# dt_clf = DecisionTreeClassifier(min_samples_leaf=6)
# min_samples_split样本集至少有多少个元素才拆分
# dt_clf = DecisionTreeClassifier(min_samples_split=10)
# 默认决策树会一直拆分,模型出现过拟合,max_depth时又欠拟合
# dt_clf = DecisionTreeClassifier()
dt_clf.fit(X,y)

plot_decison_boundary(dt_clf, axis=[-1.5,2.5,-1.0,1.5])
plt.scatter(X[y==0,0],X[y==0,1])
plt.scatter(X[y==1,0],X[y==1,1])
plt.scatter(X[y==2,0],X[y==2,1])
plt.show()
5、决策树解决回归问题
DecisionTreeRegressor的很多超参数与DecisionTreeClassifier类似,代码实现如下:
import numpy as np
import matplotlib.pyplot as plt
from sklearn import datasets
from sklearn.model_selection import train_test_split
from sklearn.preprocessing import StandardScaler
from sklearn.tree import DecisionTreeRegressor

boston = datasets.load_boston()
X = boston.data
y = boston.target

X_train,X_test,y_train,y_test = train_test_split(X,y)

dt_reg = DecisionTreeRegressor()
dt_reg.fit(X_train,y_train)
print(dt_reg.score(X_test,y_test))
print(dt_reg.score(X_train,y_train))
6、决策树的局限性
最大的局限性是决策边界都是横平竖直的,左右水平分布的两类数据旋转45度后决策边界的划分就可能不符合实际情况。
决策树对于个别的数据可能是非常敏感的,这也是大部分非参数学习算法都有的缺陷。
以上是关于决策树算法的主要内容,如果未能解决你的问题,请参考以下文章