时序数据预测机器学习篇——带你一次看个爽——以JetRail高铁的乘客数量为例
Posted 猫猫头丁
tags:
篇首语:本文由小常识网(cha138.com)小编为大家整理,主要介绍了时序数据预测机器学习篇——带你一次看个爽——以JetRail高铁的乘客数量为例相关的知识,希望对你有一定的参考价值。
时序数据预测机器学习篇——带你一次看个爽——以JetRail高铁的乘客数量为例——朴素法、简单平均法、简单指数法、霍尔特(Holt)线性趋势法、Holt-Winters季节性预测模型、自回归移动平均模型
今天我们来体验一下通过机器学习方法进行时序数据预测。首先我们来加载各种需要的包和数据集。这次我还是使用的AIstudio来进行实验,我真的太喜欢aistudio了。
import pandas as pd
import numpy as np
import matplotlib.pyplot as plt
df = pd.read_csv('data/data83497/jetrail.csv')
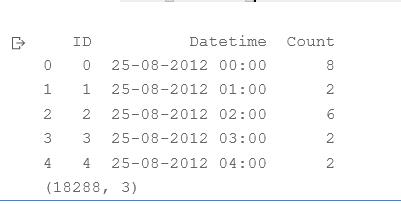
print(df.head())
print(df.shape)
来看一下这个数据集

接下来我们划分训练集和测试集,前10392条数据为训练集,后面的为测试集。
df = pd.read_csv('data/data83497/jetrail.csv', nrows=11856)

train = df[0:10392]
test = df[10392:]

# Aggregating the dataset at daily level
df['Timestamp'] = pd.to_datetime(df['Datetime'], format='%d-%m-%Y %H:%M')  # 4位年用Y,2位年用y
df.index = df['Timestamp']
df = df.resample('D').mean() #按天采样,计算均值

train['Timestamp'] = pd.to_datetime(train['Datetime'], format='%d-%m-%Y %H:%M')
train.index = train['Timestamp']
train = train.resample('D').mean() #

test['Timestamp'] = pd.to_datetime(test['Datetime'], format='%d-%m-%Y %H:%M')
test.index = test['Timestamp']
test = test.resample('D').mean()

#Plotting data
train.Count.plot(figsize=(15,8), title= 'Daily Ridership', fontsize=14)
test.Count.plot(figsize=(15,8), title= 'Daily Ridership', fontsize=14)
plt.show()
画图看一下训练集和测试集

朴素法
dd = np.asarray(train['Count'])
y_hat = test.copy()
y_hat['naive'] = dd[len(dd) - 1]
plt.figure(figsize=(12, 8))
plt.plot(train.index, train['Count'], label='Train')
plt.plot(test.index, test['Count'], label='Test')
plt.plot(y_hat.index, y_hat['naive'], label='Naive Forecast')
plt.legend(loc='best')
plt.title("Naive Forecast")
plt.show()

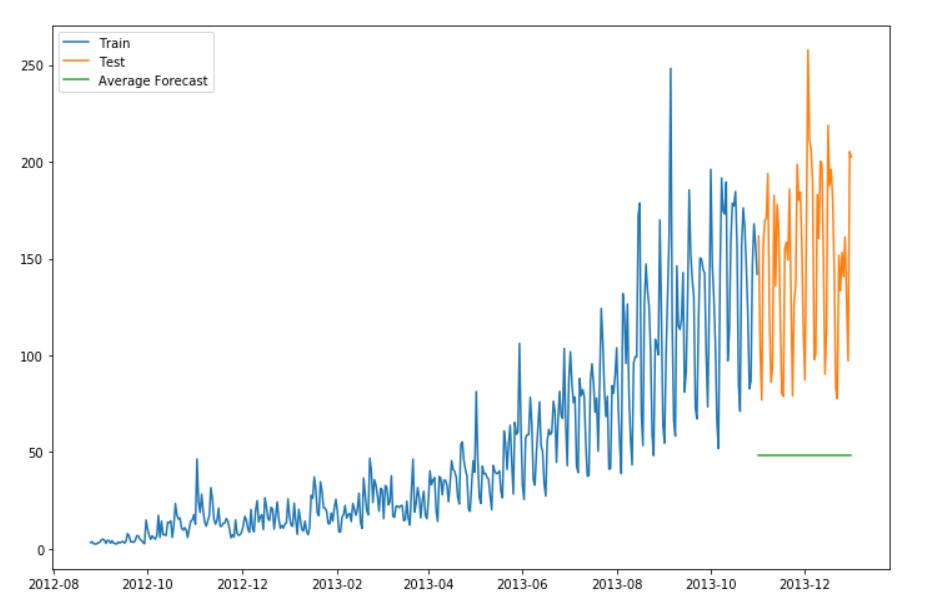
简单平均法
y_hat_avg = test.copy()
y_hat_avg['avg_forecast'] = train['Count'].mean()
plt.figure(figsize=(12,8))
plt.plot(train['Count'], label='Train')
plt.plot(test['Count'], label='Test')
plt.plot(y_hat_avg['avg_forecast'], label='Average Forecast')
plt.legend(loc='best')
plt.show()

简单指数法
!pip install statsmodels
from statsmodels.tsa.api import SimpleExpSmoothing
y_hat_avg = test.copy()
fit = SimpleExpSmoothing(np.asarray(train['Count'])).fit(smoothing_level=0.6, optimized=False)
y_hat_avg['SES'] = fit.forecast(len(test))
plt.figure(figsize=(16, 8))
plt.plot(train['Count'], label='Train')
plt.plot(test['Count'], label='Test')
plt.plot(y_hat_avg['SES'], label='SES')
plt.legend(loc='best')
plt.show()

可以看到这前几种都是傻瓜算法,出来的结果也是怎么说呢,比较傻瓜。
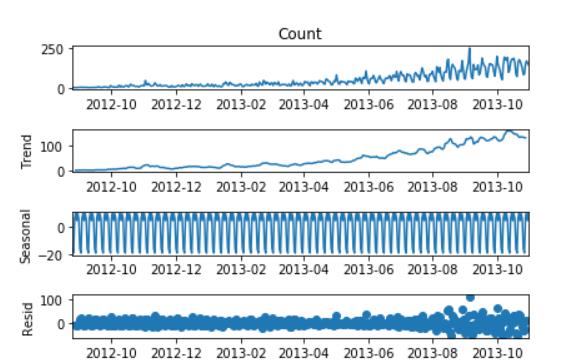
霍尔特(Holt)线性趋势法
import statsmodels.api as sm
sm.tsa.seasonal_decompose(train['Count']).plot()
result = sm.tsa.stattools.adfuller(train['Count'])
plt.show()

from statsmodels.tsa.api import Holt

y_hat_avg = test.copy()

fit = Holt(np.asarray(train['Count'])).fit(smoothing_level=0.3, smoothing_slope=0.1)
y_hat_avg['Holt_linear'] = fit.forecast(len(test))

plt.figure(figsize=(16, 8))
plt.plot(train['Count'], label='Train')
plt.plot(test['Count'], label='Test')
plt.plot(y_hat_avg['Holt_linear'], label='Holt_linear')
plt.legend(loc='best')
plt.show()
 哦豁,开始有个趋势出来了。
Holt-Winters季节性预测模型
from statsmodels.tsa.api import ExponentialSmoothing

y_hat_avg = test.copy()
fit1 = ExponentialSmoothing(np.asarray(train['Count']), seasonal_periods=7, trend='add', seasonal='add', ).fit()
y_hat_avg['Holt_Winter'] = fit1.forecast(len(test))
plt.figure(figsize=(16, 8))
plt.plot(train['Count'], label='Train')
plt.plot(test['Count'], label='Test')
plt.plot(y_hat_avg['Holt_Winter'], label='Holt_Winter')
plt.legend(loc='best')
plt.show()
 哇哦!貌似预测的不错的样子,和测试集有那种重合的趋势了。
自回归移动平均模型
import statsmodels.api as sm
y_hat_avg = test.copy()
fit1 = sm.tsa.statespace.SARIMAX(train.Count, order=(2, 1, 4), seasonal_order=(0, 1, 1, 7)).fit()
y_hat_avg['SARIMA'] = fit1.predict(start="2013-11-1", end="2013-12-31", dynamic=True)
plt.figure(figsize=(16, 8))
plt.plot(train['Count'], label='Train')
plt.plot(test['Count'], label='Test')
plt.plot(y_hat_avg['SARIMA'], label='SARIMA')
plt.legend(loc='best')
plt.show()
 完整的数据集和代码都已经上传资源喽!大家快来体验吧!
链接: https://download.csdn.net/download/weixin_46570668/19667382.
以上是关于时序数据预测机器学习篇——带你一次看个爽——以JetRail高铁的乘客数量为例的主要内容,如果未能解决你的问题,请参考以下文章