Echarts 明明和官方文档配置一致,图表加载却是报错:Error in mounted hook: "TypeError: Cannot read property 'get&#
Posted huyuting
tags:
篇首语:本文由小常识网(cha138.com)小编为大家整理,主要介绍了Echarts 明明和官方文档配置一致,图表加载却是报错:Error in mounted hook: "TypeError: Cannot read property 'get&#相关的知识,希望对你有一定的参考价值。
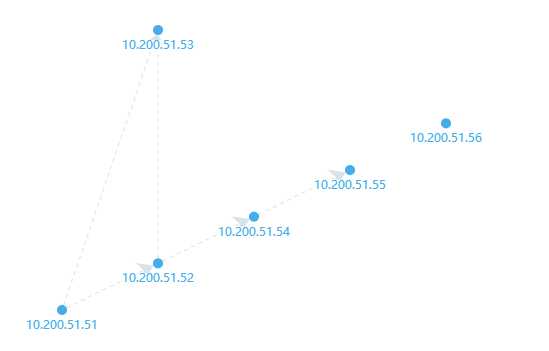
在搞Echarts的关系图graph,一开始正常显示,如下:

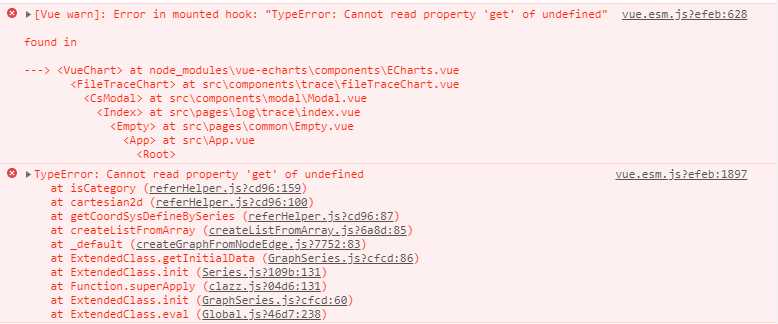
然而就在本人修改了option里的curveness = 0.2,ctrl+f5强制刷新页面后,图表加载报错:Error in mounted hook: "TypeError: Cannot read property ‘get‘ of undefined"

一开始以为是因为curveness的修改而报错,遂回退修改,然而问题依旧。

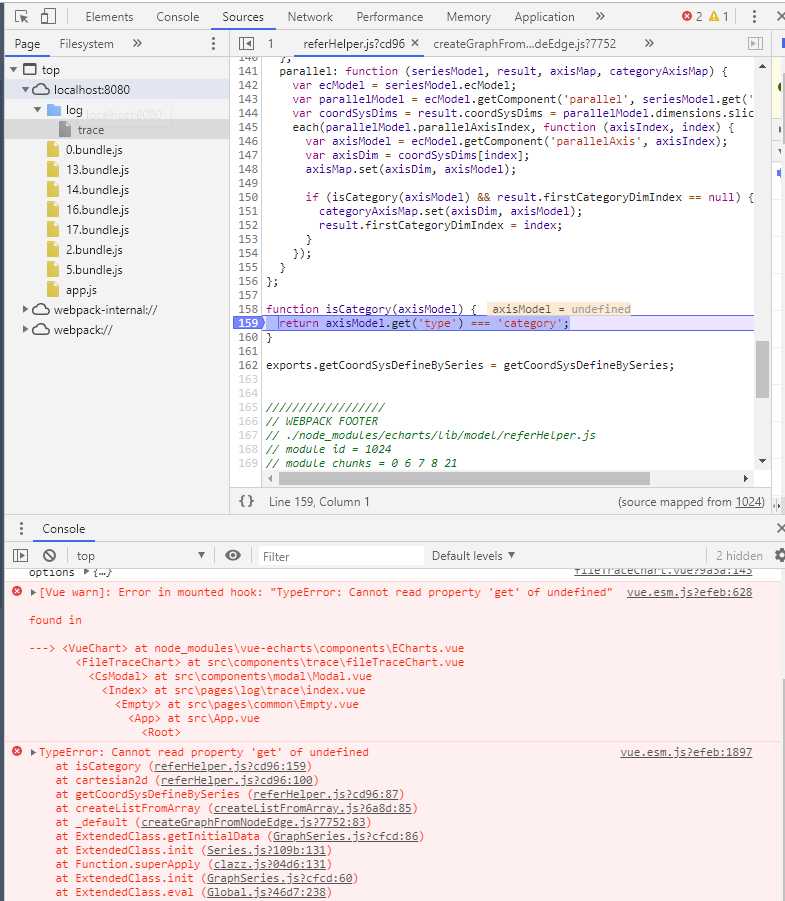
于是乎,研究一下报错的地方,就是“axisModel = undefined”这个鬼东西报错;
然后各种怀疑,怀疑dom组件加载未成功就进行了初始化,又怀疑echarts布局配置有bug(coordinateSystem: ‘cartesian2d‘,),折腾半小时后无果。
于是使出最后一招“重启开发环境”:重新npm run dev,问题解决。
后面试验了一下,发现浏览器加载了npm run dev 缓存的东西,当动态v-if去改echarts显示或不显示时,也会报以上描述的错。渣渣的我只能简单的将该问题定义为:npm run dev缓存影响组件装载。
附上options配置:
options: {
"xAxis": [{
"show": false,
"type": "value"
}],
"yAxis": [{
"show": false,
"type": "value"
}],
"animationDurationUpdate": 1500,
"animationEasing": "cubicOut",
"animationEasingUpdate": "quinticInOut",
"series": [{
"type": "graph",
"layout": "none",
"coordinateSystem": "cartesian2d",
"zlevel": 3,
"xAxisIndex": 0,
"yAxisIndex": 0,
"focusNodeAdjacency": true,
"symbolSize": 10,
"label": {
"normal": {
"show": true,
"fontSize": 12,
"position": "bottom",
"backgroundColor": "#fff",
"formatter": "{b}"
}
},
"edgeSymbol": ["circle", "arrow"],
"edgeSymbolSize": [0, 15],
"data": [{
"name": "10.200.51.51",
"value": [1, 0],
"createtime": "2019/10/08 14:00:45",
"itemStyle": {
"color": "#21B1ED"
}
}, {
"name": "10.200.51.52",
"value": [2, 20],
"createtime": "2019/10/08 14:01:51",
"itemStyle": {
"color": "#21B1ED"
}
}, {
"name": "10.200.51.53",
"value": [2, 120],
"createtime": "2019/10/08 14:01:51",
"itemStyle": {
"color": "#21B1ED"
}
}, {
"name": "10.200.51.54",
"value": [3, 40],
"createtime": "2019/10/08 14:02:51",
"itemStyle": {
"color": "#21B1ED"
}
}, {
"name": "10.200.51.55",
"value": [4, 60],
"createtime": "2019/10/08 14:04:51",
"itemStyle": {
"color": "#21B1ED"
}
}, {
"name": "10.200.51.56",
"value": [5, 80],
"createtime": "2019/10/08 14:08:51",
"itemStyle": {
"color": "#21B1ED"
}
}],
"links": [{
"source": "10.200.51.51",
"target": "10.200.51.52",
"lineStyle": {
"normal": {
"color": "#D1E1E7",
"opacity": 0.9,
"width": 1,
"type": "dashed",
"curveness": 0
}
}
}, {
"source": "10.200.51.51",
"target": "10.200.51.53",
"lineStyle": {
"normal": {
"color": "#D1E1E7",
"opacity": 0.9,
"width": 1,
"type": "dashed",
"curveness": 0
}
}
}, {
"source": "10.200.51.52",
"target": "10.200.51.53",
"lineStyle": {
"normal": {
"color": "#D1E1E7",
"opacity": 0.9,
"width": 1,
"type": "dashed",
"curveness": 0
}
}
}, {
"source": "10.200.51.52",
"target": "10.200.51.54",
"lineStyle": {
"normal": {
"color": "#D1E1E7",
"opacity": 0.9,
"width": 1,
"type": "dashed",
"curveness": 0
}
}
}, {
"source": "10.200.51.54",
"target": "10.200.51.55",
"lineStyle": {
"normal": {
"color": "#D1E1E7",
"opacity": 0.9,
"width": 1,
"type": "dashed",
"curveness": 0
}
}
}]
}],
"tooltip": {
"trigger": "item",
"backgroundColor": "#fff"
}
}
以上是关于Echarts 明明和官方文档配置一致,图表加载却是报错:Error in mounted hook: "TypeError: Cannot read property 'get&#的主要内容,如果未能解决你的问题,请参考以下文章