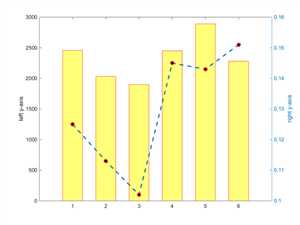
绘制双坐标轴的图形3-不同的plot类型
Posted airboy1
tags:
篇首语:本文由小常识网(cha138.com)小编为大家整理,主要介绍了绘制双坐标轴的图形3-不同的plot类型相关的知识,希望对你有一定的参考价值。
Income=[2456,2032,1900,2450,2890,2280];
Profit_margin=[12.5,11.3,10.2,14.5,14.3,15.1]/100;
t=1:6;
[AX,H1,H2]=plotyy(t,Income,t,Profit_margin,‘bar‘,‘plot‘);
% set(get(AX(1),‘Ylabel‘),‘String‘,‘Left-axis‘);
% set(get(AX(2),‘Ylabel‘),‘String‘,‘Right-axis‘);
ylabel(AX(1),‘left y-axis‘) % left y-axis
ylabel(AX(2),‘right y-axis‘) % right y-axis
% set(H1,‘BarWidth‘,0.6,‘EdgeColor‘,[1,0,0],‘FaceColor‘,[1 1 0.4745]);
% set(H2,‘LineWidth‘,2,‘Marker‘,‘o‘,‘MarkerEdgeColor‘,[1,0,0],‘MarkerFaceColor‘,[1 1 0.4745]);
H1.BarWidth=0.6;
H1.EdgeColor=[1,0,0];
H1.FaceColor=[1 1 0.4745];

H2.LineWidth=2;
H2.LineStyle = ‘--‘;
H2.Marker=‘o‘;
H2.MarkerEdgeColor=[1,0,0];
H2.MarkerFaceColor=[0 0 0];

以上是关于绘制双坐标轴的图形3-不同的plot类型的主要内容,如果未能解决你的问题,请参考以下文章