Python矩阵作图库matplotlib的初级使用
Posted LOGAN_XIONG
tags:
篇首语:本文由小常识网(cha138.com)小编为大家整理,主要介绍了Python矩阵作图库matplotlib的初级使用相关的知识,希望对你有一定的参考价值。
- matplotlib背景介绍:
第三方库matplotlib(没有的话,可在终端输入"pip install matplotlib"进行安装)是一款高质量的2D作图库,可被广泛地应用于支持Python的环境中。并且,如果在某些情境下需要绘制一些基础的3D图,这个时候可以结合标准库mpl_toolkits.mplot3d来使用。出于Python语言的便携性,从而为我们提供了一套轻量级的作图方案。
由于网络上的资料大多不太符合官方推荐的作图方式,且很多内容并没有一个清晰的逻辑。笔者此处重新整理几个简单的示例,仅供参考!
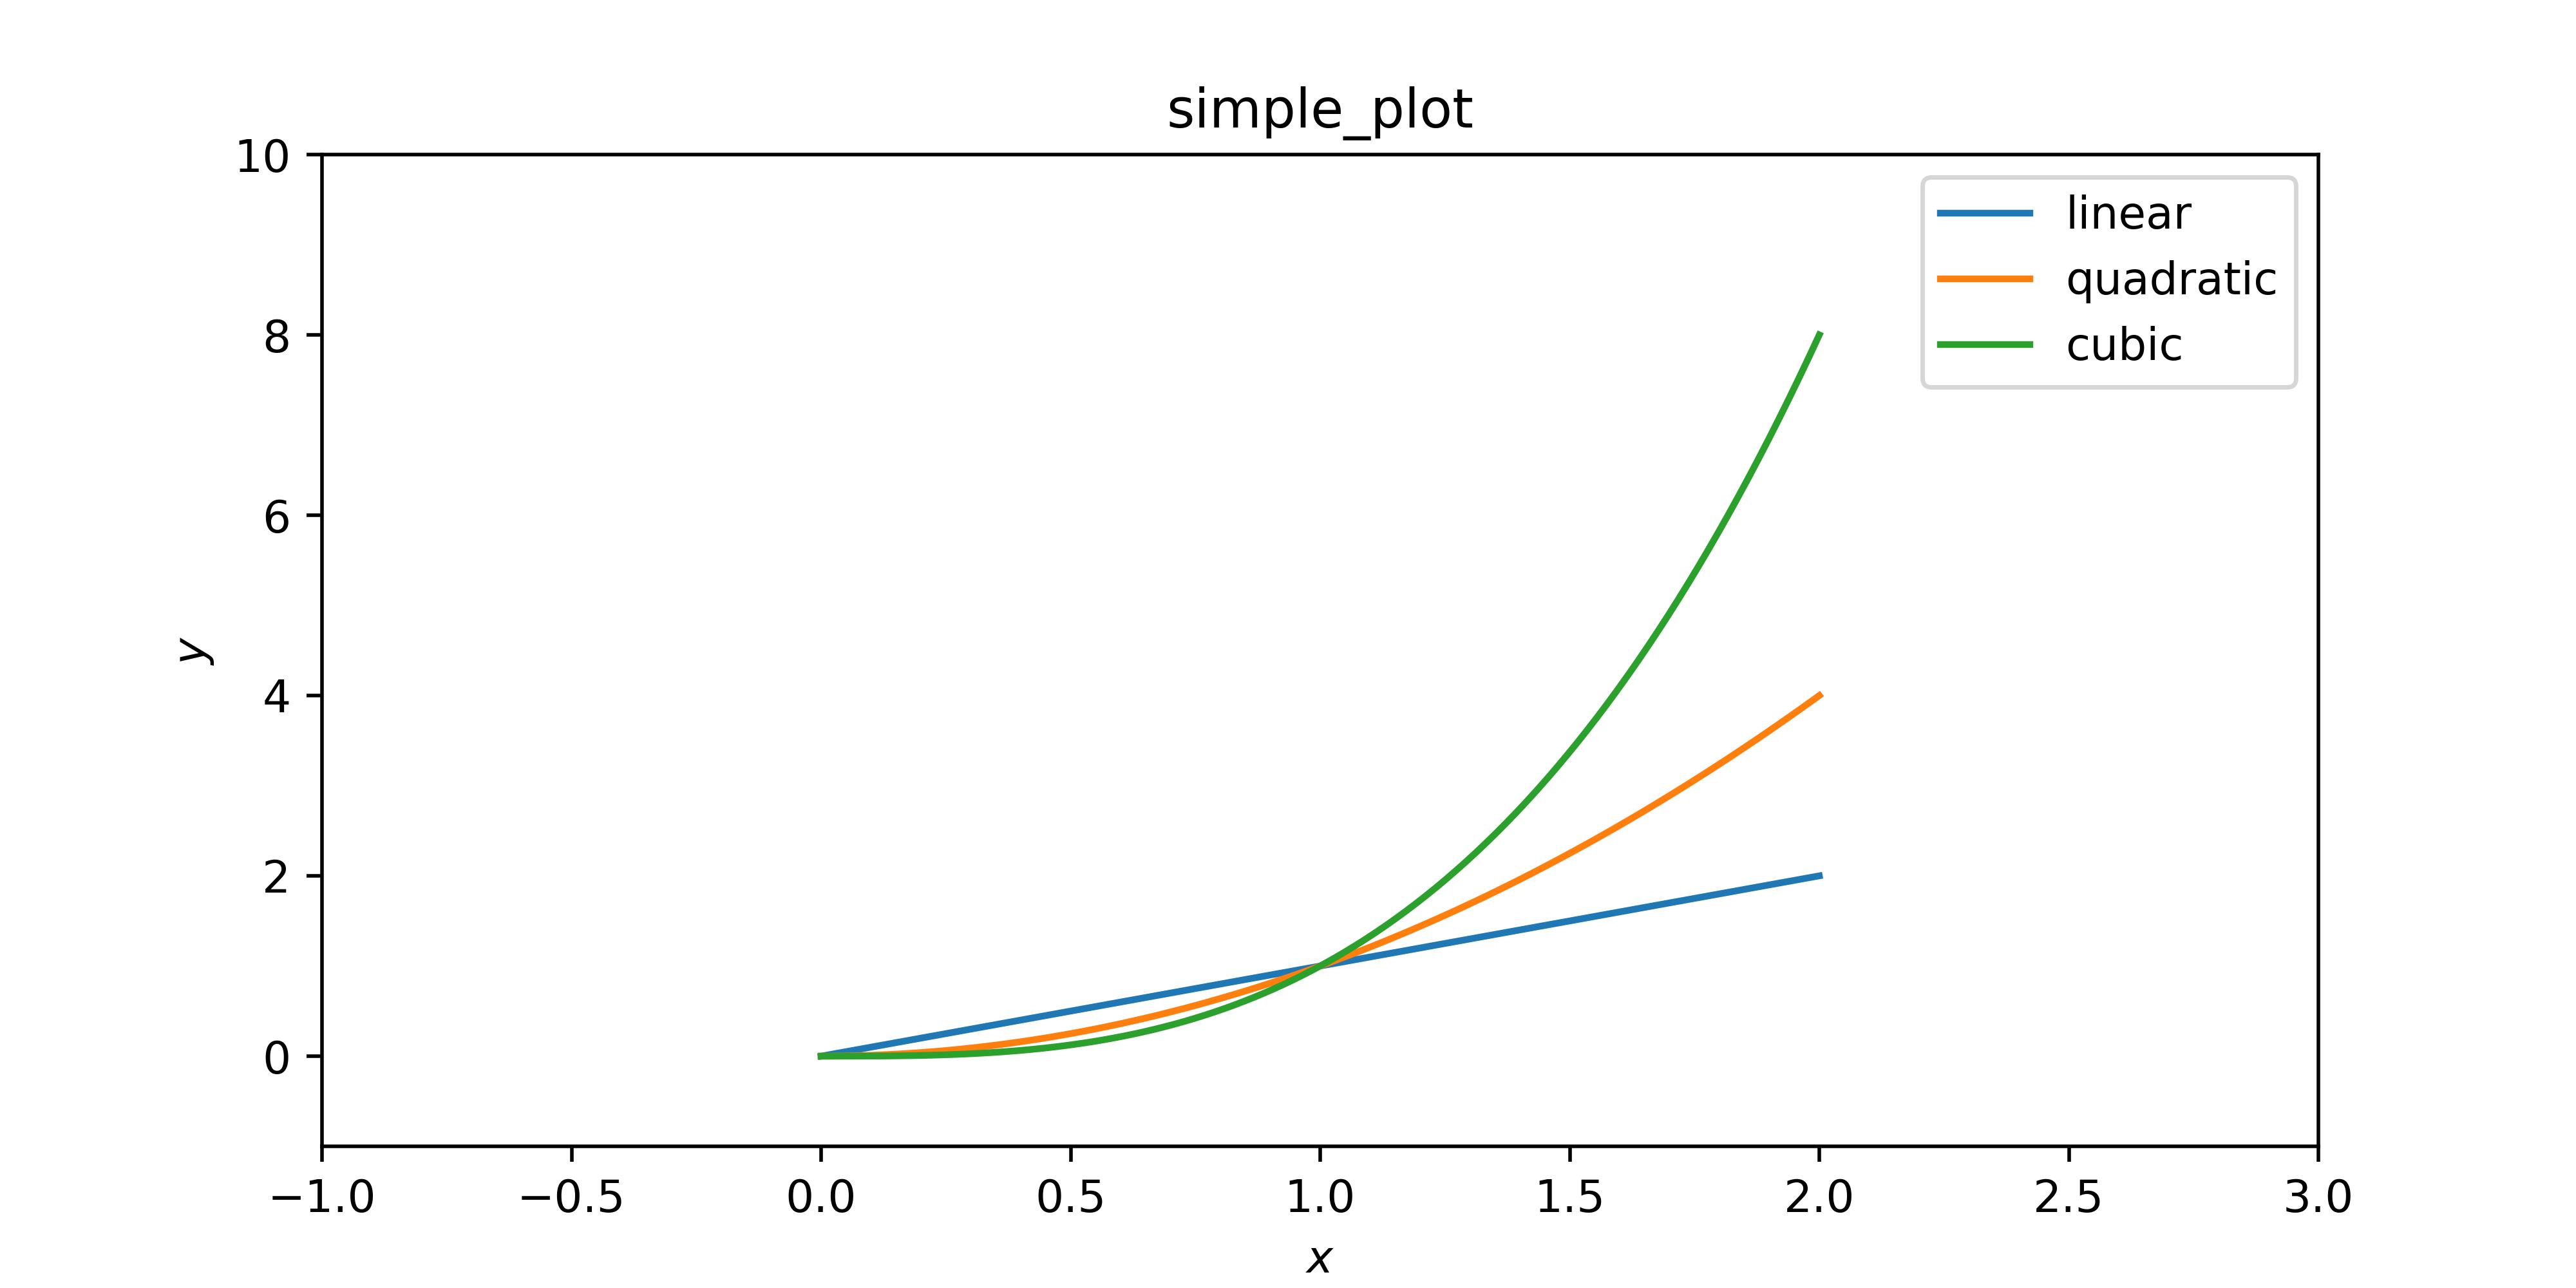
- 简单作图示例:
 View Code
 1 import numpy
 2 import matplotlib.pyplot as plt
 3
 4 x = numpy.linspace(0, 2, 100)
 5
 6 plt.figure(figsize=(8, 4))
 7
 8 plt.plot(x, x, label=\'linear\')
 9 plt.plot(x, x**2, label=\'quadratic\')
10 plt.plot(x, x**3, label=\'cubic\')
11
12 # 设置展示区间
13 plt.xlim(-1, 3)
14 plt.ylim(-1, 10)
15
16 # 设置展示信息
17 plt.xlabel(\'$x$\')
18 plt.ylabel(\'$y$\')
19 plt.title(\'simple_plot\')
20 plt.legend(loc=\'best\')
21
22 # 保存图片
23 plt.savefig(fname=\'test_plot.png\', dpi=500)
24
25 # 展示图片
26 plt.show()
27 # 关闭图片
28 plt.close()
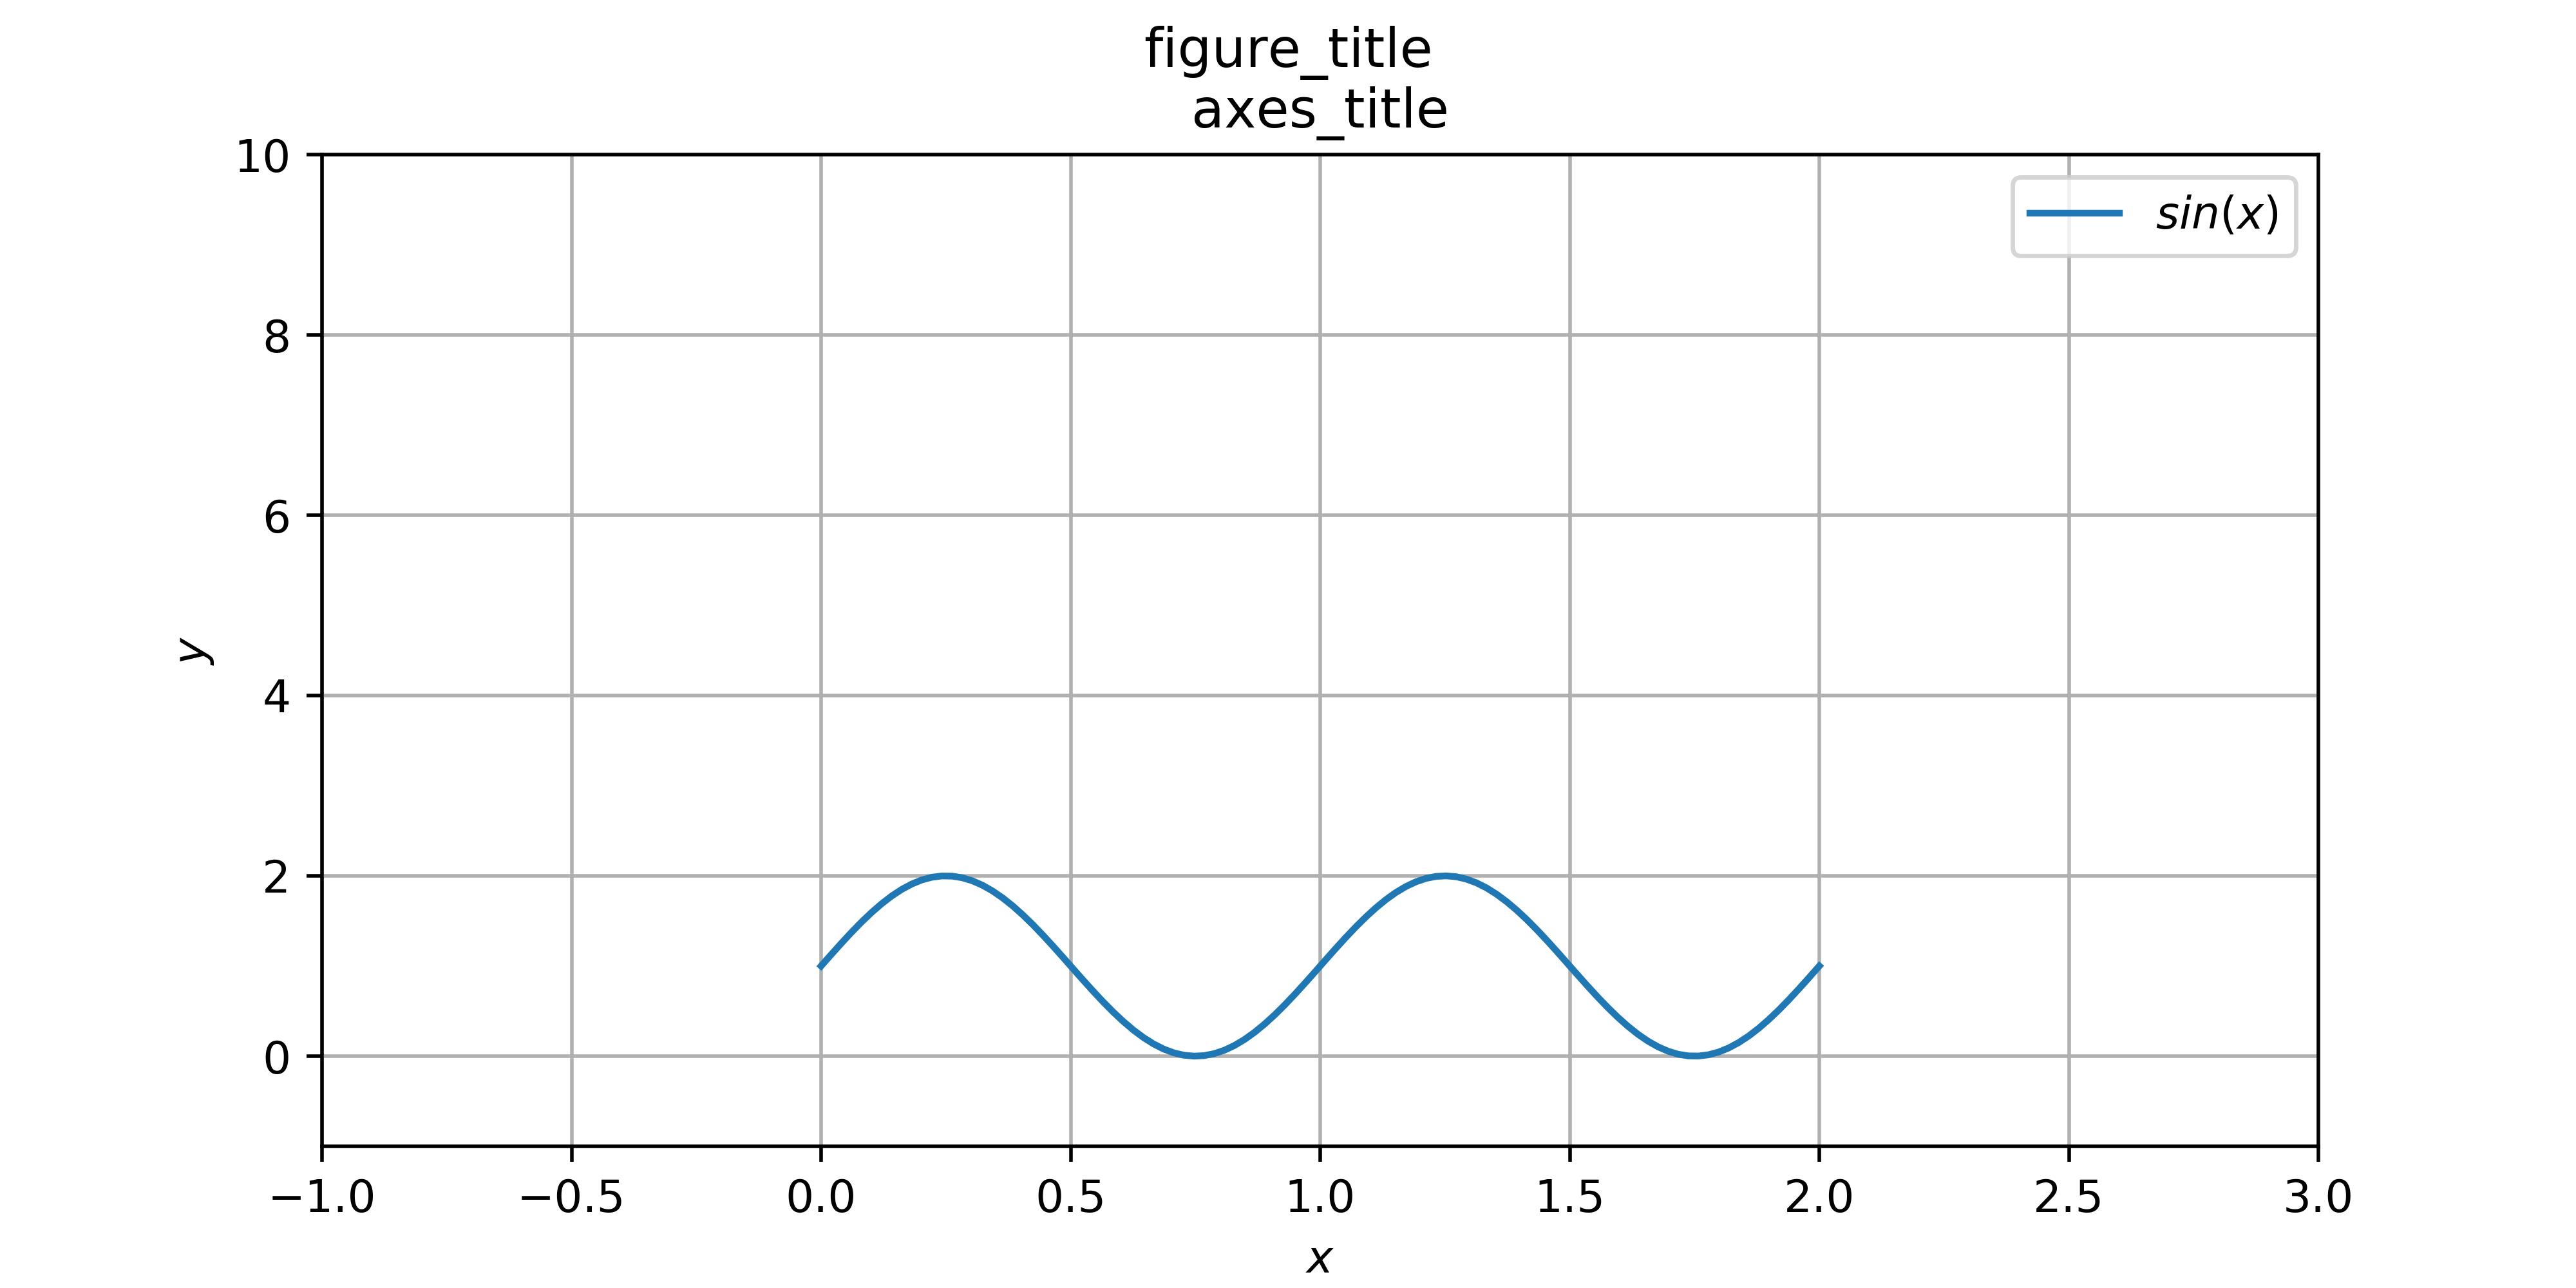
- 复杂作图示例:
明确三层作图对象:
1. 整个图片对象 $\\rightarrow$ figure
2. 图片内的子图对象 $\\rightarrow$ axes
3. 子图内的轴对象 $\\rightarrow$ axis
View Code1 import numpy 2 import matplotlib.pyplot as plt 3 4 # 明确三层作图对象: figure, axes, axis 5 # 整个图片对象, 图片内的子图对象, 子图内的轴对象 6 7 x = numpy.linspace(0, 2, 100) 8 y = 1 + numpy.sin(2 * numpy.pi * x) 9 10 # 创建图片对象 11 fig = plt.figure(figsize=(8, 4)) 12 fig.suptitle(\'figure_title\') 13 14 # 创建子图对象 15 axes = plt.subplot() 16 axes.plot(x, y, label=\'$sin(x)$\') 17 axes.set(xlim=(-1, 3), ylim=(-1, 10), xlabel=\'$x$\', ylabel=\'$y$\', title=\'axes_title\') 18 axes.grid() 19 axes.legend() 20 21 # fig.tight_layout() 22 fig.savefig(\'test_plot.png\', dpi=500) 23 24 plt.show() 25 plt.close()

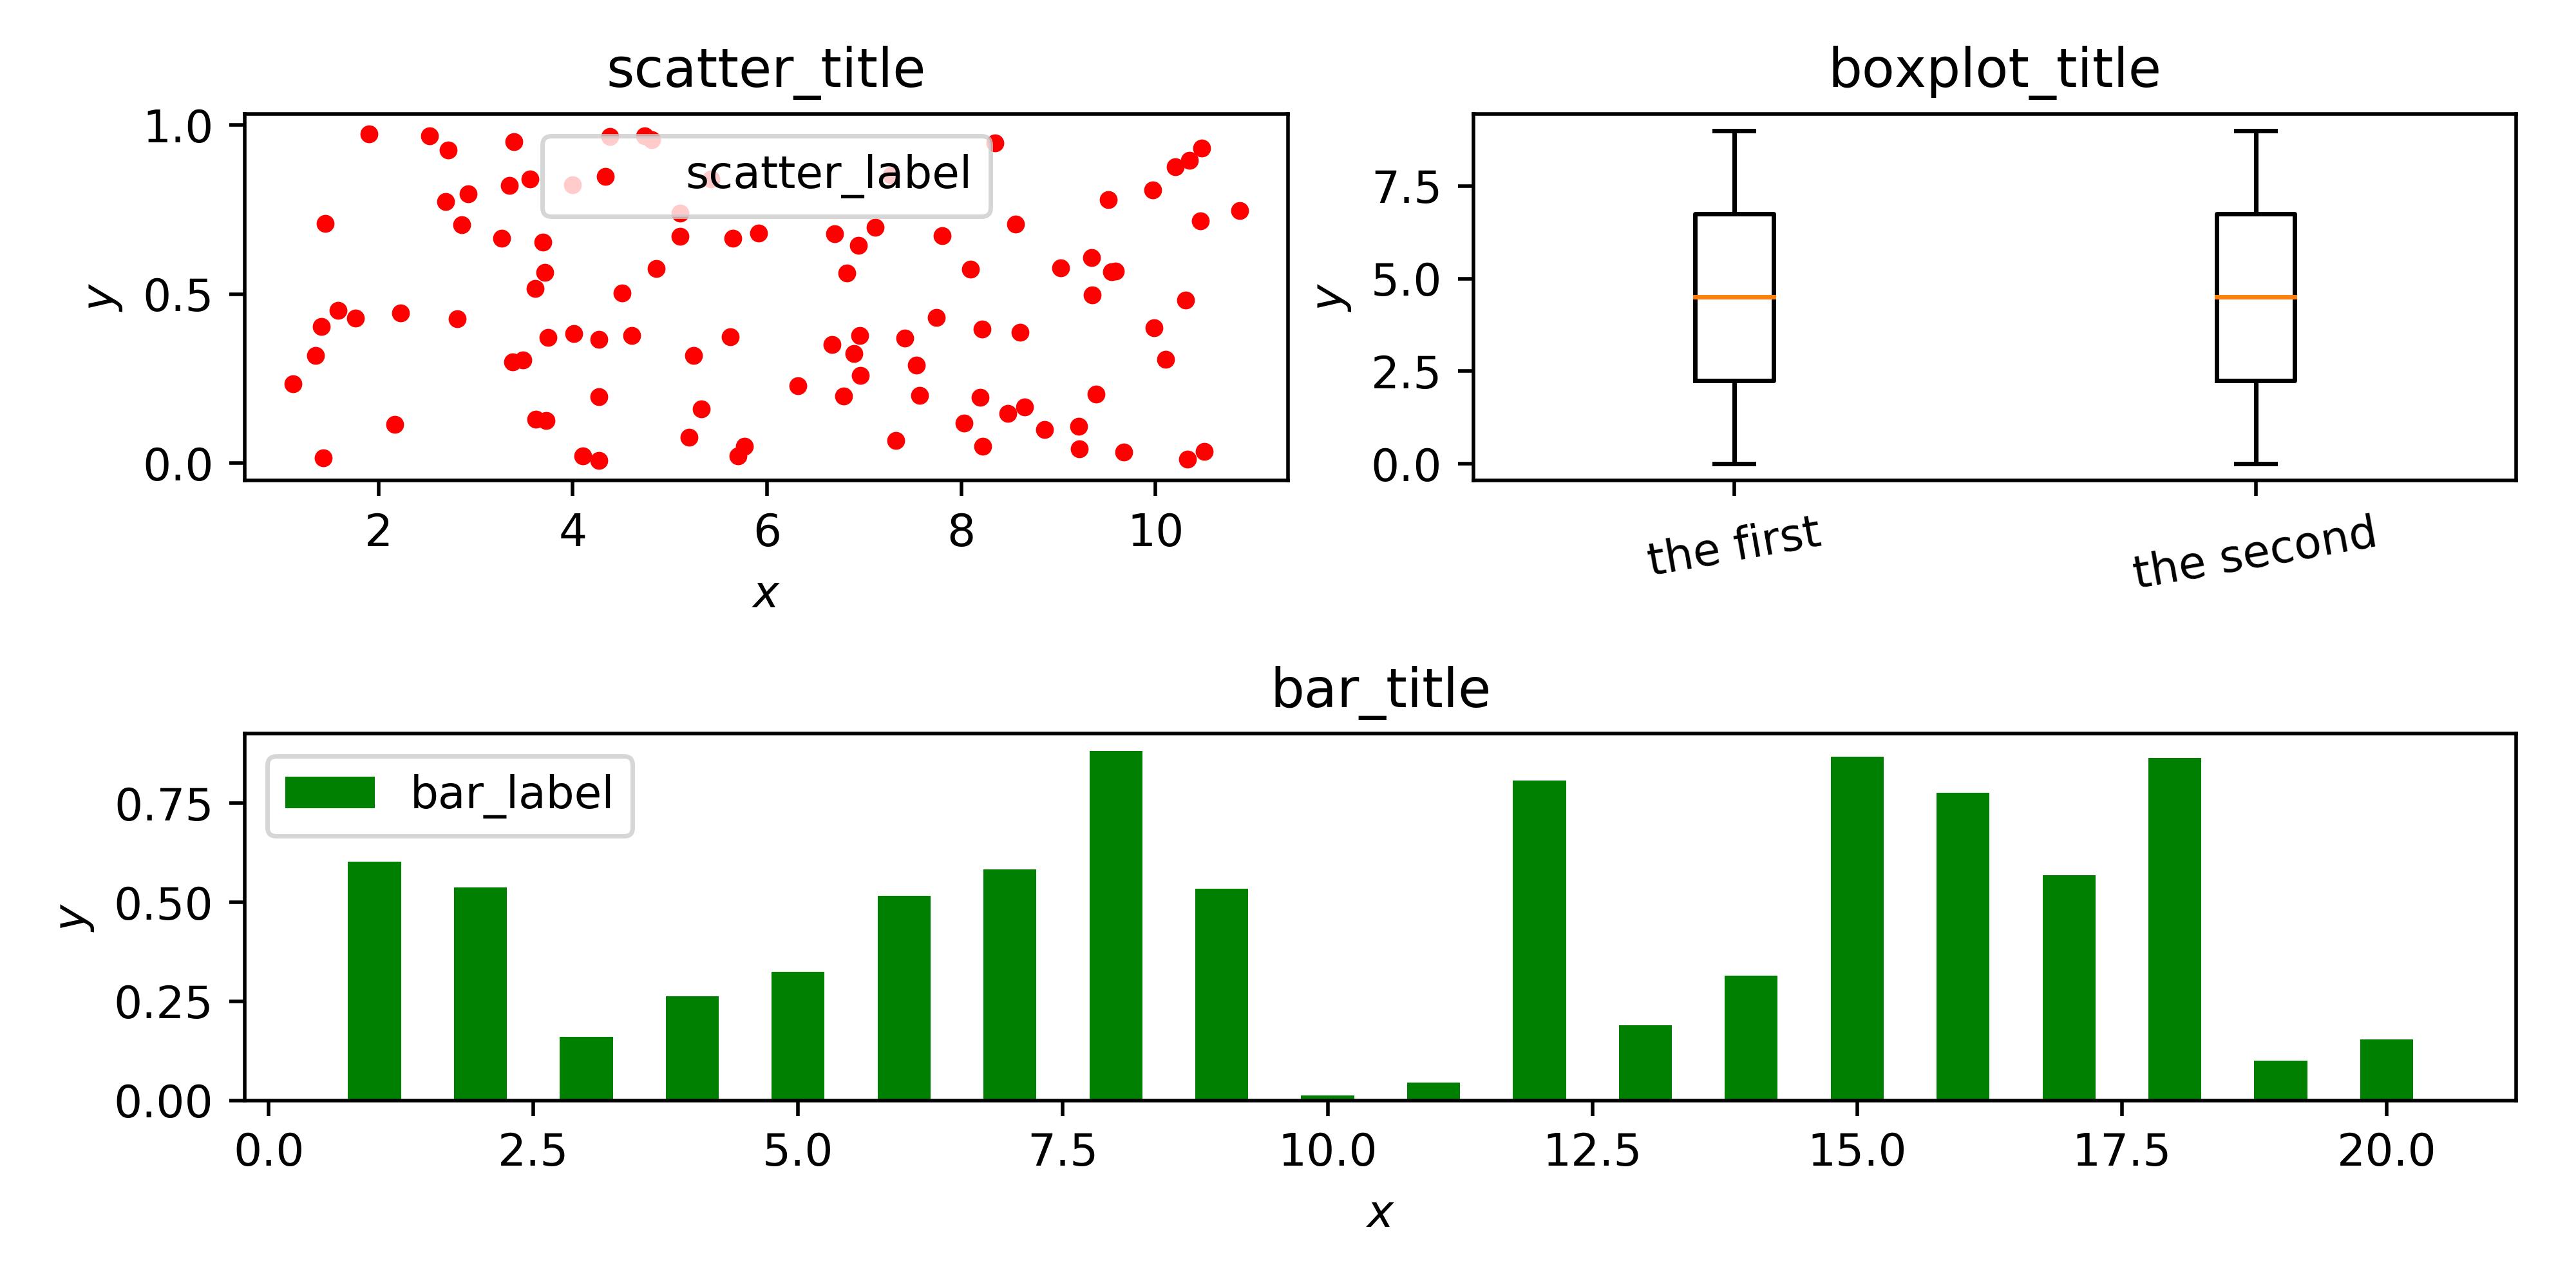
- 复杂作图 $\\rightarrow$ 多类型示例:
View Code1 import numpy 2 import matplotlib.pyplot as plt 3 4 # 创建图片对象 5 fig = plt.figure(figsize=(8, 4)) 6 7 # 创建子图对象 8 ax1 = plt.subplot(2, 2, 1) 9 ax2 = plt.subplot(2, 2, 2) 10 ax3 = plt.subplot(2, 1, 2) 11 12 # 散点图 13 ax1.scatter(numpy.random.uniform(1, 11, 100), numpy.random.random(100), color=\'r\', marker=\'.\', label=\'scatter_label\') 14 ax1.set(xlabel=\'$x$\', ylabel=\'$y$\', title=\'scatter_title\') 15 ax1.legend() 16 17 # 盒型图 18 ax2.boxplot([numpy.arange(10), numpy.arange(10)]) 19 ax2.set_xticklabels([\'the first\', \'the second\'], rotation=10) # 重置坐标轴刻度并旋转 20 ax2.set(ylabel=\'$y$\', title=\'boxplot_title\') 21 22 # 条形图 23 ax3.bar(numpy.arange(1, 21), numpy.random.random(20), width=0.5, color=\'g\', label=\'bar_label\') 24 ax3.set(xlabel=\'$x$\', ylabel=\'$y$\', title=\'bar_title\') 25 ax3.legend() 26 27 fig.tight_layout() 28 fig.savefig(\'test_plot.png\', dpi=500) 29 30 plt.show() 31 plt.close()
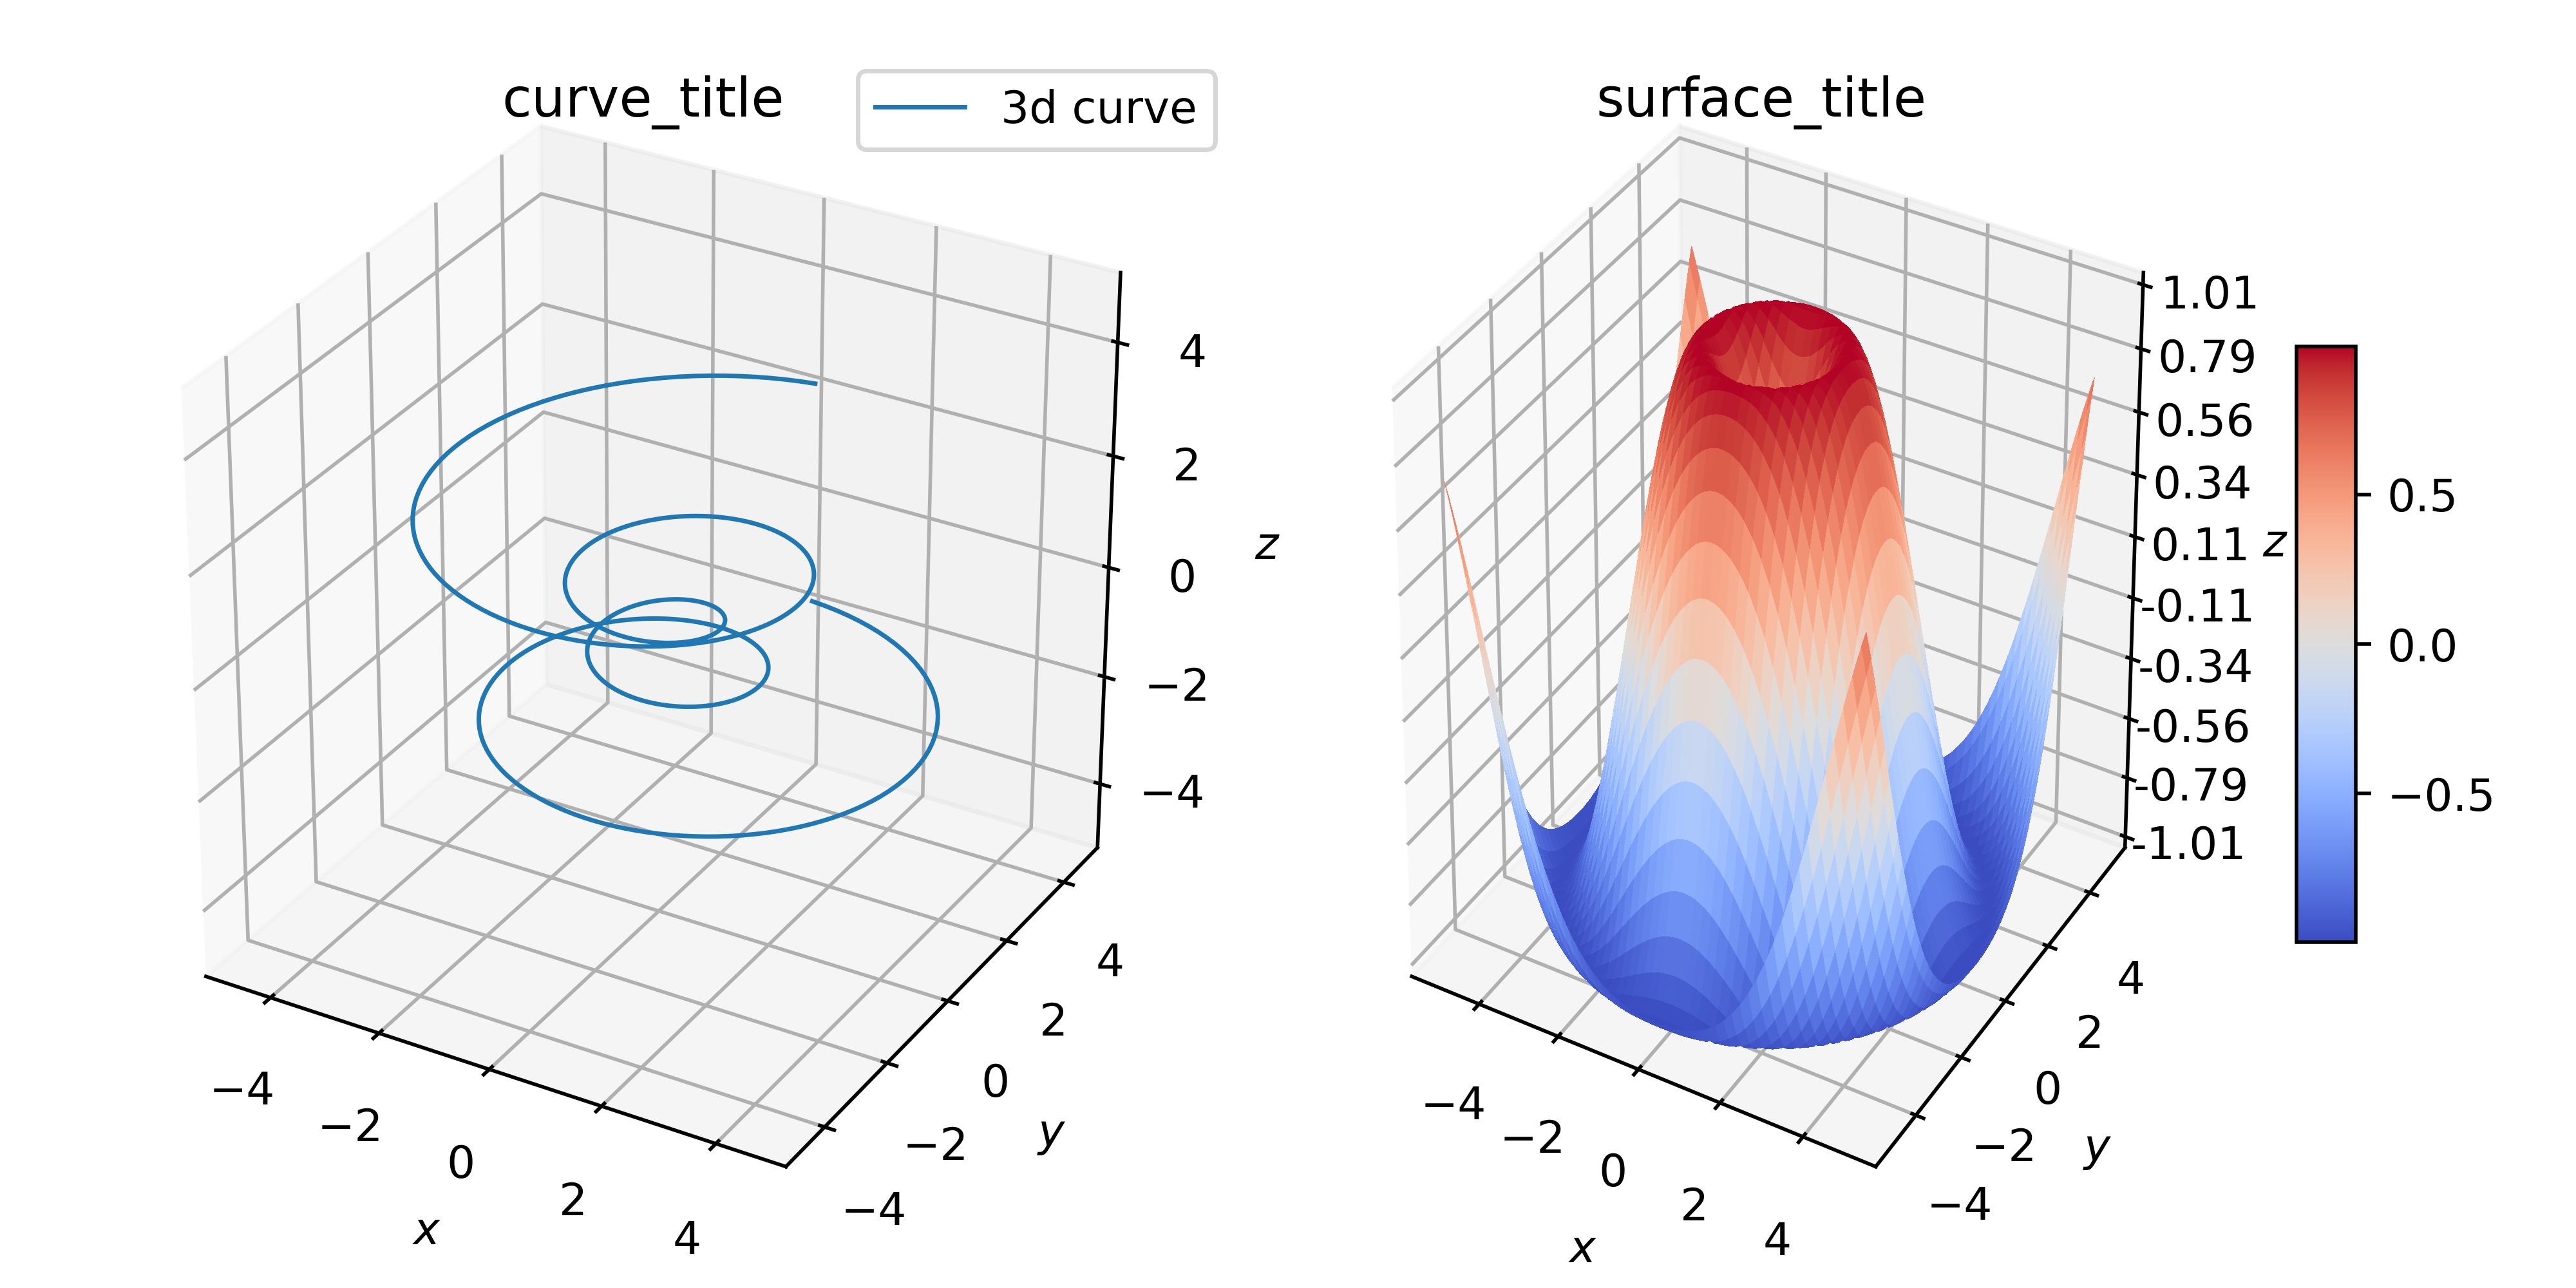
- 复杂作图 $\\rightarrow$ 3D类型示例:
View Code1 import numpy 2 import matplotlib.pyplot as plt 3 from matplotlib import cm 4 from matplotlib.ticker import LinearLocator, FormatStrFormatter 5 from mpl_toolkits.mplot3d import Axes3D # 该模块并未直接使用, 但必须导入, 否则无法识别下面的projection=\'3d\' 6 7 8 # 子图1的数据 - 一条曲线 9 theta = numpy.linspace(-4*numpy.pi, 4*numpy.pi, 500) 10 z1 = numpy.linspace(-2, 2, 500) 11 r = z1**2 + 1 12 x1 = r * numpy.sin(theta) 13 y1 = r * numpy.cos(theta) 14 15 # 子图2的数据 - 一个曲面 16 x2 = numpy.linspace(-5, 5, 100) 17 y2 = numpy.linspace(-5, 5, 100) 18 x2, y2 = numpy.meshgrid(x2, y2) # 生成网格 19 length = numpy.sqrt(x2**2 + y2**2) 20 z2 = numpy.sin(length) 21 22 # 创建图片对象 23 fig = plt.figure(figsize=(8, 4)) 24 25 # 创建子图对象 26 ax1 = plt.subplot(1, 2, 1, projection=\'3d\') # projection=\'3d\'标记该子图为3D子图 27 ax2 = plt.subplot(1, 2, 2, projection=\'3d\') 28 29 ax1.plot(x1, y1, z1, linewidth=1, label=\'3d curve\') 30 ax1.set(xlim=(-5, 5), ylim=(-5, 5), zlim=(-5, 5),xlabel=\'$x$\', ylabel=\'$y$\', zlabel=\'$z$\', title=\'curve_title\') 31 ax1.legend() 32 33 surf = ax2.plot_surface(x2, y2, z2, cmap=cm.coolwarm, antialiased=False) 34 ax2.set(zlim=(-1.01, 1.01), xlabel=\'$x$\', ylabel=\'$y$\', zlabel=\'$z$\', title=\'surface_title\') 35 # 设置子图内的轴对象 36 ax2.zaxis.set_major_locator(LinearLocator(10)) # z轴上的总刻度数 37 ax2.zaxis.set_major_formatter(FormatStrFormatter(\'%.02f\')) # z轴上刻度的格式 38 39 fig.colorbar(surf, shrink=0.5, aspect=10) # 展示颜色棒 40 41 fig.tight_layout() 42 fig.savefig(\'test_plot.png\', dpi=500) 43 44 plt.show() 45 plt.close()
- 参考:
https://matplotlib.org/api/_as_gen/matplotlib.pyplot.subplots.html#matplotlib.pyplot.subplots
https://matplotlib.org/api/_as_gen/matplotlib.axes.Axes.plot.html#matplotlib.axes.Axes.plot
https://matplotlib.org/tutorials/toolkits/mplot3d.html
以上是关于Python矩阵作图库matplotlib的初级使用的主要内容,如果未能解决你的问题,请参考以下文章