数据挖掘导论——可视化分析实验
Posted 上山打老虎D
tags:
篇首语:本文由小常识网(cha138.com)小编为大家整理,主要介绍了数据挖掘导论——可视化分析实验相关的知识,希望对你有一定的参考价值。
可视化分析实验
商店客流量数据可视化
数据来源
商店数据来自天池口碑商家客流量预测比赛,这里只筛选了一部分数据。“shop_payNum_new.csv”的数据各个字段的含义如下表所示:

实验要求:
参考案例一从以下任务中任选5个绘制不同图形的任务:
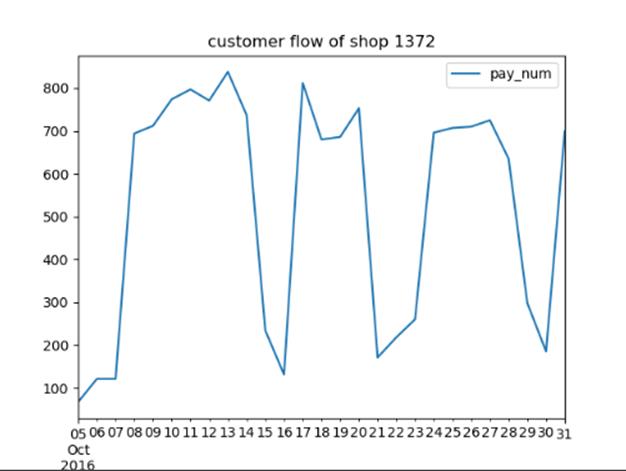
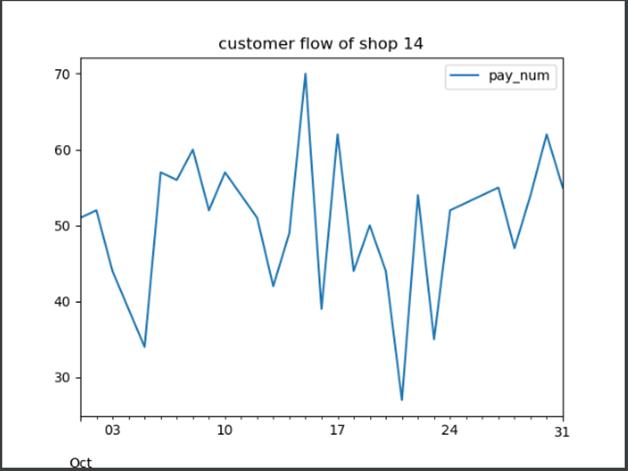
绘制所有便利店的10月的客流量折线图。
【代码】
import pandas as pd
import numpy as np
import matplotlib.pyplot as plt

data_total = pd.read_csv('dataset/shop_payNum_new.csv', parse_dates=True, index_col=0)

data = data_total.iloc[data_total.index.month == 10]
data_id = data.groupby('shop_id')
for key in data_id.groups.keys():
    data_id.get_group(key).plot(y=['pay_num'], title='customer flow of shop '+str(key))
plt.show()
【分析】
首先使用pandas.read_csv获取全部商铺数据。由于需要筛选10月的客流量折线图,则用iloc完成数据筛选,并利用shop_id进行groupby分组以获取各个商店的id键。对于每个键,依次用get_group获取对应商店的数据,并利用plot进行绘图。
【运行】
由于实际运行绘图比较多,故只展示一部分。
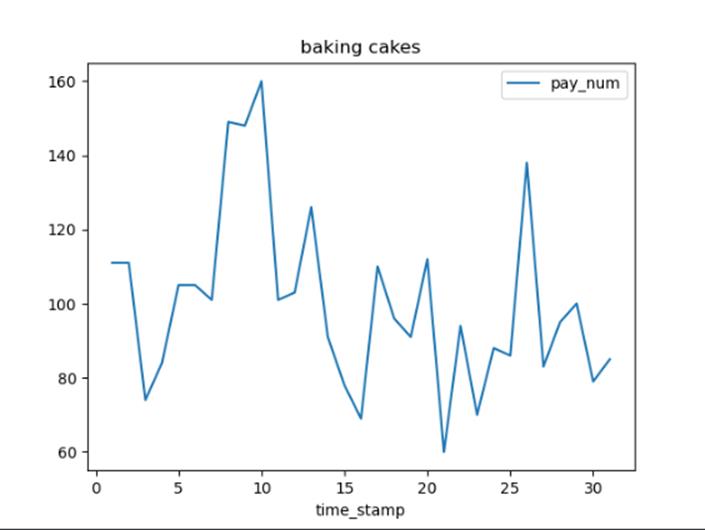
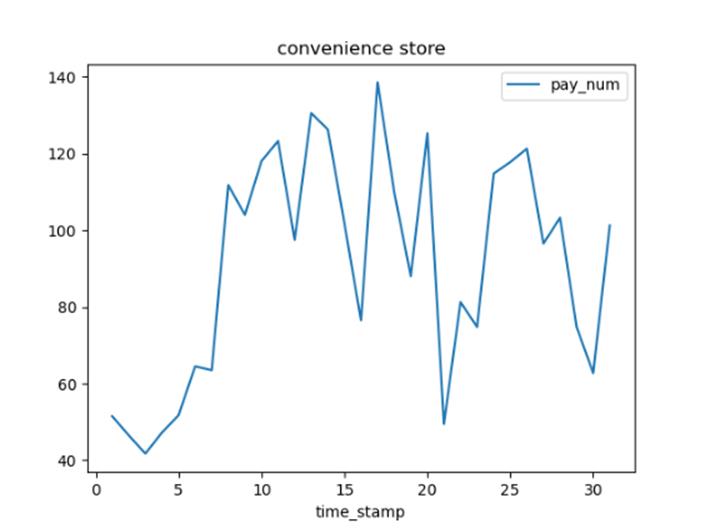
绘制每类商家10月份的日平均客流量折线图。
【代码】
import pandas as pd
import numpy as np
import matplotlib.pyplot as plt

data_total = pd.read_csv('dataset/shop_payNum_new.csv', parse_dates=True, index_col=0)

data = data_total.iloc[data_total.index.month == 10]
data_id = data.groupby('cate_2_name')
for keys in data_id.groups.keys():
    data_id.get_group(keys).groupby(data_id.get_group(keys).index.day).mean().plot(y=['pay_num'], kind='line', title=keys)
plt.show()
【分析】
首先使用pandas.read_csv获取全部商铺数据。由于需要筛选每类商家10月份的日平均客流量折线图。使用iloc对数据进行过滤,筛选出每个商家10月份的数据。利用groupby对销售数据进行分组并获取每组的键值。利用循环遍历每个键,再获取日期并对日期取平均值,最后利用plot生成折线图。
【运行】
部分结果展示如下
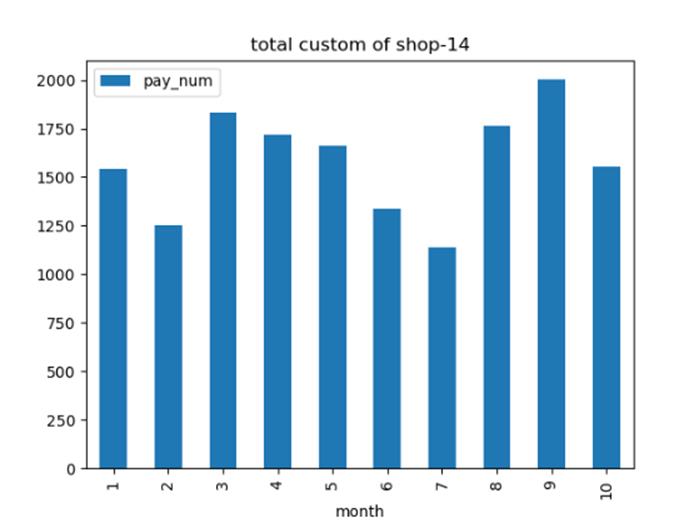
选择一个商家,统计每月的总客流量,绘制柱状图。
【代码】
import pandas as pd
import numpy as np
import matplotlib.pyplot as plt

data_total = pd.read_csv('dataset/shop_payNum_new.csv', parse_dates=True, index_col=0)

data_14 = data_total[data_total['shop_id'] == 14]
data_14_id = data_14.groupby(data_14.index.month).sum()
data_14_id.plot(kind='bar', y=['pay_num'], title='total custom of shop-14')
plt.xlabel('month')
plt.show()
【分析】
首先使用pandas.read_csv获取全部商铺数据。由于需要筛选单个商家各个月份的总客流量。首先对数据进行过滤筛选,筛选出shop_id为14的数据。利用groupby结合sum函数进行分组求和,最后设置kind为柱状图并生成绘图即可。
【运行】
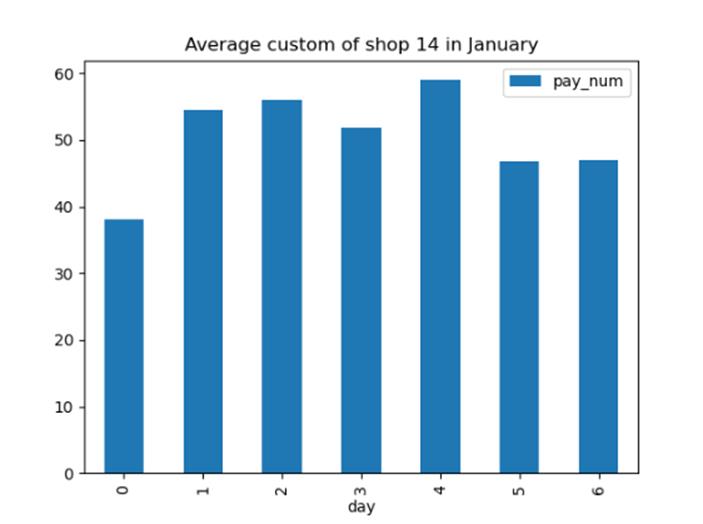
选择一个商家,统计某个月中,周一到周日的每天平均客流量,并绘制柱状图。
import pandas as pd
import numpy as np
import matplotlib.pyplot as plt
import time

data_total = pd.read_csv('dataset/shop_payNum_new.csv', parse_dates=True, index_col=0)

data_14 = data_total[(data_total['shop_id'] == 14) & (data_total.index.month == 1)]
data_14_id = data_14.groupby(data_14.index.strftime('%w'))
data_14_id.mean().plot(y=['pay_num'], kind='bar', title='Average custom of shop 14 in January')
plt.xlabel('day')
plt.show()
【分析】
首先使用pandas.read_csv获取全部商铺数据。由于需要筛选单个商家单个月份的平均客流量。首先对数据进行过滤筛选,筛选出shop_id为14,且在1月份的数据。利用groupby结合strftime函数利用日期进行分组求平均值,最后直接绘图为柱状图即可。
【运行】
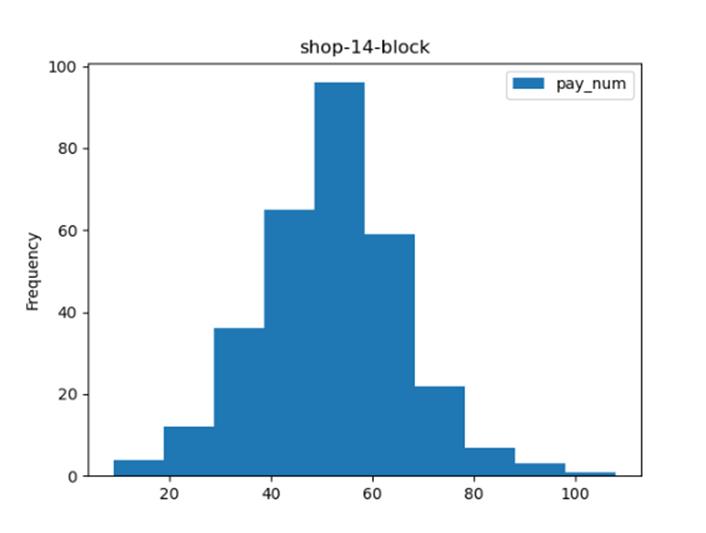
选择一个商家,绘制客流量直方图。
【代码】
import pandas as pd
import numpy as np
import matplotlib.pyplot as plt

data_total = pd.read_csv('dataset/shop_payNum_new.csv', parse_dates=True, index_col=0)

data_14 = data_total[data_total['shop_id'] == 14]
data_14.plot(kind='hist', y=['pay_num'], title='shop-14-block')
plt.show()
【分析】
首先使用pandas.read_csv读取全部商铺数据,然后根据shop_id,对所有数据进行筛选。筛选出对应店铺的数据后直接使用plot进行绘图,并选择样式为’hist’柱状图即可。
【运行】
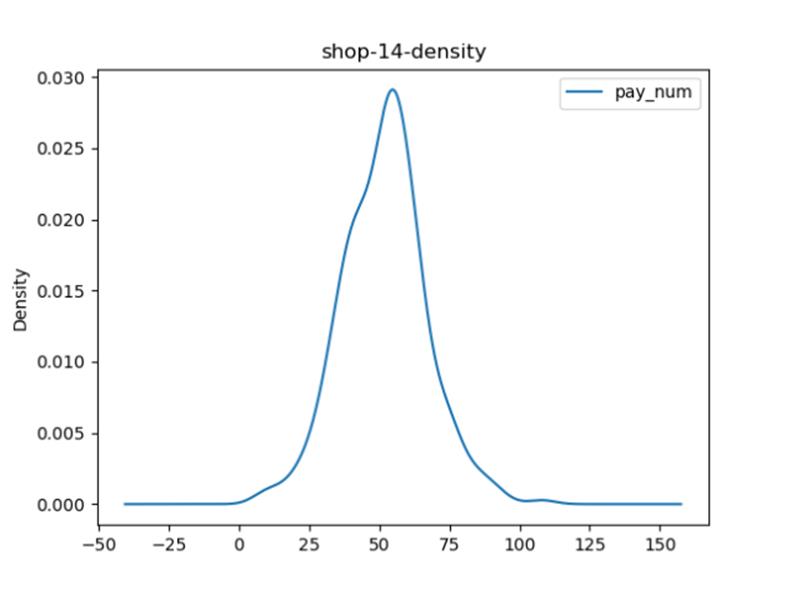
选择一个商家,绘制客流量密度图。
【代码】
import pandas as pd
import numpy as np
import matplotlib.pyplot as plt

data_total = pd.read_csv('dataset/shop_payNum_new.csv', parse_dates=True, index_col=0)

data_14 = data_total[data_total['shop_id'] == 14]
data_14.plot(kind='kde', y=['pay_num'], title='shop-14-density')
plt.show()
【分析】
首先使用pandas.read_csv读取全部商铺数据,然后根据shop_id,对所有数据进行筛选。筛选出对应店铺的数据后直接使用plot进行绘图,并选择样式为’kde’密度分布图即可。
【运行】
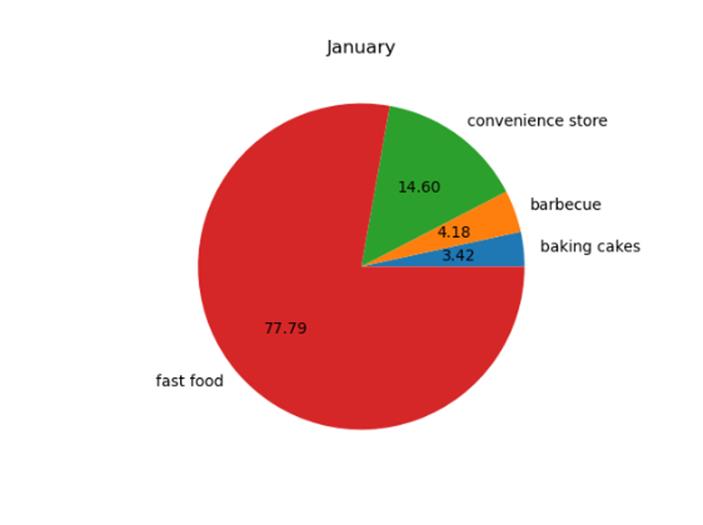
统计某个月各个类别商店总客流量占该月总客流量的比例,绘制饼图。
【代码】
import pandas as pd
import numpy as np
import matplotlib.pyplot as plt

data_total = pd.read_csv('dataset/shop_payNum_new.csv', parse_dates=True, index_col=0)

data_month1 = data_total[data_total.index.month == 1]
data_month1_rate = data_month1.groupby('cate_2_name').sum() / data_month1['pay_num'].sum()
data_month1_rate['pay_num'].plot(kind='pie', autopct='%.2f')
plt.ylabel('')
plt.title('January')
plt.show()
【分析】
首先使用pandas.read_csv读取全部商铺数据,然后根据1月,对所有数据进行筛选。然后使用groupby和sum对各个类别客流量进行分组求和,使用sum对全部客流量进行求和。两结果做比的结果即为所占比例。最后根据所占比例作饼状图即可。
【运行】
皮马印第安人糖尿病数据可视化
数据来源:http://archive.ics.uci.edu/ml/datasets/Pima+Indians+Diabetes。“pima.csv”数据前9个字段的含义:
(1)Number of times pregnant
(2)Plasma glucose concentration a 2 hours in an oral glucosetolerancetest
(3)Diastolic blood pressure (mm Hg)
(4)Triceps skin fold thickness (mm)
(5)2-Hour serum insulin (mu U/ml)
(6)Body mass index (weight in kg/(height in m)^2)
(7)Diabetes pedigree function
(8)Age (years)
(9)Class variable (0 or 1)
实验要求:
参考案例二完成以下任务:
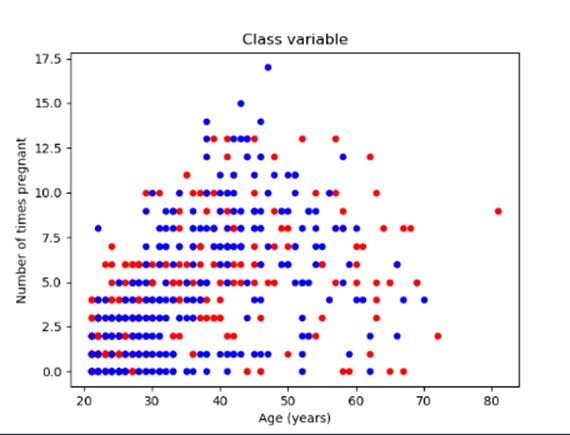
任选两个字段绘制散点图。
【代码】
import pandas as pd
import numpy as np
import matplotlib.pyplot as plt

close_px_all = pd.read_csv('dataset/pima.csv', parse_dates=True, index_col=None, header=None)
close_px_all.columns = ['Number of times pregnant',
                        'Plasma glucose concentration a 2 hours in an oral glucosetolerancetest',
                        'Diastolic blood pressure (mm Hg)', 'Triceps skin fold thickness (mm)',
                        '2-Hour serum insulin (mu U/ml)', 'Body mass index', 'Diabetes pedigree function',
                        'Age (years)', 'Class variable']
# print(close_px_all.head())

# # 任选两个字段绘制散点图
pregnant_age = close_px_all[['Number of times pregnant', 'Age (years)', 'Class variable']]
ax = pregnant_age[pregnant_age['Class variable'] == 0].plot(kind='scatter', y='Number of times pregnant', c='red',
                                                            x='Age (years)', title='Number of times pregnant-Age',
                                                            ax=None)
pregnant_age[pregnant_age['Class variable'] == 1].plot(kind='scatter', y='Number of times pregnant', c='blue',
                                                       x='Age (years)', title='Number of times pregnant-Age', ax=ax)
plt.show()
【分析】
首先通过pandas.read_csv读入数据,然后给各个列命名,方便处理。由于要展示Number of times pregnant与Age的关系通过筛选数据仅保留这两列即可。然后使用plot对数据进行可视化绘图,选择kind为’scatter’并规定横纵坐标即可。
【运行】
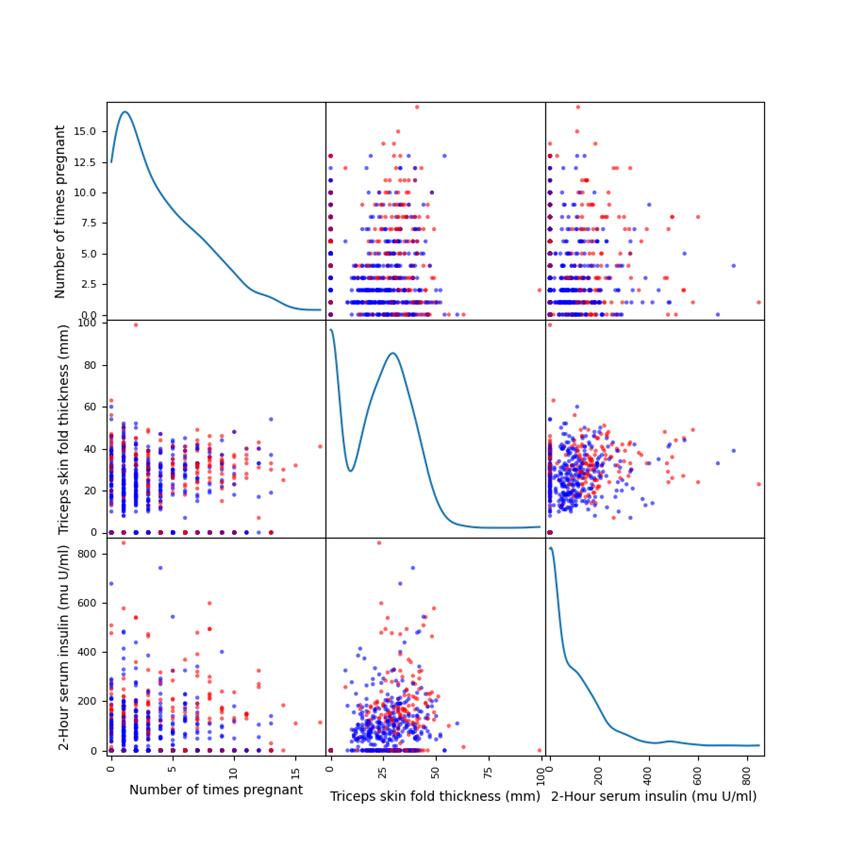
使用全部或者部分特征绘制散布图。
【代码】
import pandas as pd
import numpy as np
import matplotlib.pyplot as plt

close_px_all = pd.read_csv('dataset/pima.csv', parse_dates=True, index_col=None, header=None)
close_px_all.columns = ['Number of times pregnant',
                        'Plasma glucose concentration a 2 hours in an oral glucosetolerancetest',
                        'Diastolic blood pressure (mm Hg)', 'Triceps skin fold thickness (mm)',
                        '2-Hour serum insulin (mu U/ml)', 'Body mass index', 'Diabetes pedigree function',
                        'Age (years)', 'Class variable']

# 使用全部或者部分特征绘制散布图
color = 1: 'red', 0: 'blue'
pd.plotting.scatter_matrix(close_px_all.iloc[:, [0, 3, 4]], figsize=(9, 9), diagonal='kde', s=40, alpha=0.6,
                           c=close_px_all['Class variable'].apply(lambda x: color[x]))
plt.show()
【分析】
选取了Number of times pregnant,Triceps skin fold thickness和2-Hour serum insulin对class variable进行特征分析绘制散布图。首先通过pandas.read_csv读入数据,然后给各个列命名,方便处理。利用scatter对第0列,第3列和第4列进行分析,并绘图显示散布图。
【运行】
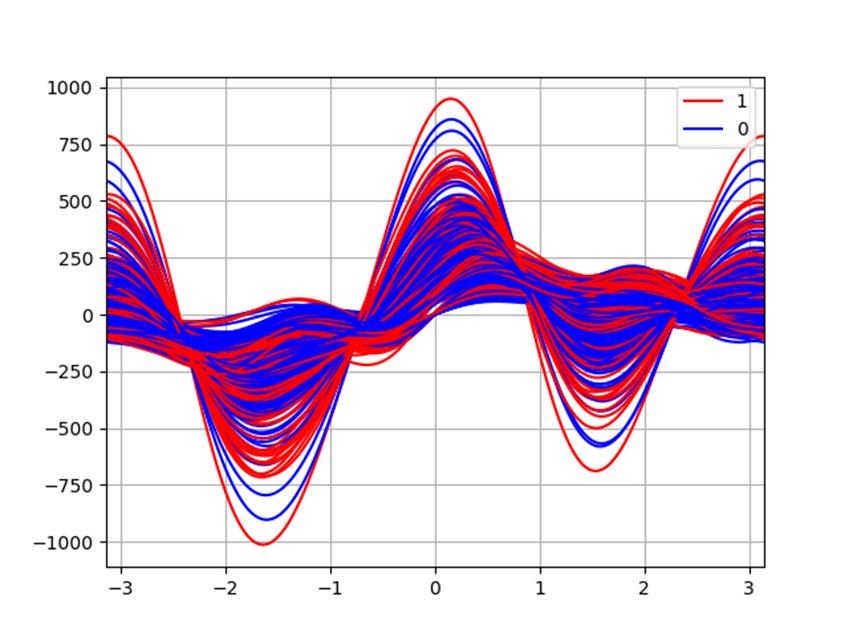
绘制调和曲线图。
import pandas as pd
import numpy as np
import matplotlib.pyplot as plt

close_px_all = pd.read_csv('dataset/pima.csv', parse_dates=True, index_col=None, header=None)
close_px_all.columns = ['Number of times pregnant',
                        'Plasma glucose concentration a 2 hours in an oral glucosetolerancetest',
                        'Diastolic blood pressure (mm Hg)', 'Triceps skin fold thickness (mm)',
                        '2-Hour serum insulin (mu U/ml)', 'Body mass index', 'Diabetes pedigree function',
                        'Age (years)', 'Class variable']

# 绘制调和曲线图
pd.plotting.andrews_curves(close_px_all, 'Class variable', color=['red', 'blue'])
plt.show()
【分析】
首先通过pandas.read_csv读入数据,然后给各个列命名,方便处理。直接调用函数进行绘图即可。
【运行】
以上是关于数据挖掘导论——可视化分析实验的主要内容,如果未能解决你的问题,请参考以下文章