30张炫酷的动态交互式图表,Python 一键即可生成
Posted Python学习与数据挖掘
tags:
篇首语:本文由小常识网(cha138.com)小编为大家整理,主要介绍了30张炫酷的动态交互式图表,Python 一键即可生成相关的知识,希望对你有一定的参考价值。
今天我来讲一下如何用 Python 一行代码在DataFrame数据集当中生成炫酷的动态交互式的图表,本文中我们需要用到的模块cufflinks ,就像是seaborn封装了matplotlib一样,cufflinks也在plotly上面做了进一步的包装及优化,方法统一、参数配置简单,对于DataFrame数据集而言也可以方便灵活的绘图。
本文案例较多,很多可以拿来即用,欢迎收藏学习,喜欢点赞支持。很多基础薄弱、喜欢技术交流学习的小伙伴,可以文末加入技术交流群。
本文中我将绘制的图表包括
-
折线图
-
面积图
-
散点图
-
柱状图
-
直方图
-
箱型图
-
热力图
-
3D 散点图/3D 气泡图
-
趋势图
-
饼图
-
K线图
-
多个子图相拼合
模块的安装
涉及到安装,直接pip install即可
pip install cufflinks
导入模块,并查看相关的配置
我们导入该模块,看一下目前的版本是在多少
cf.__version__
output
'0.17.3'
目前该模块的版本已经到了0.17.3,也是最新的版本,然后我们最新版本支持可以绘制的图表有哪些
cf.help()
output
Use 'cufflinks.help(figure)' to see the list of available parameters for the given figure.
Use 'DataFrame.iplot(kind=figure)' to plot the respective figure
Figures:
 bar
 box
 bubble
 bubble3d
 candle
 choroplet
 distplot
 .......
从上面的输出我们可以看到,绘制图表大致的语法是df.iplot(kind=图表名称)而如何我们想要查看某个特定图表绘制时候的参数,例如柱状图bar参数有哪些,可以这么做
cf.help('bar')
柱状图
我们先来看一下直方图图表的绘制,首先来创建一个数据集用于图表的绘制
df2 = pd.DataFrame('Category':['A','B','C','D'],
                    'Values':[95,56,70,85])
df2
output
  Category  Values
0        A      95
1        B      56
2        C      70
3        D      85
然后我们来绘制直方图
df2.iplot(kind='bar',x='Category',y='Values',
          xTitle = "Category",yTitle = "Values",
          title = "直方图")
output

其中的x参数上面填的是x轴上面对应的变量名,而y参数填的是y轴上面对应的变量名,我们可以将绘制的图表以png的格式下载下来,
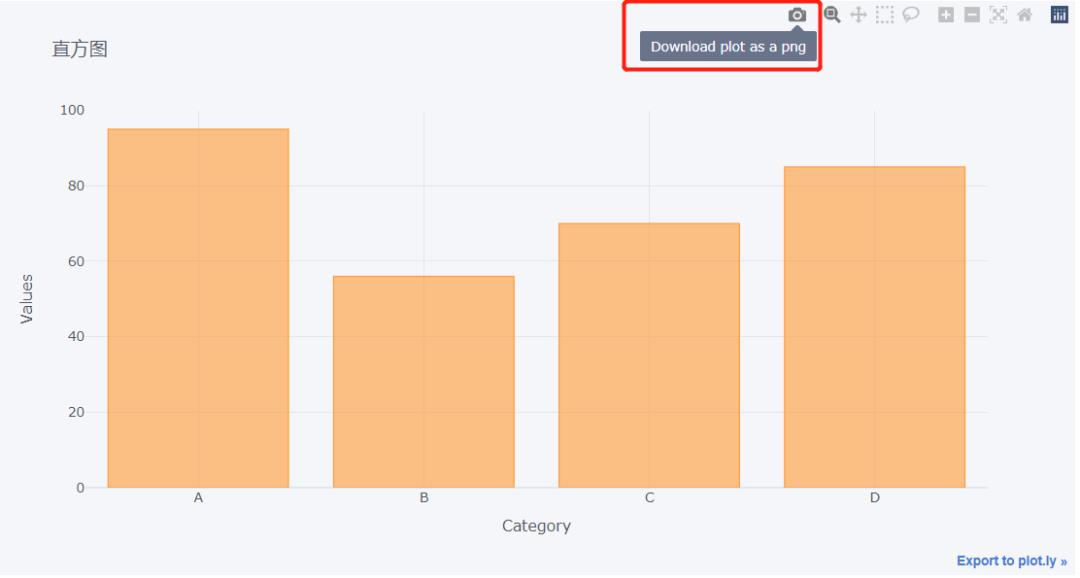
同时我们也还可以对绘制的图表放大查看,
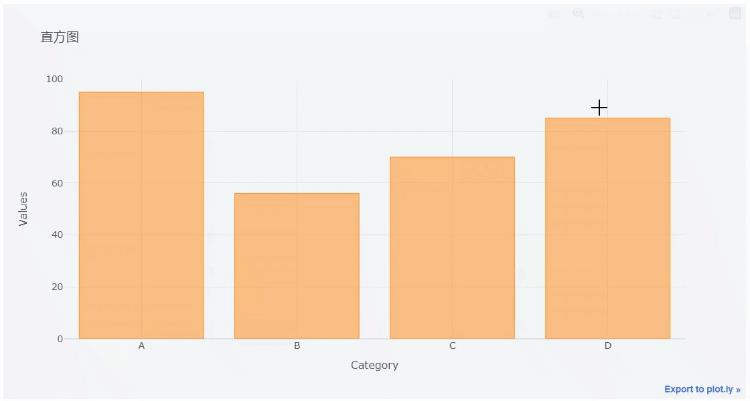
我们再来看一下下面这组数据
df = pd.DataFrame(np.random.randn(100,4),columns='A B C D'.split())
df.head()
output
          A         B         C         D
0  0.612403 -0.029236 -0.595502  0.027722
1  1.167609  1.528045 -0.498168 -0.221060
2 -1.338883 -0.732692  0.935410  0.338740
3  1.662209  0.269750 -1.026117 -0.858472
4  1.387077 -0.839192 -0.562382 -0.989672
我们来绘制直方图的图表
df.head(10).iplot('bar')
output
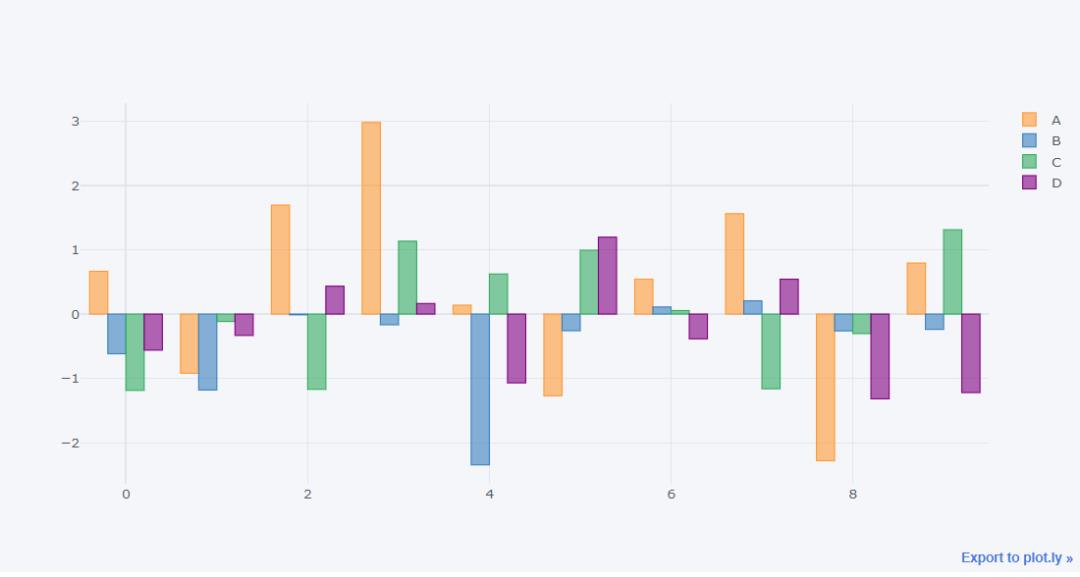
我们也可以来绘制“堆叠式”的直方图
df.head(10).iplot(kind='bar',barmode='stack')
output
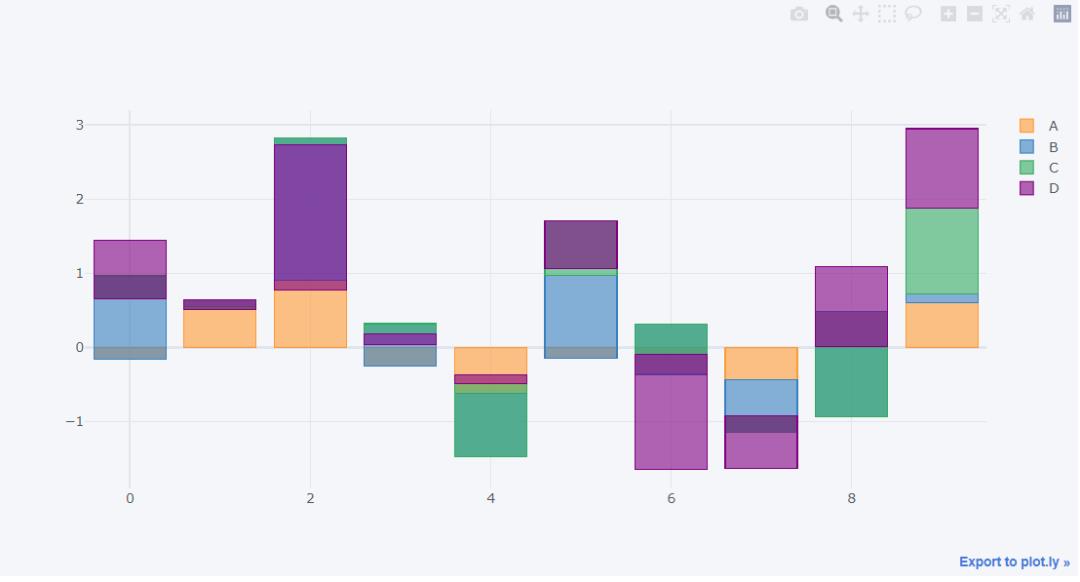
那么同样地,我们也可以将直方图横过来来绘制
df.head(10).iplot(kind='barh',barmode='stack')
output
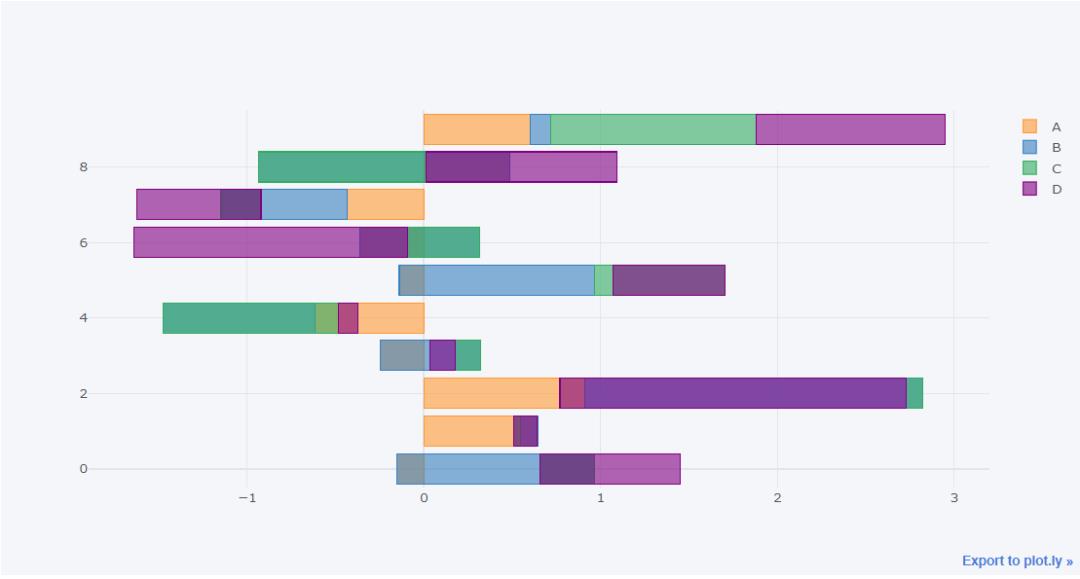
折线图
下面我们来看一下折线图的绘制,我们首先针对上面的df数据集各列做一个累加
df3 = df.cumsum()
然后我们来绘制折线图
df3.iplot()
output

当然你也可以筛选出当中的几列然后来进行绘制,效果如下
df3[["A", "B"]].iplot()
output
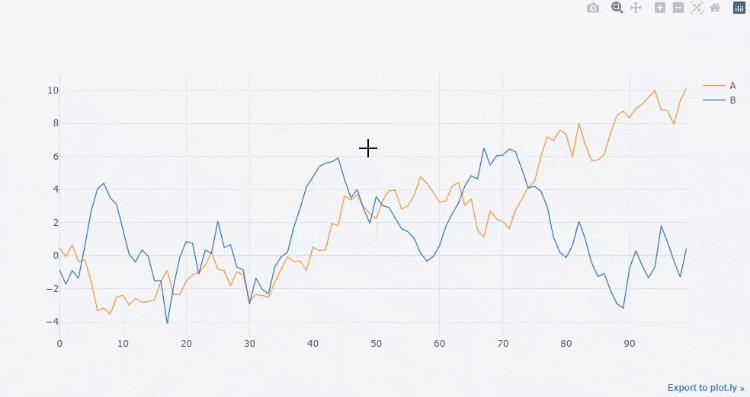
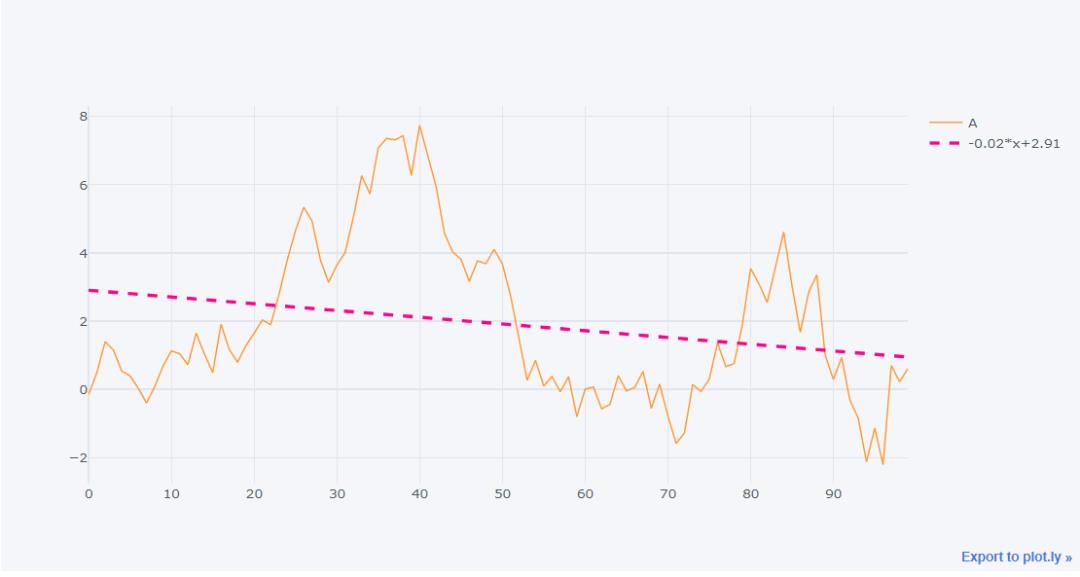
我们也可以给折线图画一条拟合其走势的直线,
df3['A'].iplot(bestfit = True,bestfit_colors=['pink'])
output
这里我们着重来介绍一个iplot()方法里面常用的参数
-
kind:图表类型,默认的是scatter,散点类型,可供选择的类型还有bar(直方图)、box(箱型图)、heatmap(热力图)等等 -
theme: 布局主题,可以通过cf.getThemes()来查看主要有哪些 -
title: 图表的标题 -
xTitle/yTitle: x或者y轴上面的轴名 -
colors: 绘制图表时候的颜色 -
subplots: 布尔值,绘制子图时候需要用到,默认为False -
mode:字符串,绘图的模式,可以有lines、markers,也还有lines+markers和lines+text等模式 -
size: 针对于散点图而言,主要用来调整散点的大小 -
shape: 在绘制子图时候各个图的布局 -
bargap: 直方图当中柱子之间的距离 -
barmode: 直方图的形态,stack(堆叠式)、group(簇状)、overlay(覆盖)
面积图
从折线图到面积图的转变非常的简单,只需要将参数fill设置为True即可,代码如下
df3.iplot(fill = True)
output

散点图
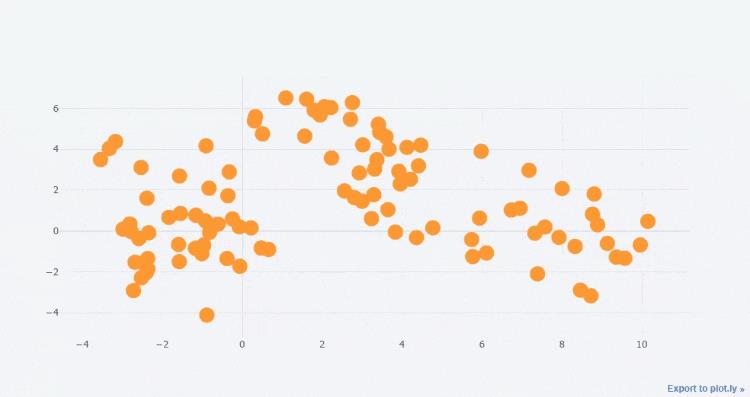
对于散点图的绘制,我们需要将mode设置成marker,代码如下
df3.iplot(kind='scatter',x='A',y='B',
          mode='markers',size=10)
output
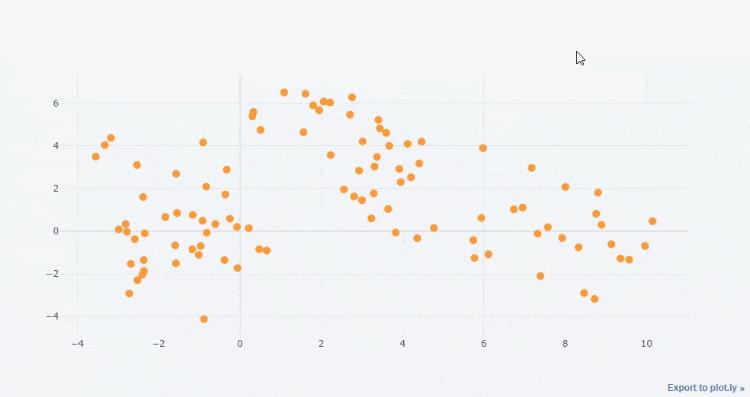
我们可以通过调整size参数来调整散点的大小,例如我们将size调整成20
df3.iplot(kind='scatter',x='A',y='B',
          mode='markers',size=20)
output
或者将mode设置成lines+markers,代码如下
df3.iplot(kind='scatter',x='A',y='B',
          mode='lines + markers',size=10)
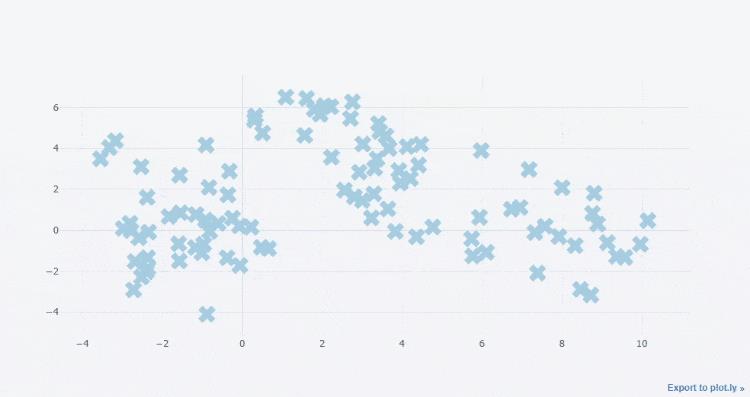
我们还可以对散点的形状加以设定,例如下面的代码
df3.iplot(kind='scatter',x='A',y='B',
          mode='markers',size=20,symbol="x",
          colorscale='paired',)
output
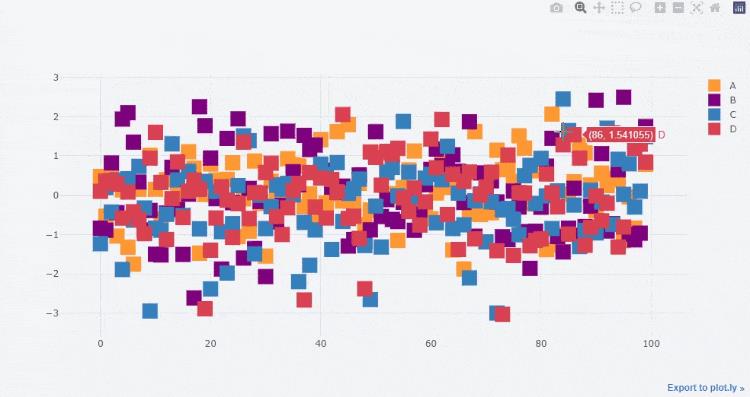
当然我们也可以对散点的颜色加以设定
df.iplot(kind='scatter' ,mode='markers',
         symbol='square',colors=['orange','purple','blue','red'],
         size=20)
output
气泡图
气泡图的呈现方式与散点图相比有着异曲同工之妙,在绘制上面将kind参数改成bubble,假设我们有这样一组数据
cf.datagen.bubble(prefix='industry').head()
output
          x         y  size    text categories
0  0.332274  1.053811     2  LCN.CG  industry1
1 -0.856835  0.422373    87  ZKY.XC  industry1
2 -0.818344 -0.167020    72  ZSJ.DJ  industry1
3 -0.720254  0.458264    11  ONG.SM  industry1
4 -0.004744  0.644006    40  HUW.DN  industry1
我们来绘制一下气泡图
cf.datagen.bubble(prefix='industry').iplot(kind='bubble',x='x',y='y',size='size',
       categories='categories',text='text', xTitle='Returns',
       yTitle='Analyst Score',title='Cufflinks - 气泡图')
output
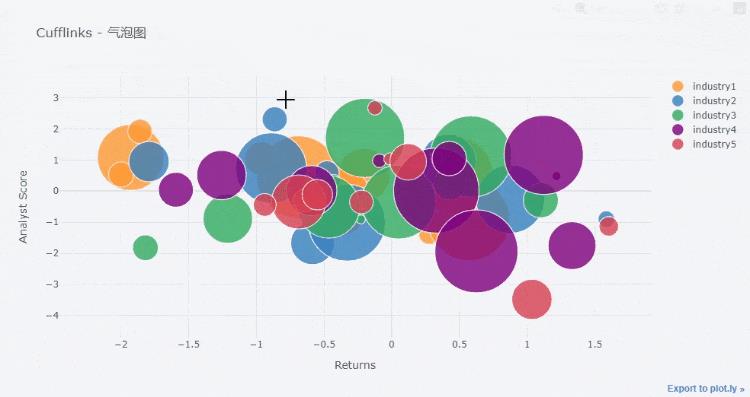
气泡图与散点图的不同就在于,散点图当中的每个点大小都是一致的,但是气泡图并不是如此
3D散点图
那既然我们已经提到了气泡图,那么3D散点图也就顺便提一下吧,假设我们的数据如下所示
cf.datagen.scatter3d(2,150).head()
output
          x         y         z    text categories
0  0.375359 -0.683845 -0.960599  RER.JD  category1
1  0.635806  1.210649  0.319687  INM.LE  category1
2  0.578831  0.103654  1.333646  BSZ.HS  category1
3 -1.128907 -1.189098  1.531494  GJZ.UX  category1
4  0.067668 -1.990996  0.088281  IQZ.KS  category1
我们来绘制一下3D的气泡图,既然是三维的图形就说明有x轴、y轴还有z轴,代码如下
cf.datagen.scatter3d(2,150).iplot(kind='scatter3d',x='x',y='y',z='z',size=15,
                                  categories='categories',text='text',
                                  title='Cufflinks - 3D气泡图',colors=['yellow','purple'],
                                  width=1,margin=(0,0,0,0),
                                  opacity=1)
output
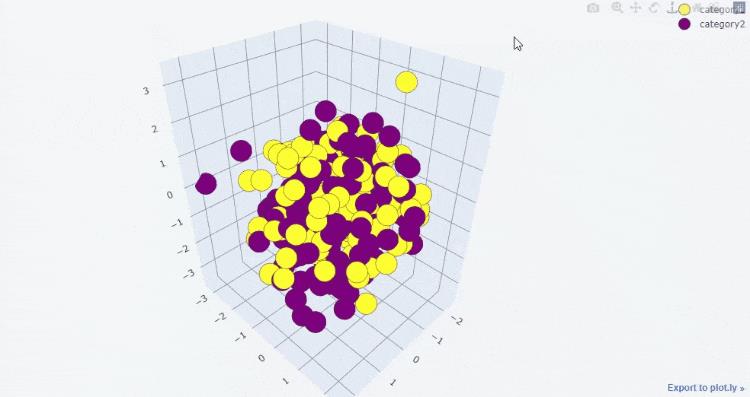
3D气泡图
那么提到了3D散点图,就不得不提3D的气泡图了,假设我们的数据集长这样
cf.datagen.bubble3d(5,4).head()
output
          x         y         z  size    text categories
0 -1.888528  0.801430 -0.493671    77  OKC.HL  category1
1 -0.744953 -0.004398 -1.249949    61  GAG.UH  category1
2  0.980846  1.241730 -0.741482    37  LVB.EM  category1
3 -0.230157  0.427072  0.007010    78  NWZ.MG  category1
4  0.025272 -0.424051 -0.602937    76  JDW.AX  category2
我们来绘制一下3D的气泡图
cf.datagen.bubble3d(5,4).iplot(kind='bubble3d',x='x',y='y',z='z',size='size',
                               text='text',categories='categories',
                               title='Cufflinks - 3D气泡图',colorscale='set1',
                               width=.9,opacity=0.9)
output
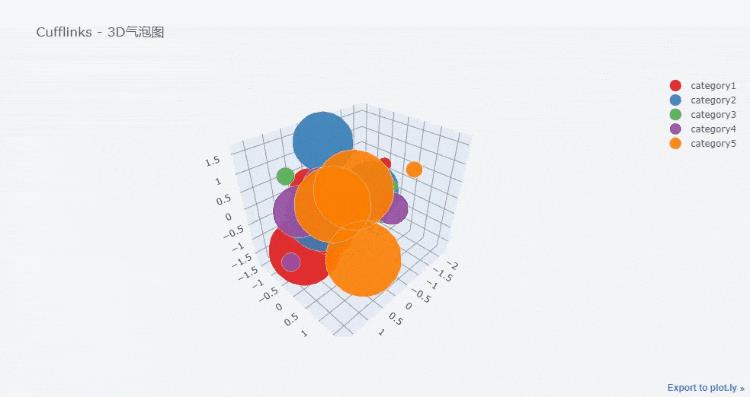
箱型图
接下来我们看一下箱型图的绘制,箱型图对于我们来观察数据的分布、是否存在极值等情况有着很大的帮助
df.iplot(kind = "box")
output
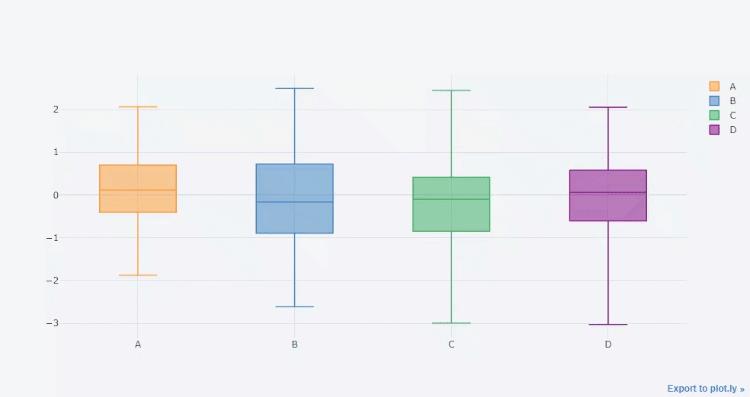
热力图
这个是热力图的绘制,我们来看一下数据集
cf.datagen.heatmap(20,20).head()
output
           y_0        y_1        y_2  ...       y_17       y_18       y_19
x_0  40.000000  58.195525  55.355233  ...  77.318287  80.187609  78.959951
x_1  37.111934  25.068114  25.730511  ...  27.261941  32.303315  28.550340
x_2  54.881357  54.254479  59.434281  ...  75.894161  74.051203  72.896999
x_3  41.337221  39.319033  37.916613  ...  15.885289  29.404226  26.278611
x_4  42.862472  36.365226  37.959368  ...  24.998608  25.096598  32.413760
我们来绘制一下热力图,代码如下
cf.datagen.heatmap(20,20).iplot(kind='heatmap',colorscale='spectral',title='Cufflinks - 热力图')
output
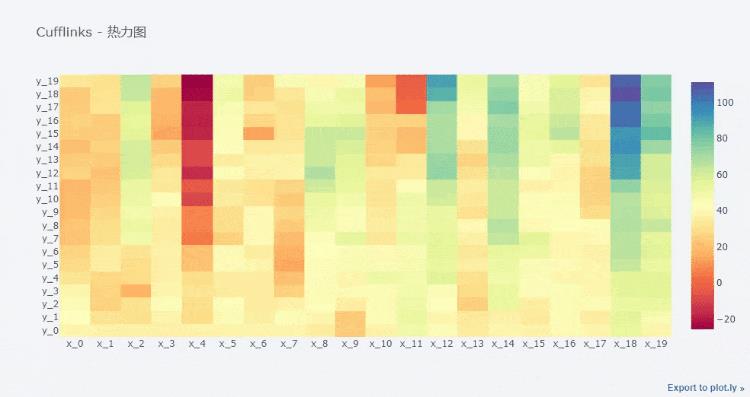
趋势图
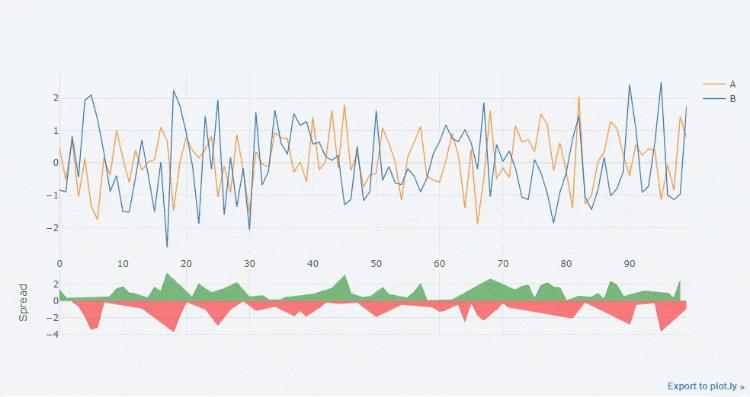
所谓的趋势图,说白了就是折线图和面积图两者的结合,代码如下
df[["A", "B"]].iplot(kind = 'spread')
output
饼图
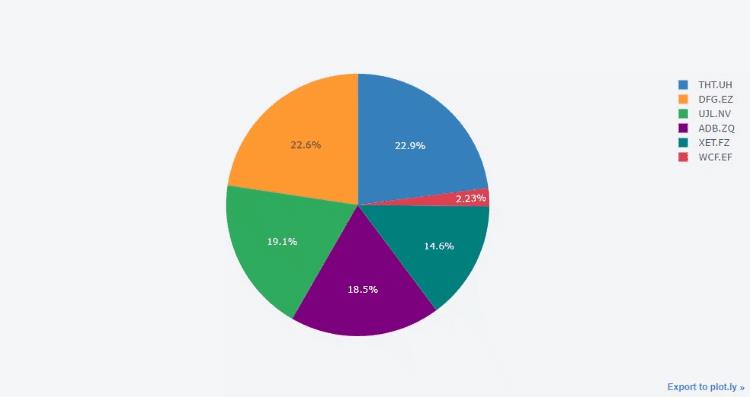
下面我们来看一下饼图的绘制,代码如下
cf.datagen.pie(n_labels=6, mode = "stocks").iplot(
    kind = "pie",
    labels = "labels",
    values = "values")
output
K线图
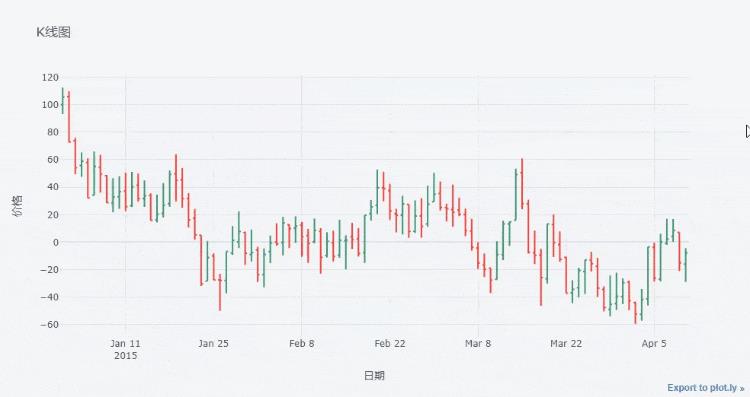
cufflinks也可以用来绘制K线图,我们来看一下这里的数据集
cf.datagen.ohlc().head()
output
                  open        high         low       close
2015-01-01  100.000000  119.144561   97.305961  106.125985
2015-01-02  106.131897  118.814224   96.740816  115.124342
2015-01-03  116.091647  131.477558  115.801048  126.913591
2015-01-04  128.589287  144.116844  117.837221  136.332657
2015-01-05  134.809052  138.681252  118.273850  120.252828
从上面的数据集当中可以看到,有开盘价、收盘价、最高/最低价,然后我们来绘制K线图
cf.datagen.ohlc().iplot(kind = "ohlc",xTitle = "日期",
                        yTitle="价格",title = "K线图")
output
直方图
df = pd.DataFrame('a': np.random.randn(1000) + 1, 'b': np.random.randn(1000),
                    'c': np.random.randn(1000) - 1, columns=['a', 'b', 'c'])
df.iplot(kind = "histogram")
output

多个子图的绘制
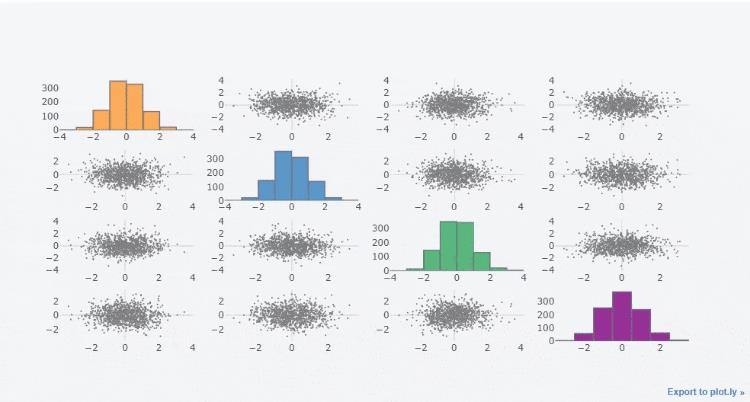
然后我们看一下多个子图的绘制,一个是用scatter_matrix()方法来实现
df = pd.DataFrame(np.random.randn(1000, 4),
                  columns=['a', 'b', 'c', 'd'])
df.scatter_matrix()
output
另外就是使用subplots参数,将其参数设置为True,例如我们来绘制多个直方图子图
df_h=cf.datagen.histogram(4)
df_h.iplot(kind='histogram',subplots=True,bins=50)
output

或者是绘制多个折线图子图
df=cf.datagen.lines(4)
df.iplot(subplots=True,subplot_titles=True,legend=True)
output
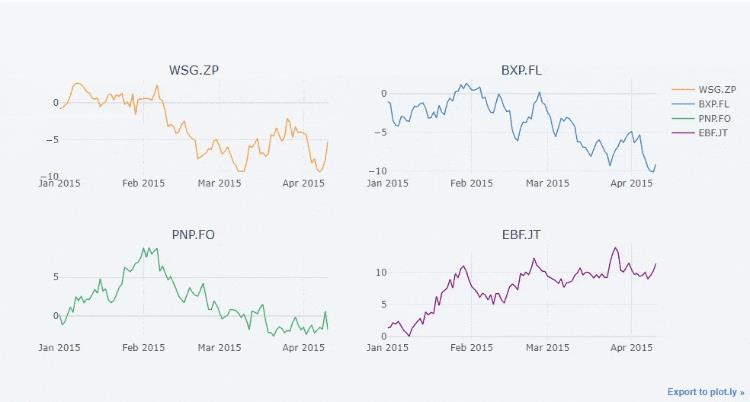
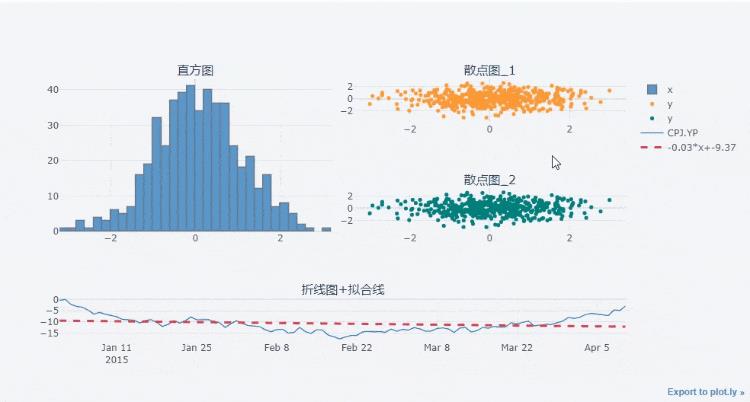
最后我们还可以自由来组合多个子图的绘制,通过里面的specs参数
df=cf.datagen.bubble(10,50,mode='stocks')
# 定义要绘制图表的形式
figs=cf.figures(df,[dict(kind='histogram',keys='x',color='blue'),
                    dict(kind='scatter',mode='markers',x='x',y='y',size=5),
                    dict(kind='scatter',mode='markers',x='x',y='y',size=5,color='teal')],asList=True)
figs.append(cf.datagen.lines(1).figure(bestfit=True,colors=['blue'],bestfit_colors=['red']))
base_layout=cf.tools.get_base_layout(figs)
# 多个子图如何来分布,specs参数当中,分为两行两列来进行分布
specs=cf.subplots(figs,shape=(3,2),base_layout=base_layout,vertical_spacing=.25,horizontal_spacing=.04,
               specs=[['rowspan':2,],[None,],['colspan':2,None]],
               subplot_titles=['直方图','散点图_1','散点图_2','折线图+拟合线'])
specs['layout'].update(showlegend=True)
cf.iplot(specs)
output
技术交流
欢迎转载、收藏、有所收获点赞支持一下!

目前开通了技术交流群,群友已超过2000人,添加时最好的备注方式为:来源+兴趣方向,方便找到志同道合的朋友
- 方式①、发送如下图片至微信,长按识别,后台回复:加群;
- 方式②、添加微信号:dkl88191,备注:来自CSDN
- 方式③、微信搜索公众号:Python学习与数据挖掘,后台回复:加群

以上是关于30张炫酷的动态交互式图表,Python 一键即可生成的主要内容,如果未能解决你的问题,请参考以下文章