Removed k rows containing missing values
Posted Data+Science+Insight
tags:
篇首语:本文由小常识网(cha138.com)小编为大家整理,主要介绍了Removed k rows containing missing values相关的知识,希望对你有一定的参考价值。
Removed k rows containing missing values
目录
Removed k rows containing missing values
问题:
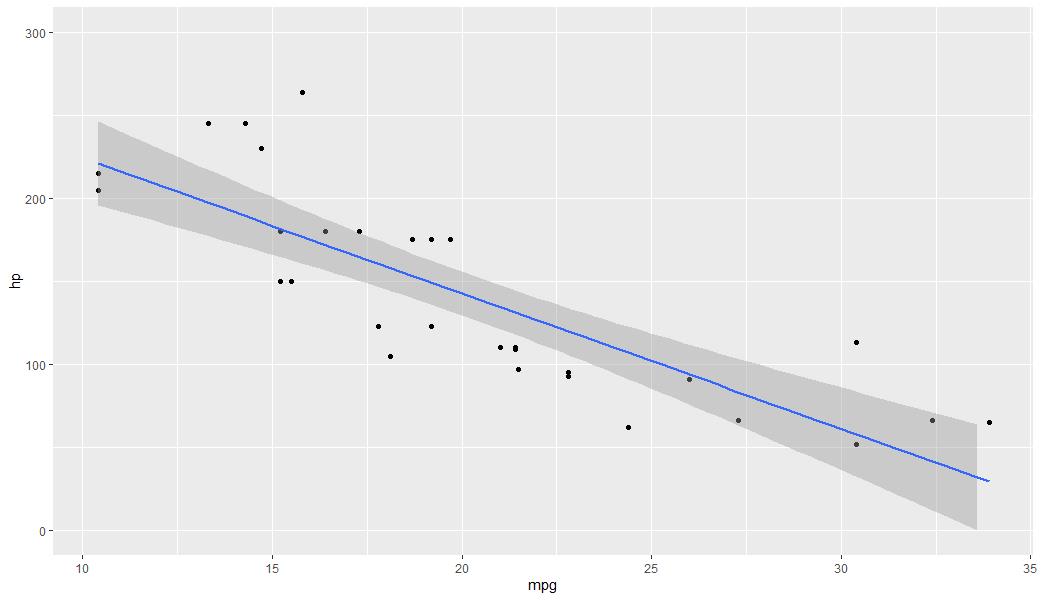
ggplot(mtcars, aes(mpg, hp)) +
  geom_point() +
  scale_y_continuous(limits=c(0,300)) +  # Change this to limits=c(0,335) and the warning disappars
  geom_smooth(method="lm")
>
> ggplot(mtcars, aes(mpg, hp)) +
+ geom_point() +
+ scale_y_continuous(limits=c(0,300)) + # Change this to limits=c(0,335) and the warning disappars
+ geom_smooth(method="lm")
`geom_smooth()` using formula 'y ~ x'
Warning messages:
1: Removed 1 rows containing non-finite values (stat_smooth).
2: Removed 1 rows containing missing values (geom_point).
>

解决:coord_cartesian
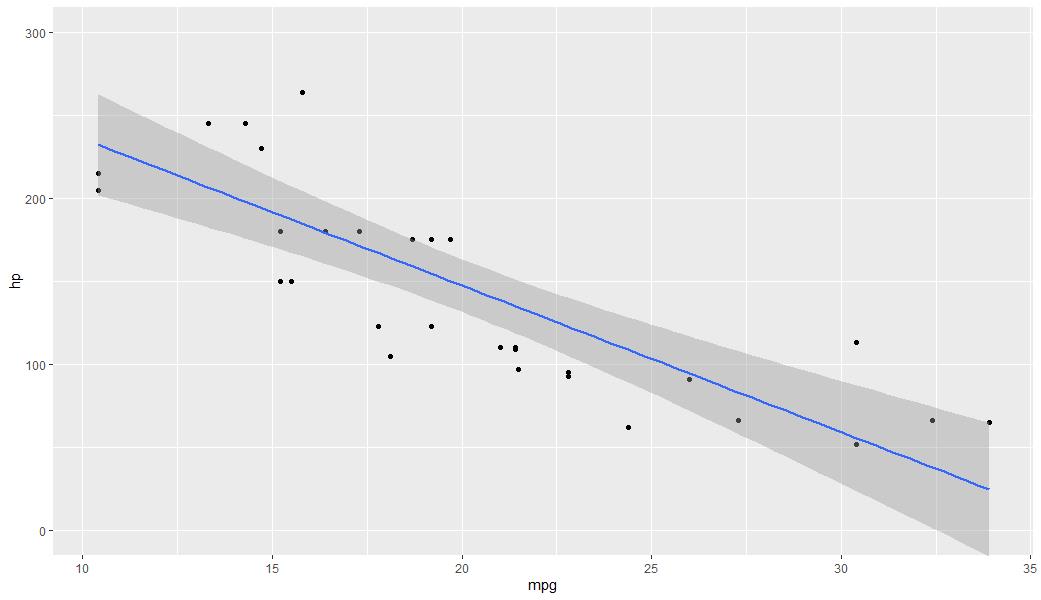
使用coord_cartesian保留所有数据点;
ggplot(mtcars, aes(mpg, hp)) +
  geom_point() +
  coord_cartesian(ylim=c(0,300)) +
  geom_smooth(method="lm")
#所有的点都在范围内
library(ggplot2)

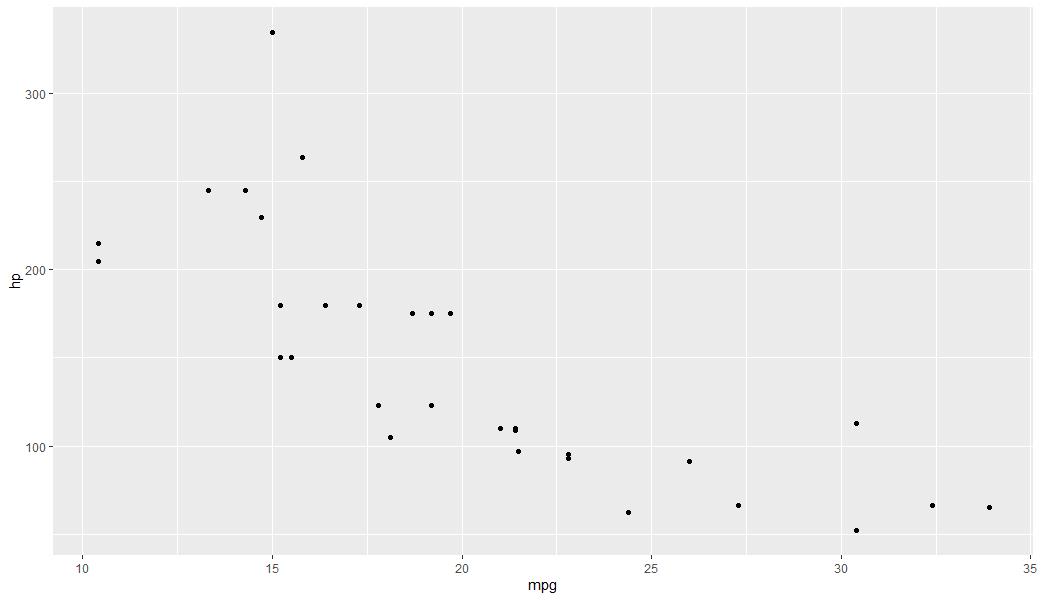
# All points are visible in the plot
ggplot(mtcars, aes(mpg, hp)) +
  geom_point()
#如果使用jitter有可能超出范围也会发生类似错误
library(ggplot2)

range(mtcars$hp)
#> [1]  52 335

# No jitter -- no error message
ggplot(mtcars, aes(mpg, hp)) +
    geom_point() +
    scale_y_continuous(limits=c(0,335))


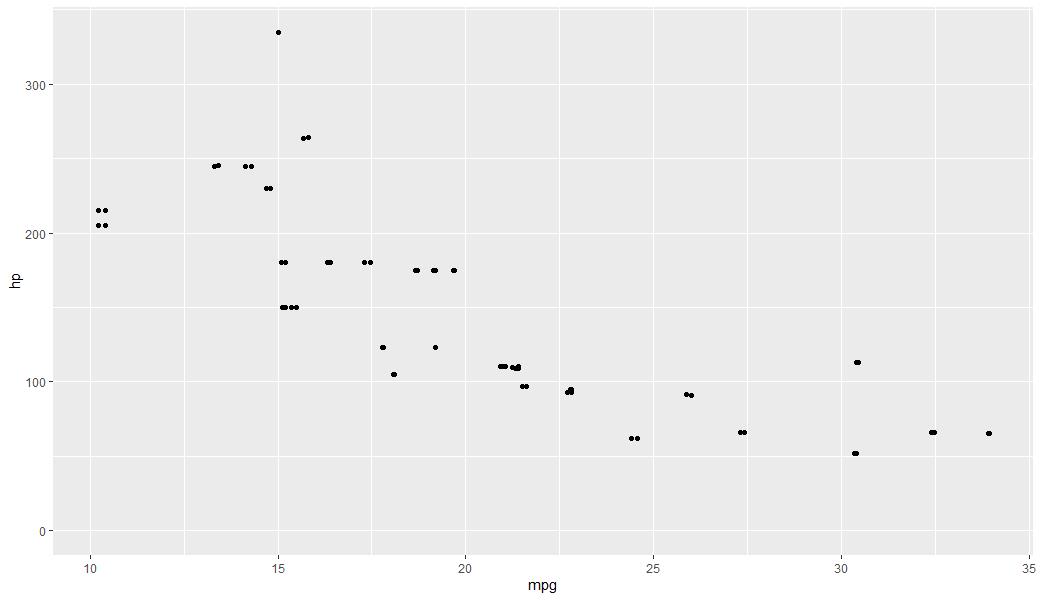
# Jitter is too large -- this generates the error message
ggplot(mtcars, aes(mpg, hp)) +
    geom_point() +
    geom_jitter(position = position_jitter(w = 0.2, h = 0.2)) +
    scale_y_continuous(limits=c(0,335))
#> Warning: Removed 1 rows containing missing values (geom_point).
参考:R
参考:Explain ggplot2 warning: "Removed k rows containing missing values"
以上是关于Removed k rows containing missing values的主要内容,如果未能解决你的问题,请参考以下文章
Container inside Row 和 Row inside Container
Flutter Bottom 被像素溢出,尝试了 Column()、Row()、Container() 等等
Flutter Container 在 Row 小部件内定位或对齐
pandas基于dataframe字符串数据列包含(contains)特定字符串来筛选dataframe中的数据行(rows where values contain substring)