Prometheus监控服务端安装
Posted gsls200808
tags:
篇首语:本文由小常识网(cha138.com)小编为大家整理,主要介绍了Prometheus监控服务端安装相关的知识,希望对你有一定的参考价值。
Prometheus 是由 SoundCloud 开源监控告警解决方案,之前用过zabbix监控过交换机流量和主机cpu内存,感觉配置都太繁琐,所以简单学习一下Prometheus,安装还是比较简单的。可以适用于客户现场没有多余机器但有监控需求的情况,对客户的现有环境干扰也比较少(主要指监控服务端安装)。
本文只将服务端安装,不讲节点监控node_exporter和Grafana仪表盘整合。很多文章放一起讲反而导致很多人初看文章的时候无法区分哪个是服务端哪个是客户端的。
1.go环境安装
安装go环境
wget https://golang.google.cn/dl/go1.17.1.linux-amd64.tar.gz
解压&配置
tar -C /usr/local -zxvf go1.17.1.linux-amd64.tar.gz
环境变量,其实我最喜欢用的是nano
vi /etc/profile
在末尾新增两行
export GOROOT=/usr/local/go
export PATH=$PATH:$GOROOT/bin
刷新环境变量
source /etc/profile
检测安装成功
go version
2.安装Prometheus
下载和解压
wget https://github.com/prometheus/prometheus/releases/download/v2.30.0/prometheus-2.30.0.linux-amd64.tar.gz
tar -C /usr/local -zxvf  prometheus-2.30.0.linux-amd64.tar.gz
建立软链接
ln -sv /usr/local/prometheus-2.30.0.linux-amd64/ /usr/local/prometheus
进入目录启动
cd /usr/local/prometheus
命令行启动
./prometheus
设置开机自启
vi /etc/systemd/system/prometheus.service添加以下内容
[Unit]
Description=prometheus
After=network.target

[Service]
User=root #必须设置User,否则不生效,其他用户需要配置相关权限
Type=simple
Restart=on-failure
ExecStart=/usr/local/prometheus/prometheus \\
  --config.file=/usr/local/prometheus/prometheus.yml \\
  --web.listen-address=:9090
ExecReload=/bin/kill -HUP $MAINPID

[Install]
WantedBy=multi-user.target
重载service配置
systemctl daemon-reload
启动和开机自启
systemctl start prometheus &systemctl enable prometheus默认端口9090添加到防火墙
firewall-cmd --zone=public  --add-port=9090/tcp  --permanent
firewall-cmd --reload
验证
http://10.24.220.102:9090/ http://10.24.220.102:9090/ip换成你自己的ip,本机可以先curl,wget本地验证。

重点关注的是status-target界面
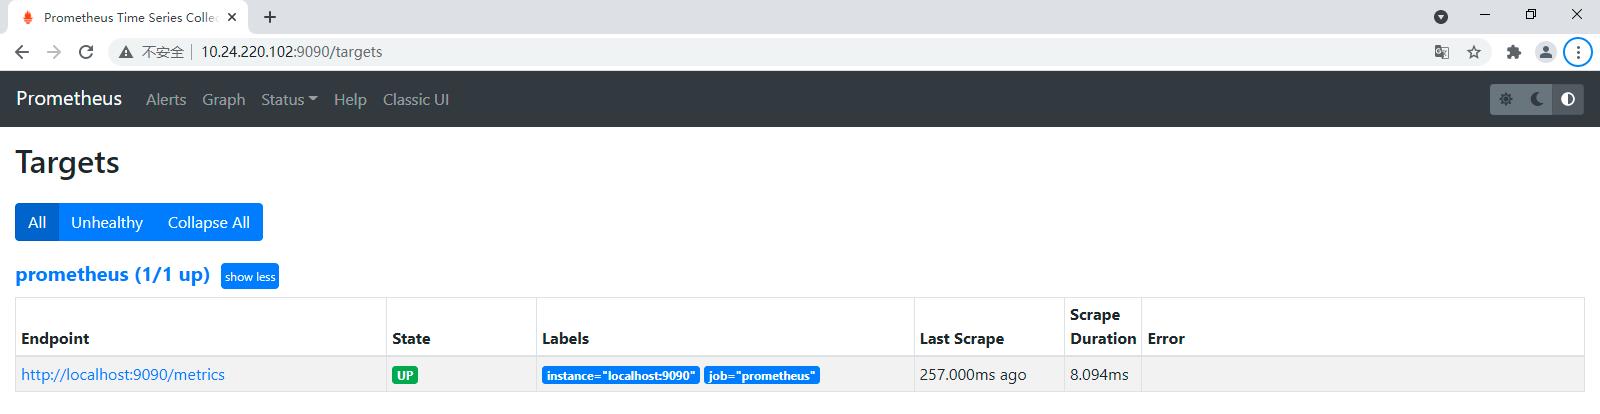
可以看到,一个叫prometheus的服务端启动了
后续我们增加客户端node监控,docker监控,mysql监控都可以在这里看到新增的东西。
3.安装Grafana
下载和安装
wget https://dl.grafana.com/oss/release/grafana-8.1.4-1.x86_64.rpm
yum localinstall grafana-8.1.4-1.x86_64.rpm
启动和开机自启
systemctl start grafana-server & systemctl enable grafana-server
默认端口3000添加到防火墙
firewall-cmd --zone=public  --add-port=3000/tcp  --permanent
firewall-cmd --reload
访问
http://ip:3000/login
默认密码
admin admin
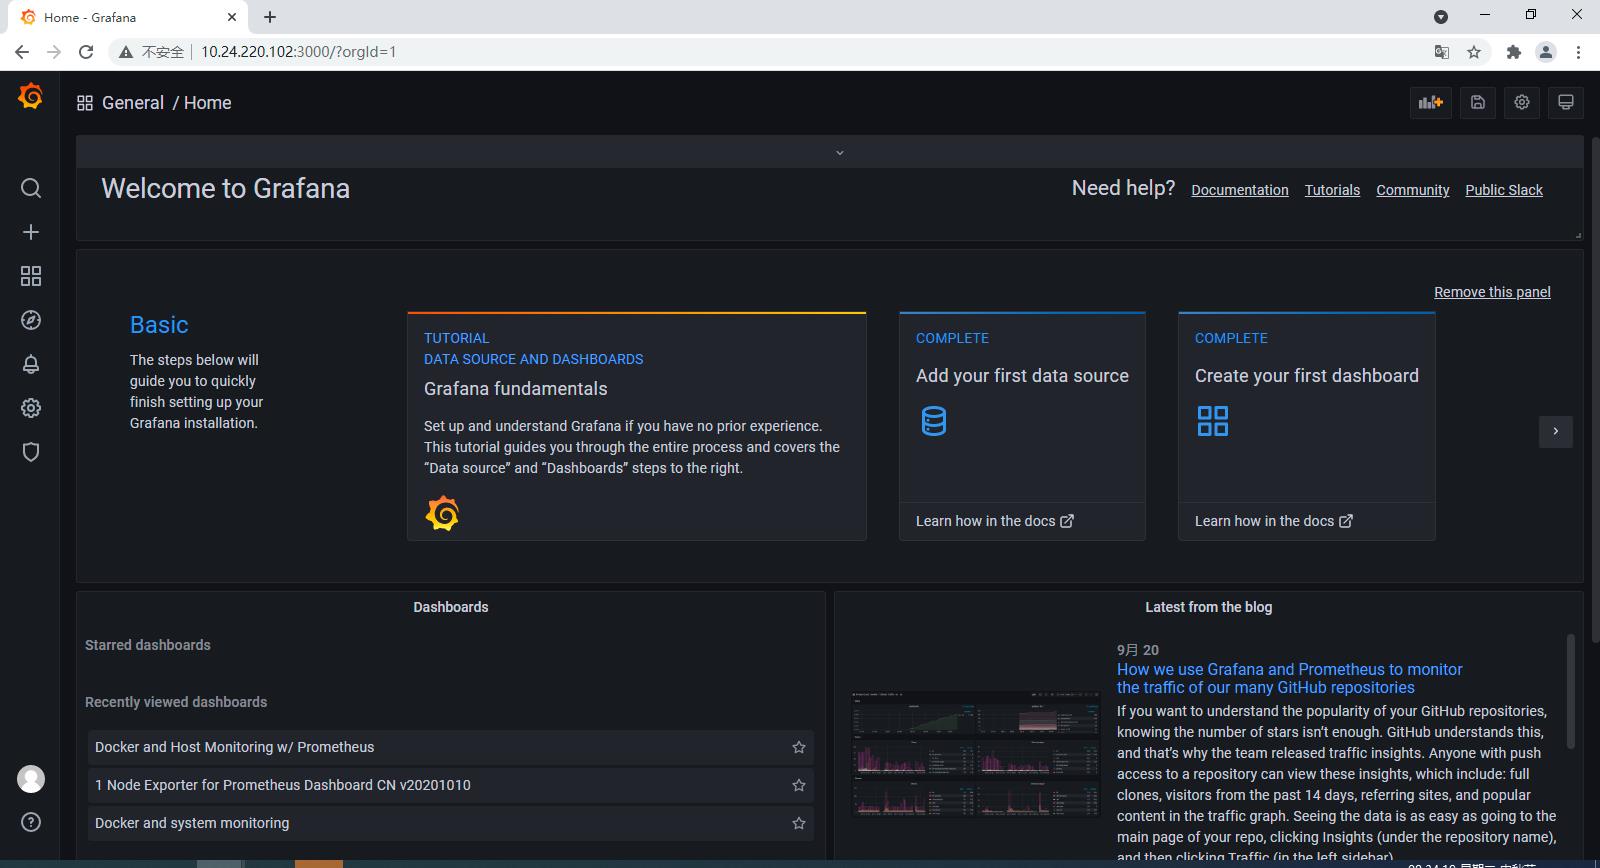
初次登录会提示更改密码
初次登录界面如下
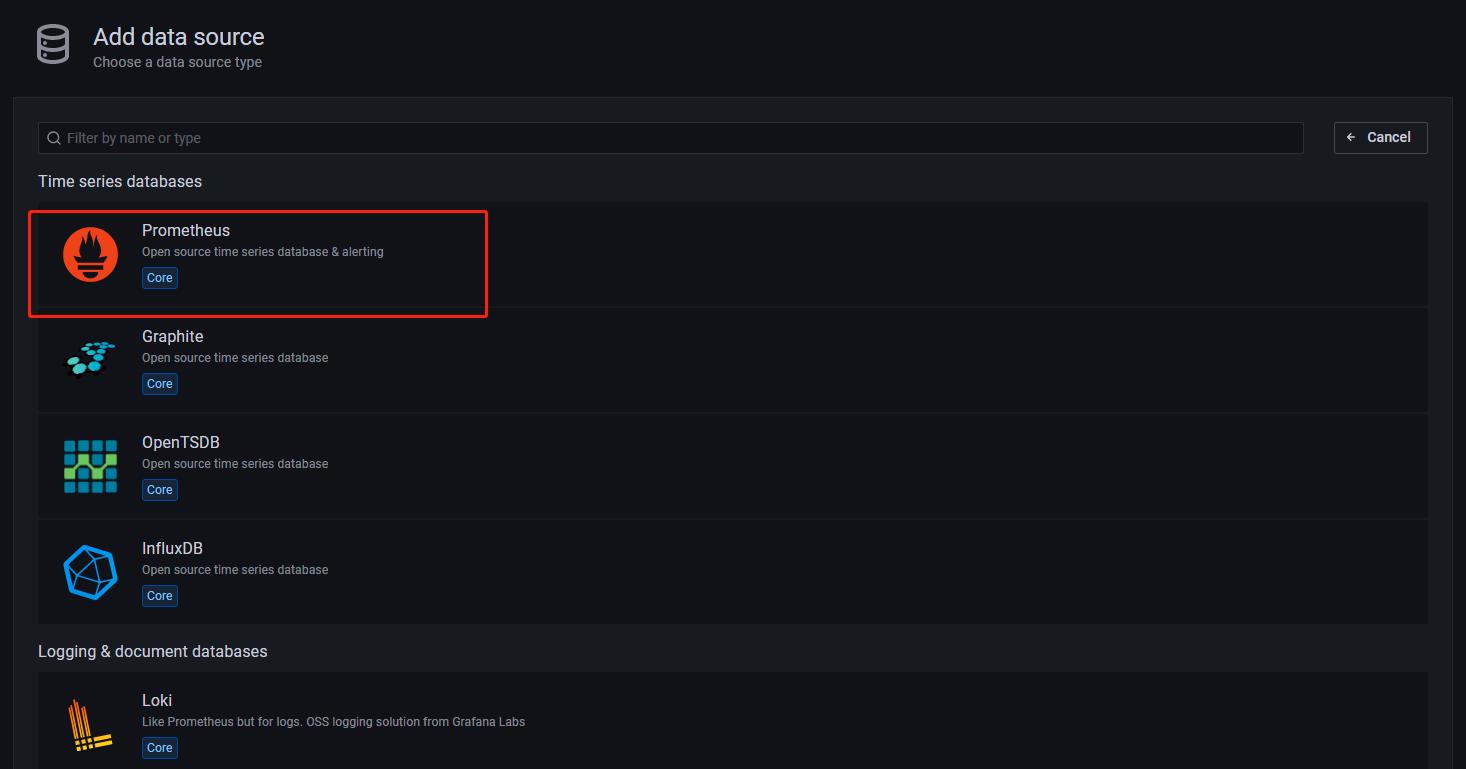
添加Prometheus数据源信息
到设置页面配置Prometheus的连接信息
齿轮-datasource-add datasource 选择Prometheus
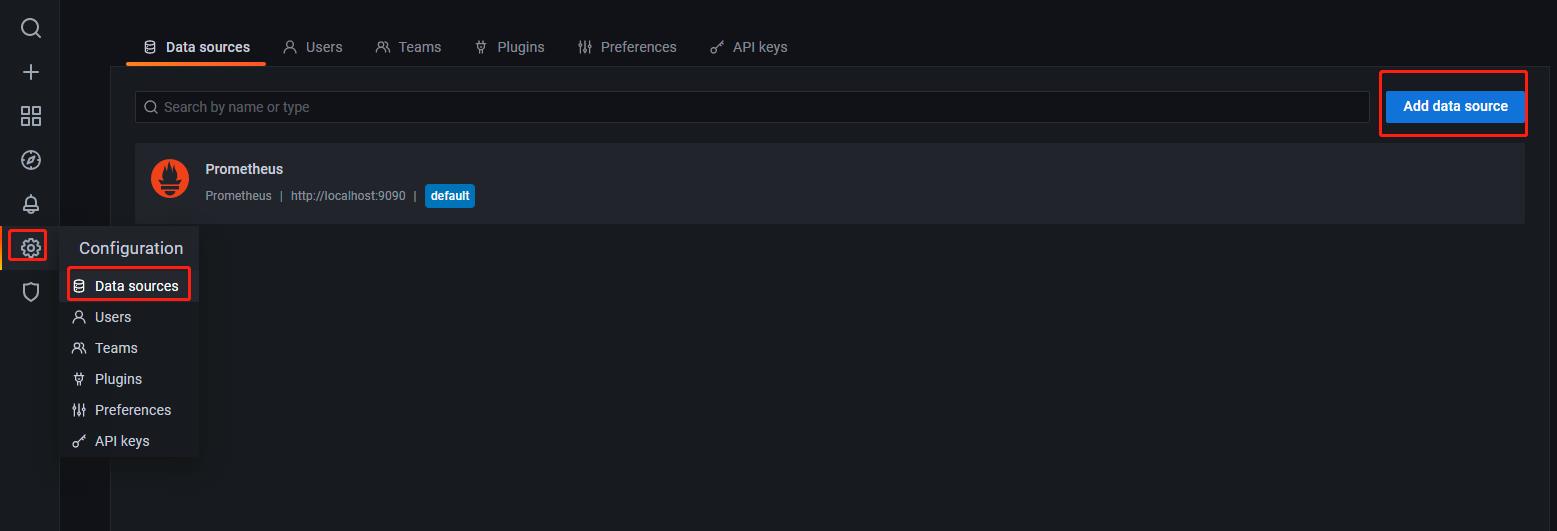
如果是本机URL都不用改,填http://localhost:9090
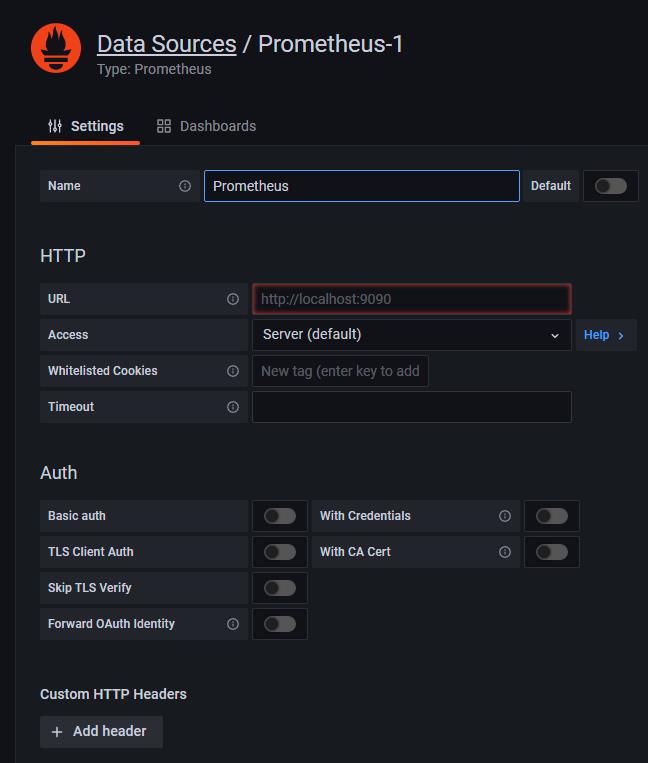
然后点击save and test
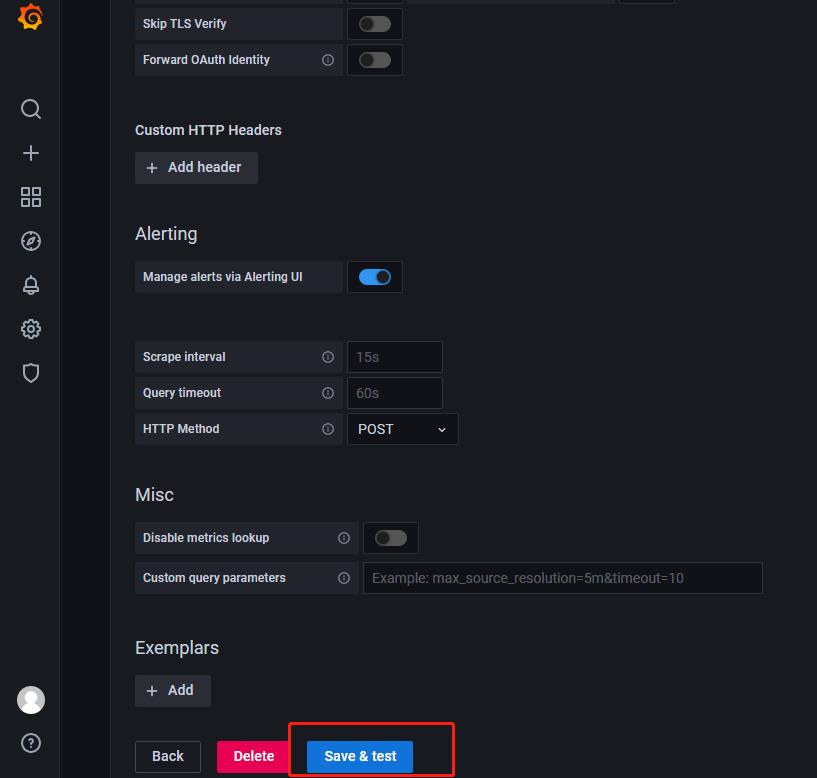
这样Grafana和Prometheus就建立关联了,主要是为了后面显示好看的仪表盘。
以上是关于Prometheus监控服务端安装的主要内容,如果未能解决你的问题,请参考以下文章
linux(centos8):安装prometheus服务端/node_exporter客户端(prometheus 2.18.1)
linux12 -prometheus监控 -->简述与安装
Prometheus+Grafana部署监控docker服务