MATLAB 一行代码应用ggtheme主题--violinplot版(小提琴图)
Posted slandarer
tags:
篇首语:本文由小常识网(cha138.com)小编为大家整理,主要介绍了MATLAB 一行代码应用ggtheme主题--violinplot版(小提琴图)相关的知识,希望对你有一定的参考价值。
说明:
小提琴图请用该文所使用函数绘制:
如何使用 MATLAB 绘制小提琴图

1使用方式
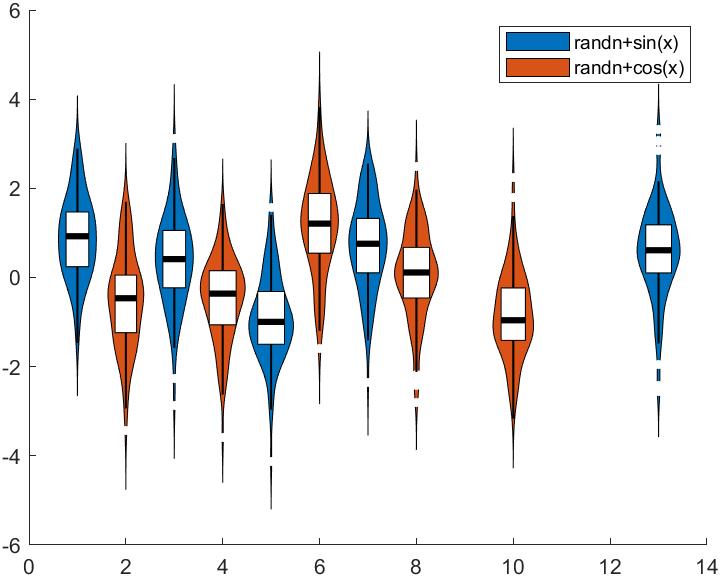
假设你编写了如下程序:
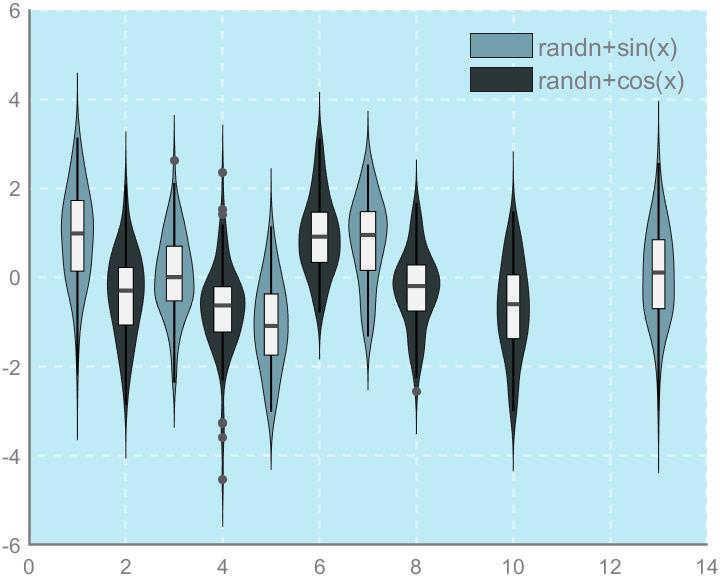
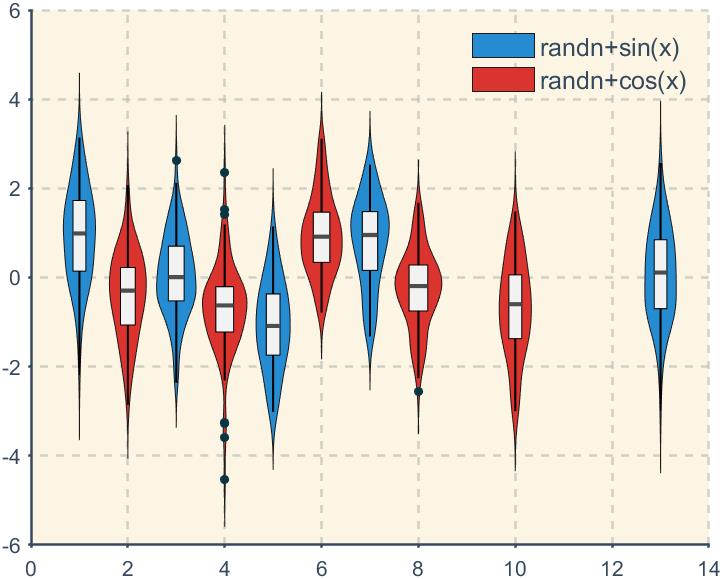
X1=[1:2:7,13];
Y1=randn(100,5)+sin(X1);
X2=2:2:10;
Y2=randn(100,5)+cos(X2);

figure
Hdl1=violinChart(gca,X1,Y1,[0     0.447 0.741]);
Hdl2=violinChart(gca,X2,Y2,[0.850 0.325 0.098]);
legend([Hdl1.F_legend,Hdl2.F_legend],{'randn+sin(x)','randn+cos(x)'});
与前面几期不同的是,毕竟原本绘图函数都是自己写的,为了追求代码简洁,把图形对象也作为参数传入修饰函数中:
在最后面加上一行变为:
X1=[1:2:7,13];
Y1=randn(100,5)+sin(X1);
X2=2:2:10;
Y2=randn(100,5)+cos(X2);
figure
Hdl1=violinChart(gca,X1,Y1,[0 0.447 0.741]);
Hdl2=violinChart(gca,X2,Y2,[0.850 0.325 0.098]);
legend([Hdl1.F_legend,Hdl2.F_legend],{'randn+sin(x)','randn+cos(x)'});
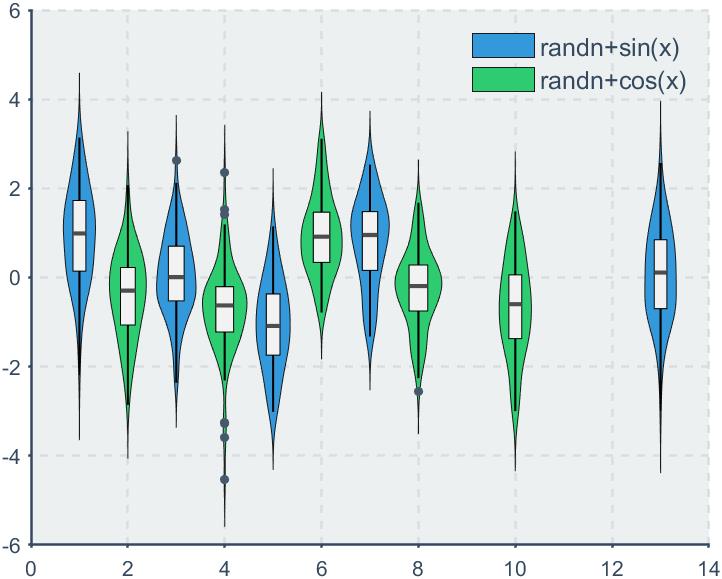
ggThemeViolin(gca,[Hdl1,Hdl2],'dust');

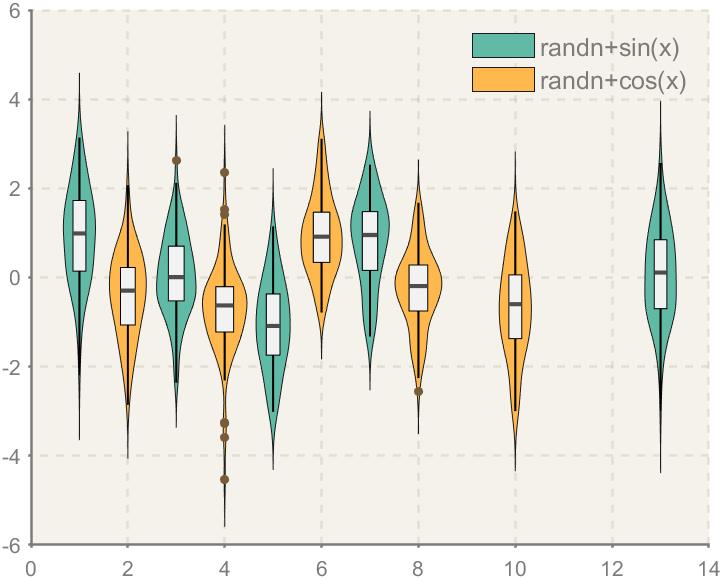
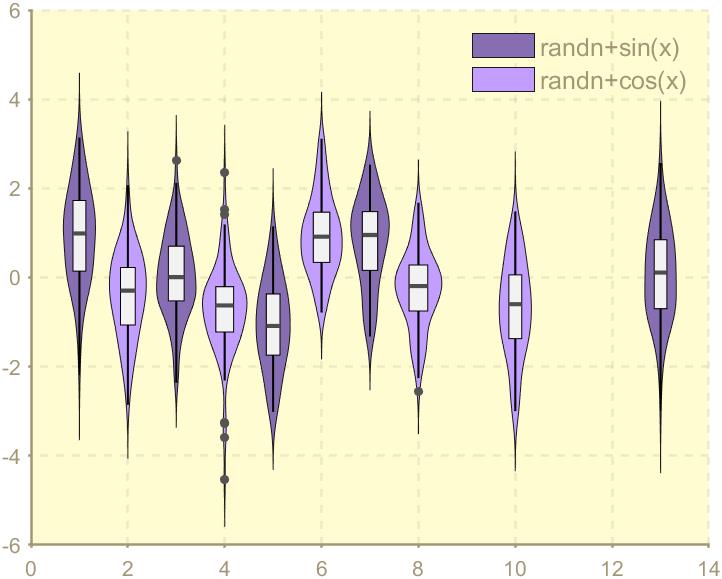
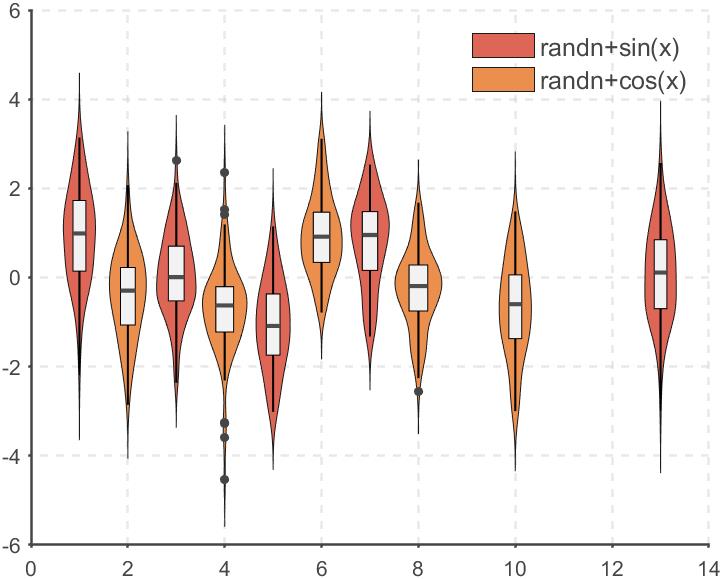
2主题
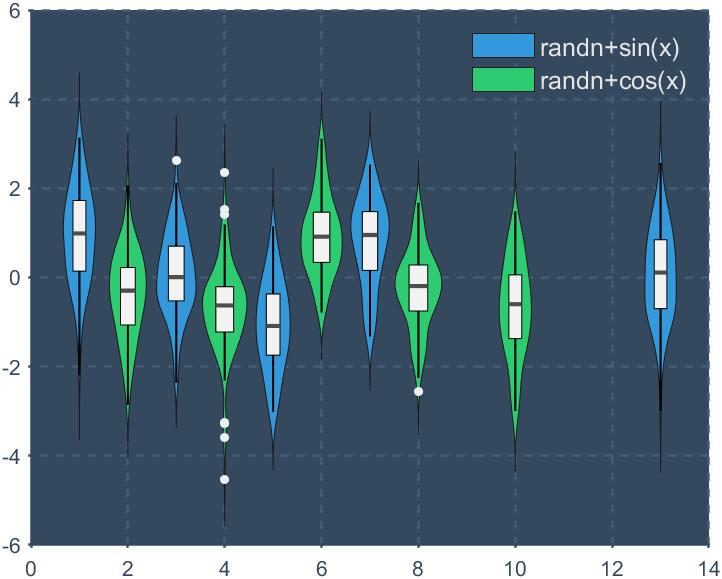
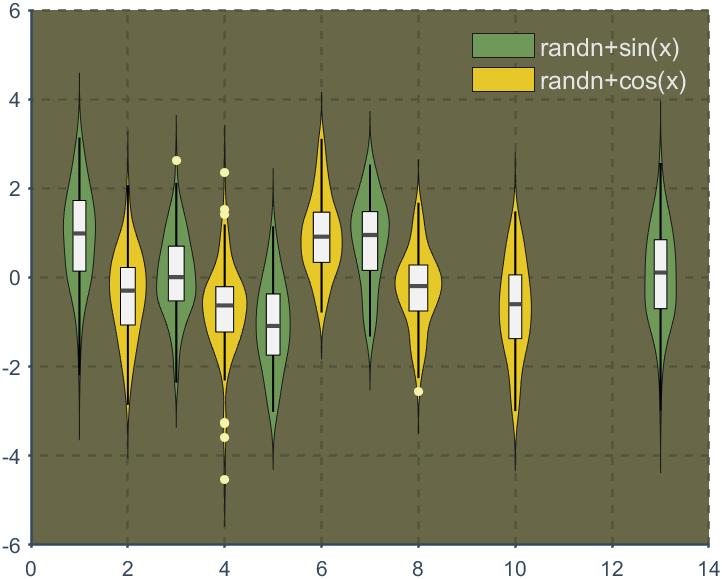
主题有如下选择:
‘flat’/‘flat_dark’/‘camouflage’/‘chalk’/
‘copper’/‘dust’/‘earth’/‘fresh’/‘grape’/
‘grass’/‘greyscale’/‘light’/‘lilac’/‘pale’
‘sea’/‘sky’/‘solarized’
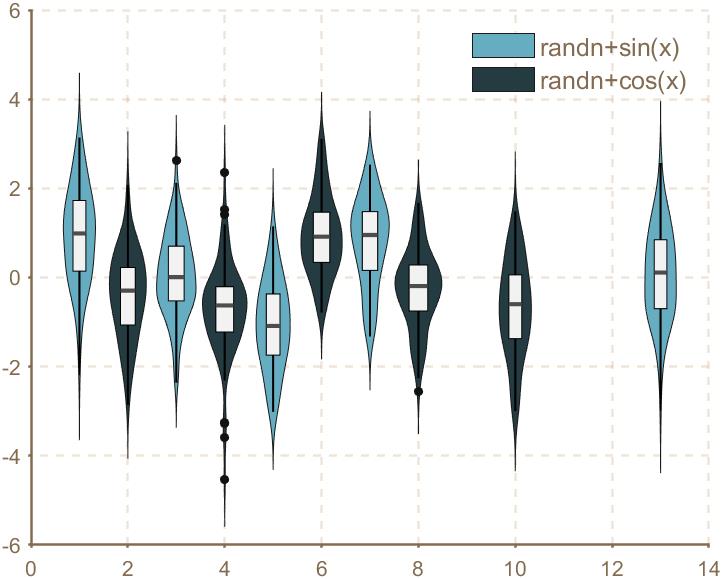
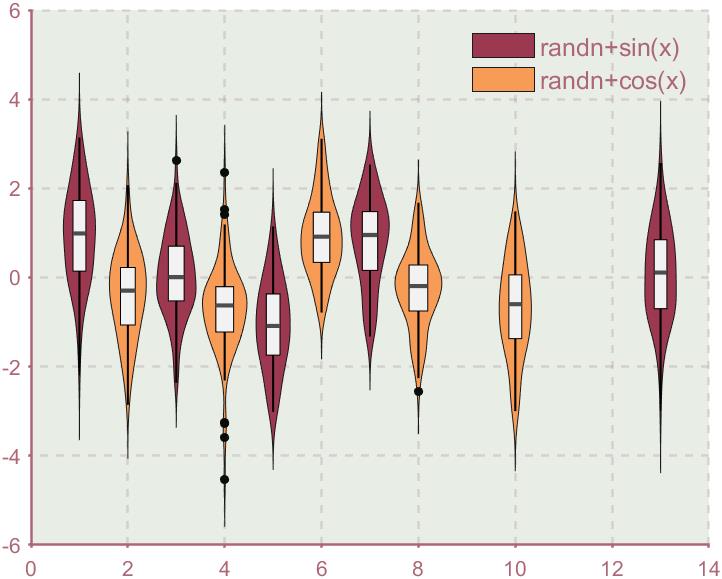
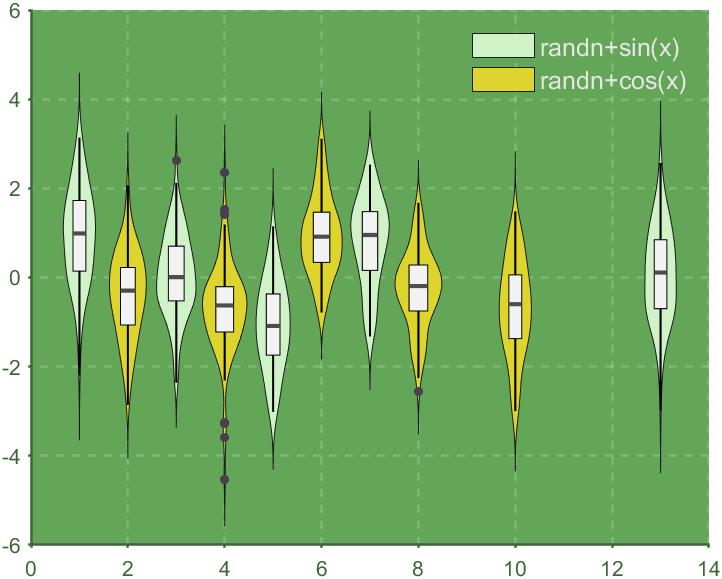
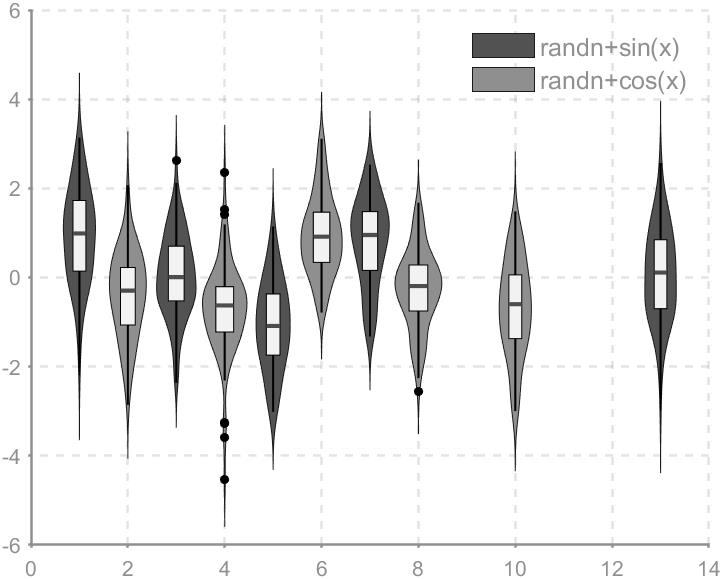
效果:
‘flat’
‘flat_dark’
‘camouflage’
‘chalk’
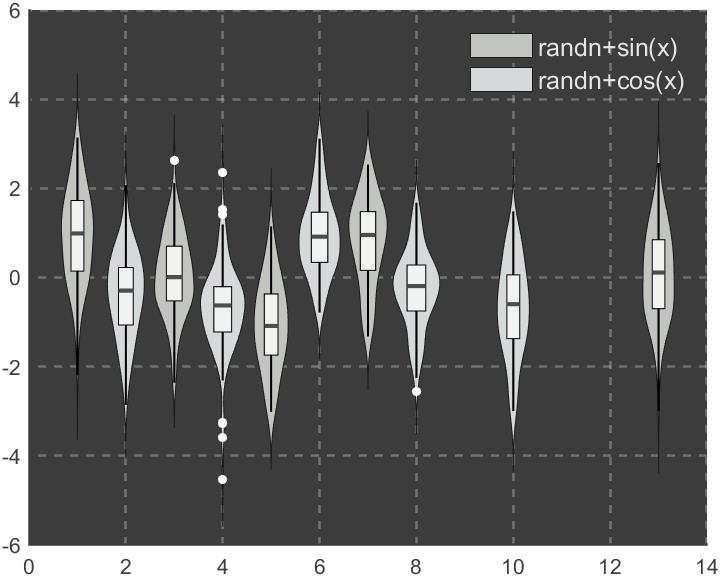
‘copper’
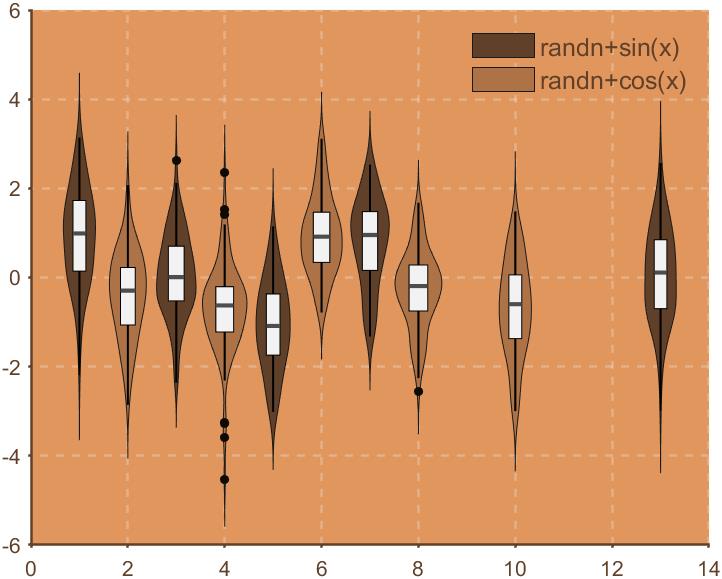
‘dust’
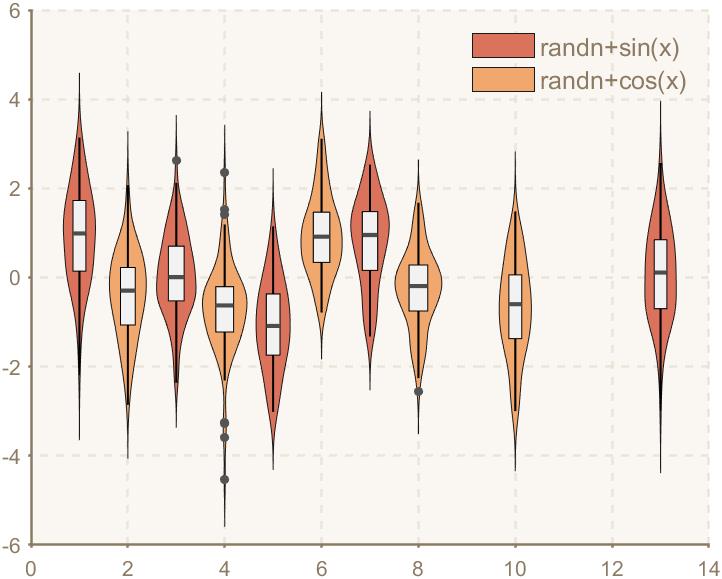
‘earth’
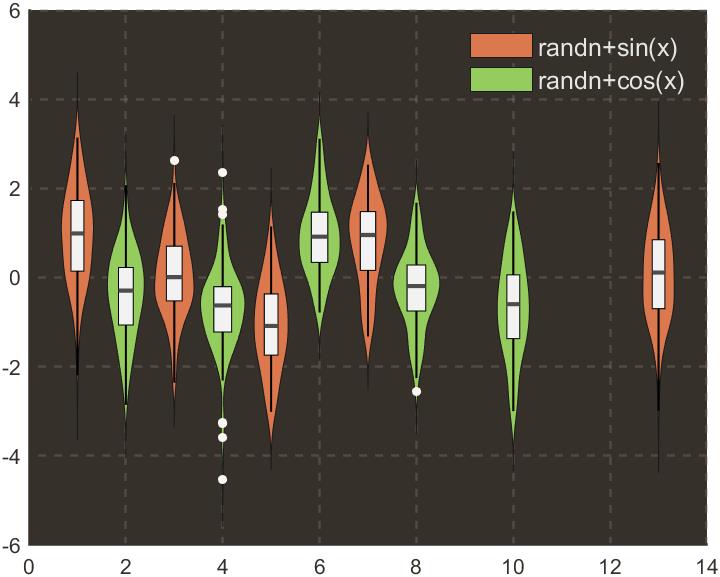
‘fresh’
‘grape’
‘grass’
‘greyscale’
‘light’
‘lilac’
‘pale’
‘sea’
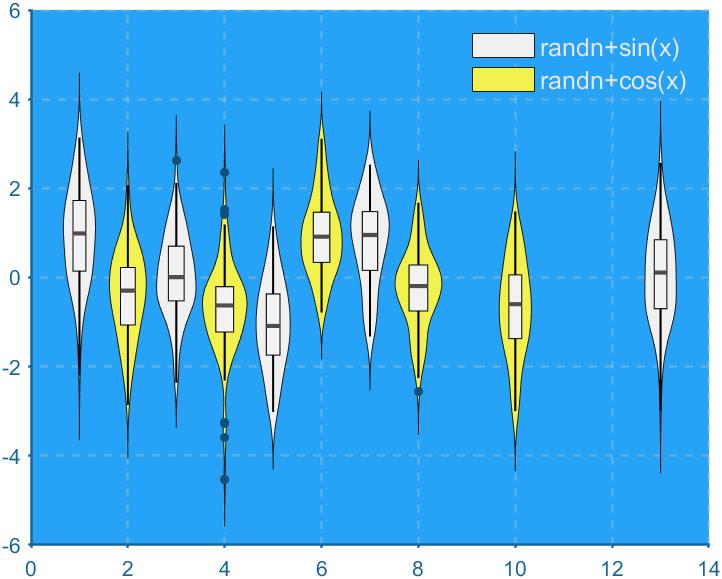
‘sky’
‘solarized’
3完整代码
属性存到了.mat文件
文件下载地址:
链接:https://pan.baidu.com/s/1EMWVVzUCLP3RJIEK3Ljavg
提取码: ggtm
需要将.mat文件和函数放在同一个文件夹
完整代码:
function ax=ggThemeViolin(varargin)
% @author:slandarer
%
% 参数说明:
% -----------------------------------------------------
% AxesTheme   | 坐标区域风格       | 'flat'/'flat_dark'/'camouflage'/'chalk'/
%                                    'copper'/'dust'/'earth'/'fresh'/'grape'/
%                                    'grass'/'greyscale'/'light'/'lilac'/'pale'
%                                    'sea'/'sky'/'solarized'
%
% HDLset      | 句柄集合

% 获取要处理的坐标区域=====================================================
if strcmp(get(varargin{1},'type'),'axes' )
    ax=varargin{1};
else
    ax=gca;
end
hold(ax,'on')

% 获取要处理的图像句柄=====================================================
HDLset=varargin{2};

% 获取风格名称=============================================================
theme.AxesTheme='flat';
if length(varargin)>2
    theme.AxesTheme=varargin{3};
end

% 开始风格化===============================================================
ax.Box='off';
ax.YGrid='on';
ax.XGrid='on';
ax.GridLineStyle='--';
ax.LineWidth=1.2;

% 主题风格化
Tm=load('themeCSS.mat');
Tm=Tm.theme;
ax.Color=Tm.(theme.AxesTheme).Color;
ax.TickLength=Tm.(theme.AxesTheme).TickLength;
ax.GridColorMode=Tm.(theme.AxesTheme).GridColorMode;
ax.GridColor=Tm.(theme.AxesTheme).GridColor;
ax.GridAlpha=Tm.(theme.AxesTheme).GridAlpha;
ax.XColor=Tm.(theme.AxesTheme).XColor;
ax.YColor=Tm.(theme.AxesTheme).YColor;
ax.TickDir=Tm.(theme.AxesTheme).TickDir;
ax.ColorOrder=Tm.(theme.AxesTheme).ColorOrder;

for i=1:length(HDLset)
    for j=1:length(HDLset(i).F_density)
        HDLset(i).F_density(j).FaceColor=ax.ColorOrder(mod(i-1,size(ax.ColorOrder,1))+1,:);
        HDLset(i).F_density(j).EdgeColor=[.1,.1,.1];

        f_max=(max(HDLset(i).F_density(j).XData)-min(HDLset(i).F_density(j).XData))/2;
        x_mid=(max(HDLset(i).F_density(j).XData)+min(HDLset(i).F_density(j).XData))/2;
        HDLset(i).F_quantile(j).XData=x_mid+0.4.*f_max.*[-1 1 1 -1];
        HDLset(i).F_quantile(j).FaceColor=[1 1 1].*0.95;

        HDLset(i).F_medianLine(j).XData=x_mid+0.4.*f_max.*[-1 1];
        HDLset(i).F_medianLine(j).LineWidth=2;
        HDLset(i).F_medianLine(j).Color=[0.3,0.3,0.3];

        HDLset(i).F_outlier(j).CData=Tm.(theme.AxesTheme).EdgeColor;
    end

end

if ~isempty(ax.Legend)
    ax.Legend.Box='off';
    ax.Legend.FontSize=12;
    if mean(ax.Color)>0.6
        ax.Legend.TextColor=ax.XColor;
    else
        ax.Legend.TextColor=[0.9 0.9 0.9];
    end
    if ~isempty(regexpi(ax.Legend.Location,'out', 'once'))
        ax.Legend.TextColor=ax.XColor;
        ax.Legend.Title.FontSize=14;
    end
    ax.Legend.AutoUpdate='off';
end

end
以上是关于MATLAB 一行代码应用ggtheme主题--violinplot版(小提琴图)的主要内容,如果未能解决你的问题,请参考以下文章