MATLAB 一行代码应用ggtheme主题--plot版
Posted slandarer
tags:
篇首语:本文由小常识网(cha138.com)小编为大家整理,主要介绍了MATLAB 一行代码应用ggtheme主题--plot版相关的知识,希望对你有一定的参考价值。
1使用方式
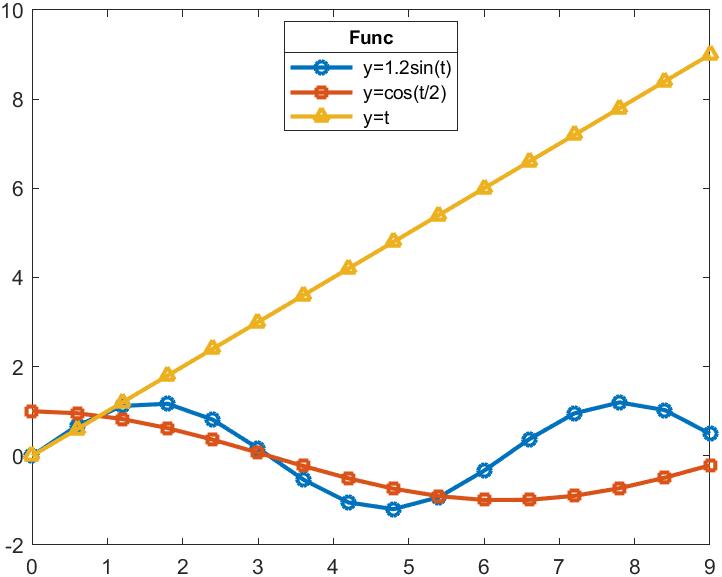
假设你画了如下曲线:
t=0:0.6:3*pi;
plot(t,sin(t).*1.2,'LineWidth',2,'Marker','o')
hold on
plot(t,cos(t./2),'LineWidth',2,'Marker','s')
plot(t,t,'LineWidth',2,'Marker','^')

lgd=legend(' y=1.2sin(t)',' y=cos(t/2)',' y=t');
lgd.Location='best';
title(lgd,'Func')
在最后面加上一行变为:
t=0:0.6:3*pi;
plot(t,sin(t).*1.2,'LineWidth',2,'Marker','o')
hold on
plot(t,cos(t./2),'LineWidth',2,'Marker','s')
plot(t,t,'LineWidth',2,'Marker','^')

lgd=legend(' y=1.2sin(t)',' y=cos(t/2)',' y=t');
lgd.Location='best';
title(lgd,'Func')

ggThemePlot(gca,'dust');

这份代码和之前ggplot风格图片修饰器类似,区别的是该函数只对plot函数修饰,主题更多,之后会写柱状图版,密度图版及框须图版
2主题
主题有如下选择:
‘flat’/‘flat_dark’/‘camouflage’/‘chalk’/
‘copper’/‘dust’/‘earth’/‘fresh’/‘grape’/
‘grass’/‘greyscale’/‘light’/‘lilac’/‘pale’
‘sea’/‘sky’/‘solarized’
效果:
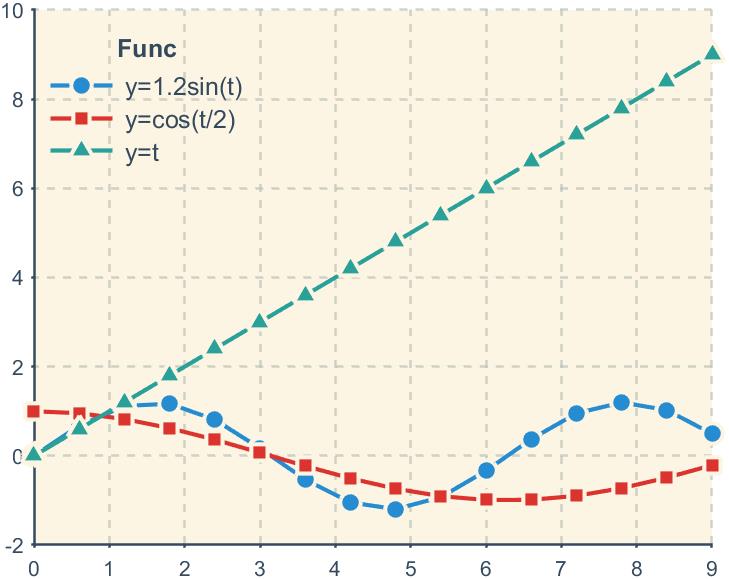
‘flat’
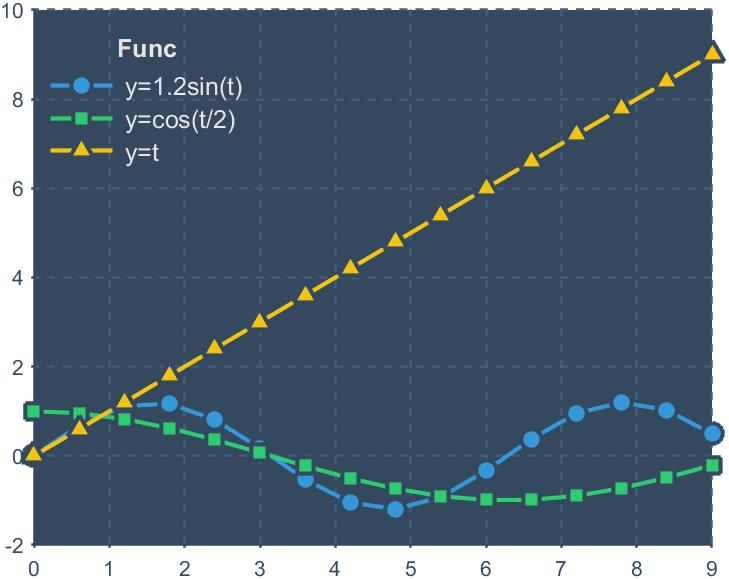
‘flat_dark’
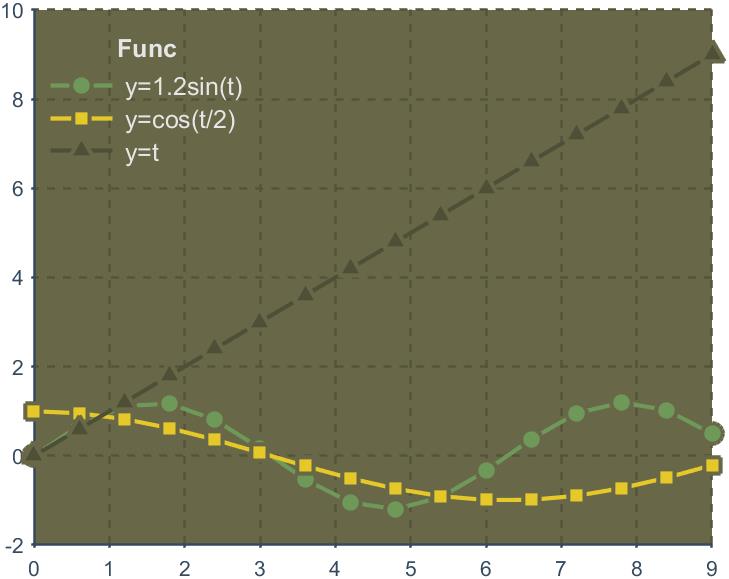
‘camouflage’
‘chalk’
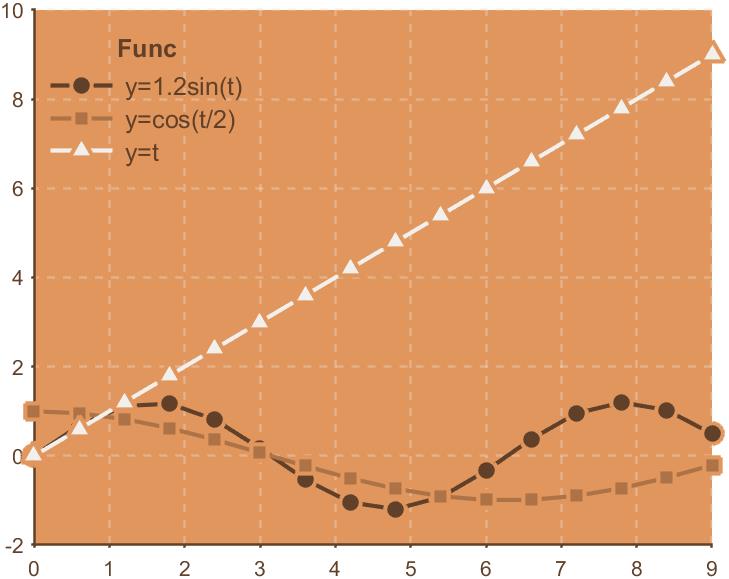
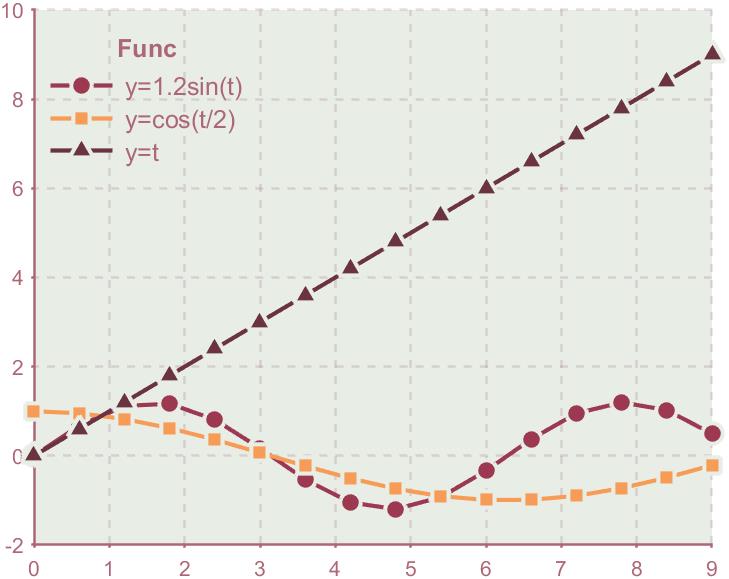
‘copper’
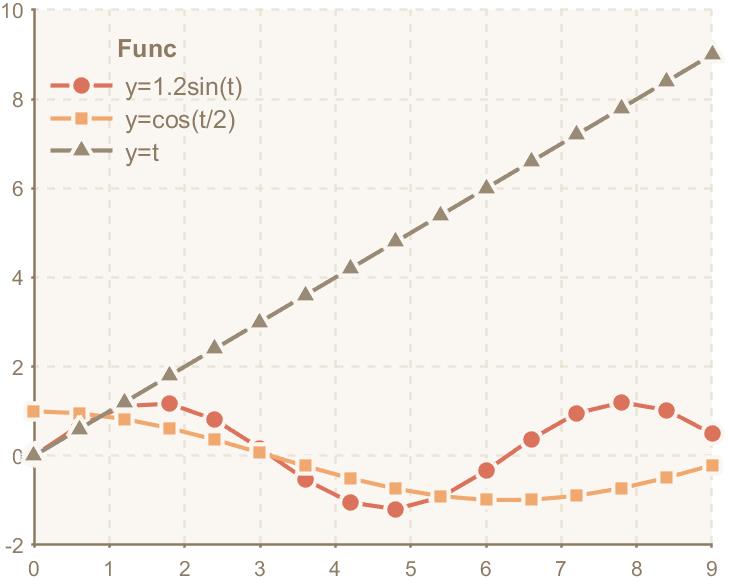
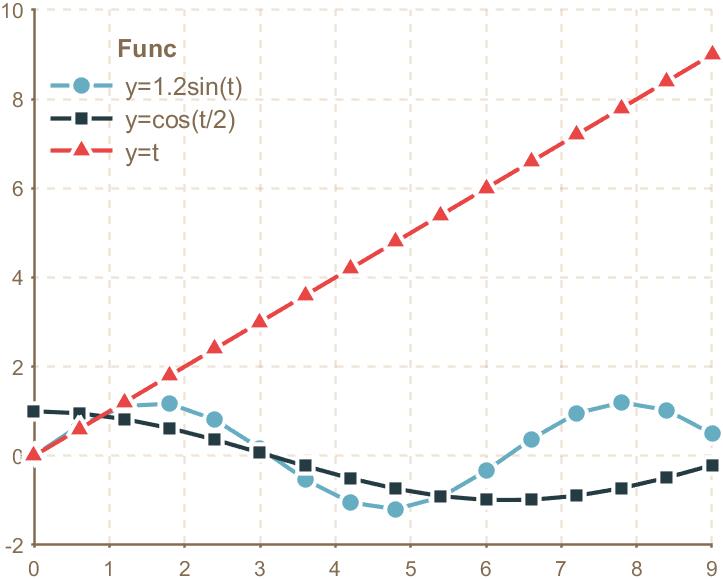
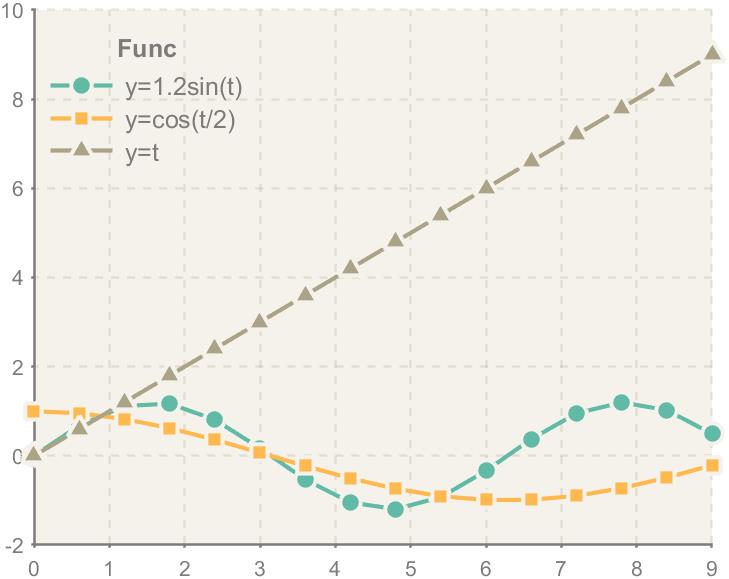
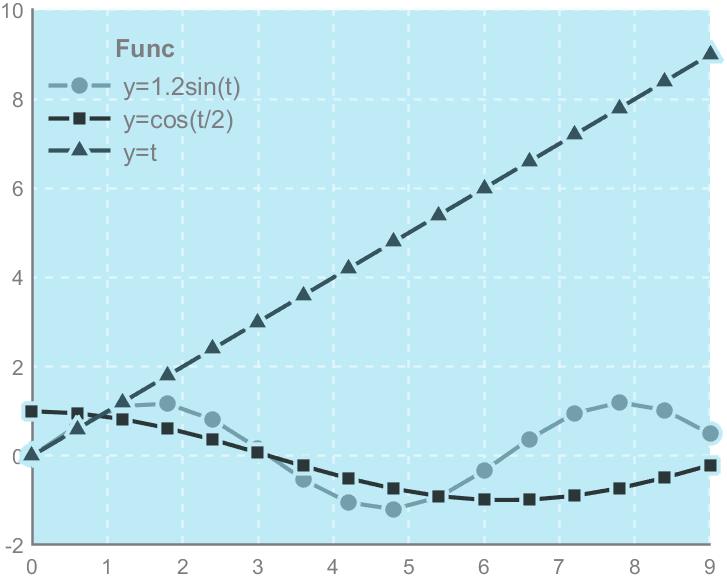
‘dust’
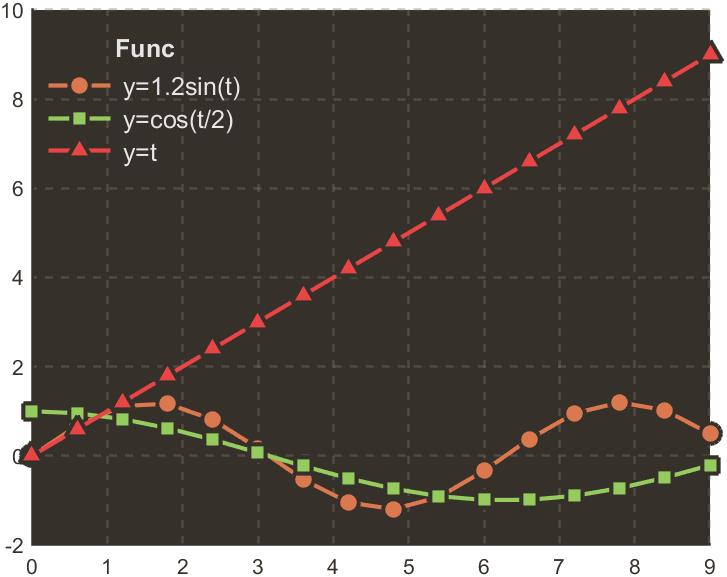
‘earth’
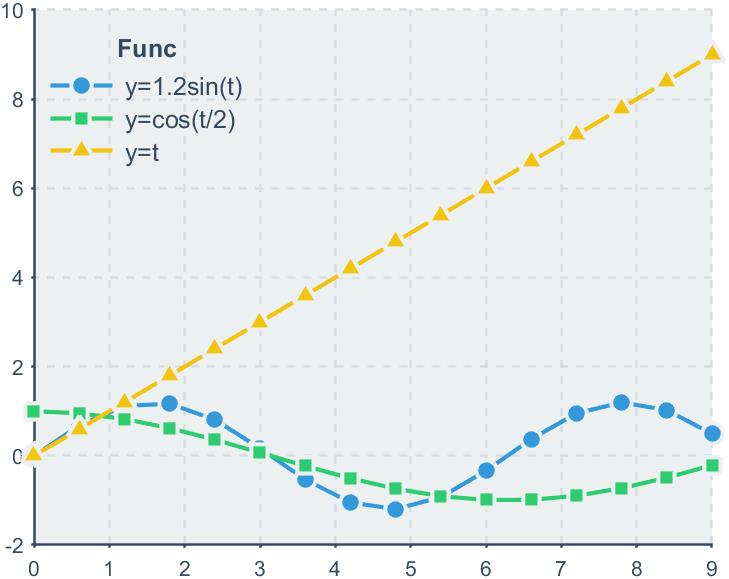
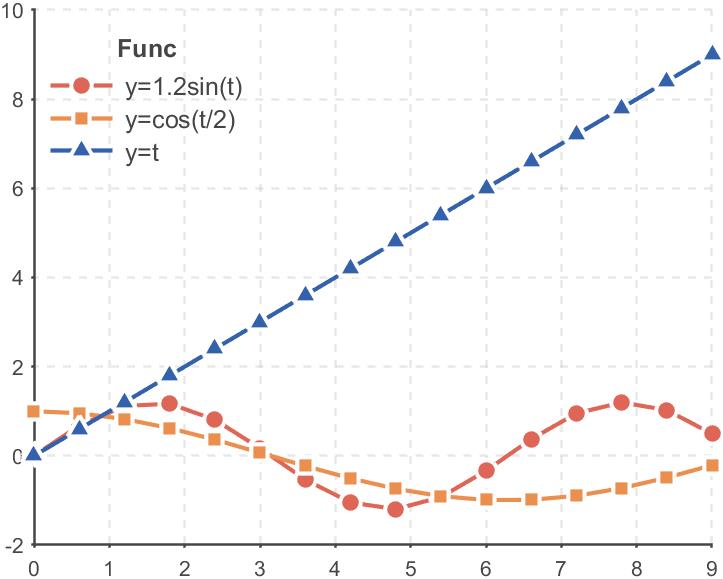
‘fresh’
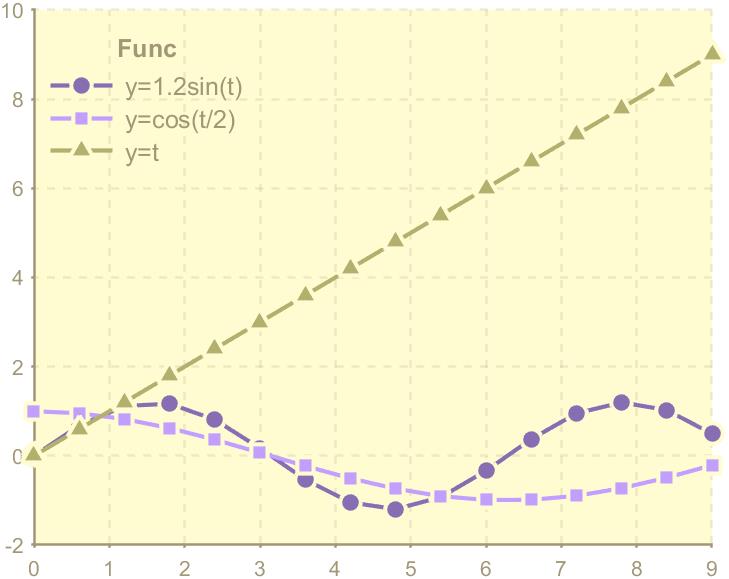
‘grape’
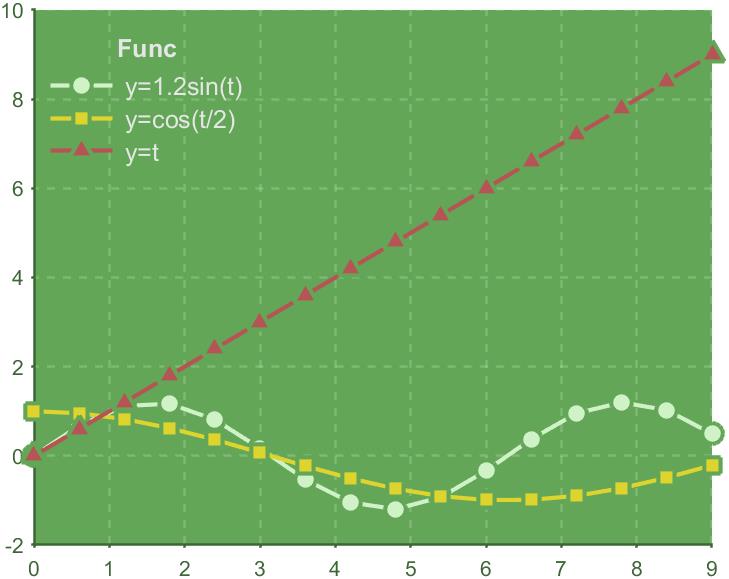
‘grass’
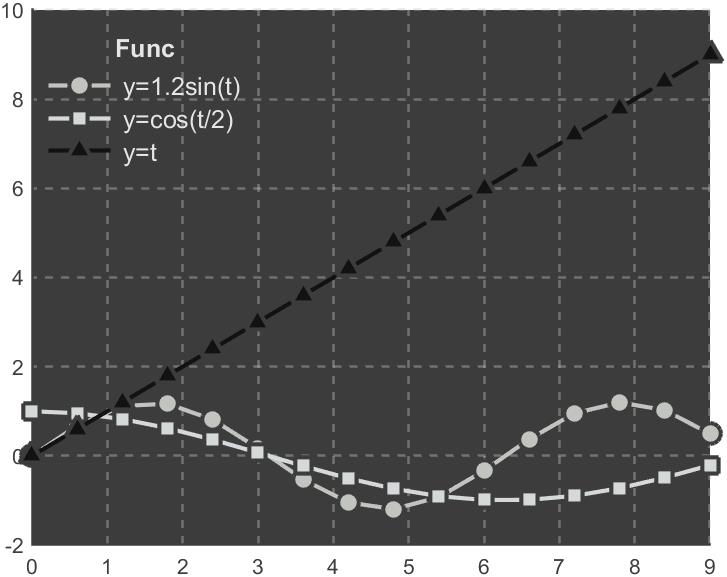
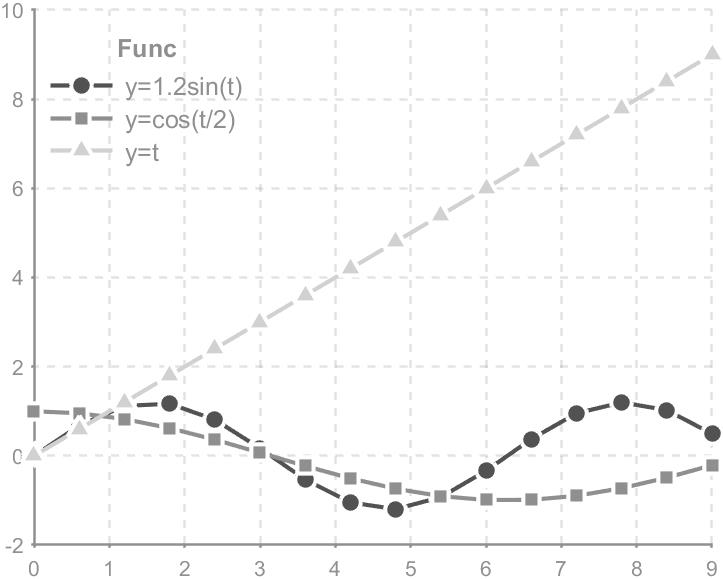
‘greyscale’
‘light’
‘lilac’
‘pale’
‘sea’
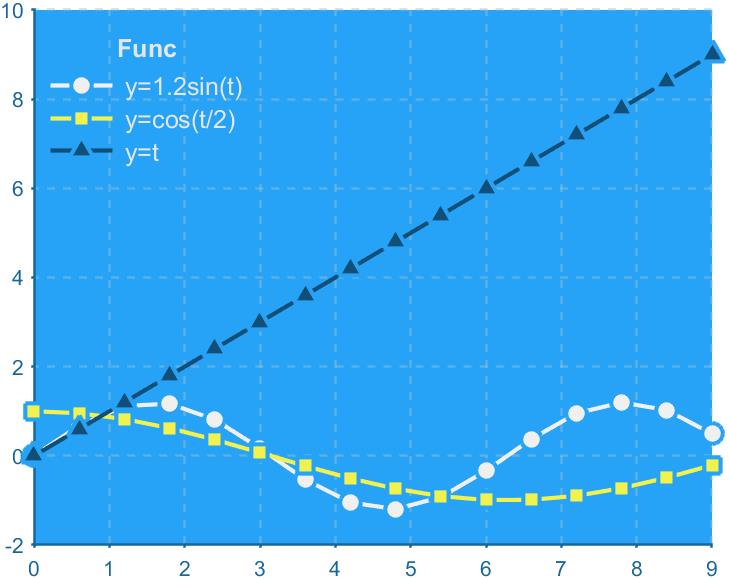
‘sky’
‘solarized’
3完整代码
属性存到了.mat文件
文件下载地址:
链接:https://pan.baidu.com/s/1EMWVVzUCLP3RJIEK3Ljavg
提取码: ggtm
需要将.mat文件和函数放在同一个文件夹
完整代码:
function ax=ggThemePlot(varargin)
% @author:slandarer
%
% 参数说明:
% -----------------------------------------------------
% AxesTheme   | 坐标区域风格       | 'flat'/'flat_dark'/'camouflage'/'chalk'/
%                                    'copper'/'dust'/'earth'/'fresh'/'grape'/
%                                    'grass'/'greyscale'/'light'/'lilac'/'pale'
%                                    'sea'/'sky'/'solarized'

% 获取要处理的坐标区域=====================================================
if strcmp(get(varargin{1},'type'),'axes' )
    ax=varargin{1};
else
    ax=gca;
end
hold(ax,'on')
for i=1:length(ax.Children)
    if strcmp(get(ax.Children(i),'type'),'line')
        ax.Children(i).ColorMode='auto';
        ax.Children(i).MarkerSize=10;
    end
end

% default==================================================================
theme.AxesTheme='flat';
if length(varargin)>1
    theme.AxesTheme=varargin{2};
end
ax.Box='off';
ax.YGrid='on';
ax.XGrid='on';
ax.GridLineStyle='--';
ax.LineWidth=1.2;
% 主题风格化
Tm=load('themeCSS.mat');
Tm=Tm.theme;
ax.Color=Tm.(theme.AxesTheme).Color;
ax.TickLength=Tm.(theme.AxesTheme).TickLength;
ax.GridColorMode=Tm.(theme.AxesTheme).GridColorMode;
ax.GridColor=Tm.(theme.AxesTheme).GridColor;
ax.GridAlpha=Tm.(theme.AxesTheme).GridAlpha;
ax.XColor=Tm.(theme.AxesTheme).XColor;
ax.YColor=Tm.(theme.AxesTheme).YColor;
ax.TickDir=Tm.(theme.AxesTheme).TickDir;
ax.ColorOrder=Tm.(theme.AxesTheme).ColorOrder;


if ~isempty(ax.Legend)
    ax.Legend.Box='off';
    ax.Legend.FontSize=12;
    if mean(ax.Color)>0.6
        ax.Legend.TextColor=ax.XColor;
    else
        ax.Legend.TextColor=[0.9 0.9 0.9];
    end
    if ~isempty(regexpi(ax.Legend.Location,'out', 'once'))
        ax.Legend.TextColor=ax.XColor;
        ax.Legend.Title.FontSize=14;
    end
end

n=1;
for i=length(ax.Children):-1:1
    if strcmp(get(ax.Children(i),'type'),'line')
        ax.Children(i).MarkerFaceColor=ax.ColorOrder(mod(n-1,size(ax.ColorOrder,1))+1,:);
        ax.Children(i).Color=ax.ColorOrder(mod(n-1,size(ax.ColorOrder,1))+1,:);
        ax.Children(i).MarkerEdgeColor=ax.Color;
        n=n+1;
    end
end

end
以上是关于MATLAB 一行代码应用ggtheme主题--plot版的主要内容,如果未能解决你的问题,请参考以下文章