数据挖掘任务-根据前面教程复现ssGSEA热图
Posted 生信菜鸟团
tags:
篇首语:本文由小常识网(cha138.com)小编为大家整理,主要介绍了数据挖掘任务-根据前面教程复现ssGSEA热图相关的知识,希望对你有一定的参考价值。
在前面的学徒实习生数据挖掘任务列表: 信息描述了如何下载基因集,然后使用GSVA包进行ssGSEA分析后可视化,为了考验大家学习效果,我们布置一个新的图表复现:
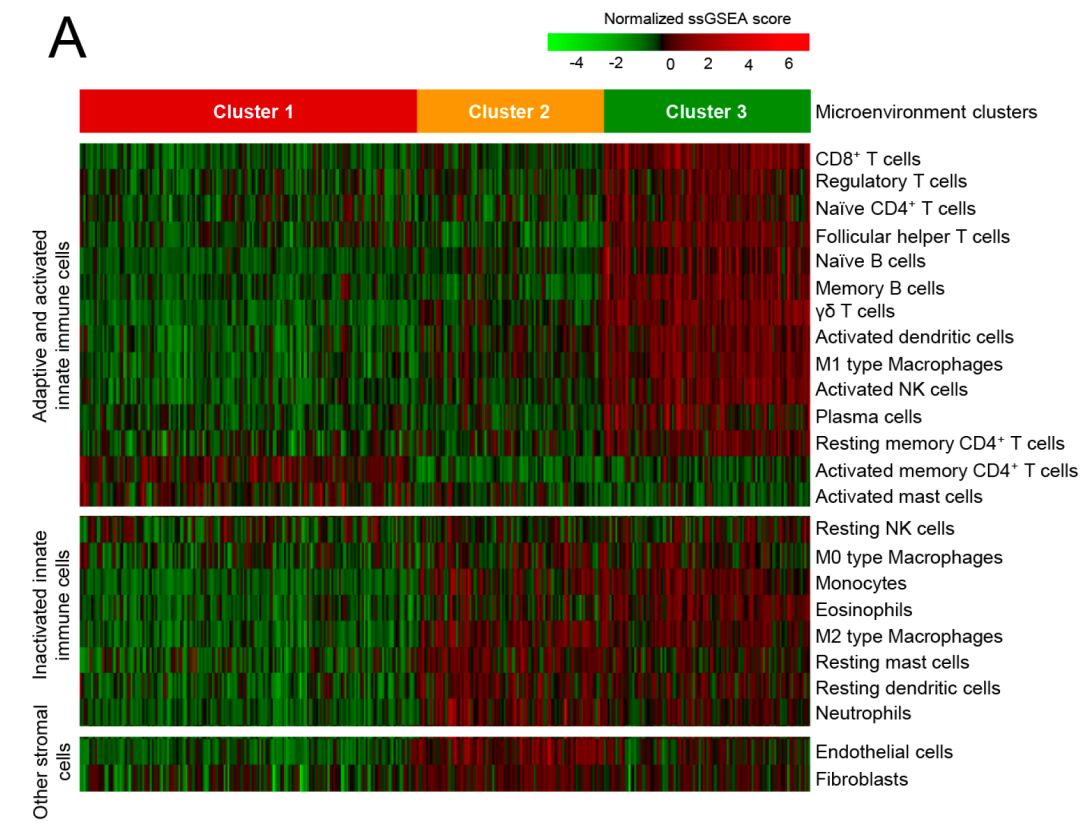
来自于文章:Multi-omics profiling reveals distinct microenvironment characterization and suggests immune escape mechanisms of triple-negative breast cancer 里面提到了数据:
The sequencing data is also available in GSE118527 (OncoScan), GSE76250 (HTA 2.0) and SRP157974 (WES and RNAseq)
主要是使用RNA-seq和HTA2.0芯片的表达数据,根据ssGSEA的结果对样本进行分组,然后讲故事这样的分组的意义。
TNBC分型历史
看到很多媒体宣传最难治的乳腺癌有望获得分类治疗,但是其实TNBC分子分型的研究不少了,复旦大学邵志敏团队2019发表的这个中国人TNBC队列既不是第一个,也不会是最后一个。
首先是2011的meta分析,把TNBC分成6类:Basal-like 1 (BL1), basal-like 2 (BL2), immunomodulatory (IM), mesenchymal (M), mesenchymal stem-like (MSL) and luminal androgen receptor (LAR)
然后同样的作者2016年在plos one 发文重新修订了 之前的分类,变成4类:(TNBCtype-4) tumor-specific subtypes (BL1, BL2, M and LAR)
发表在Clin Cancer Res 2015 ,贝勒医学院研究小组的 Burstein 等人对自己的数据,198个TNBC病人芯片表达矩阵,使用80个核心基因进行分组,得到4个TNBC的亚型。
发表在 Breast Cancer Research (2015) :Gene-expression molecular subtyping of triple-negative breast cancer tumours: importance of immune response,数据在 GSE58812, 法国研究团队的等人使用 适应性的Fuzzy-clustering 把107个TNBC 患者分成3类。
使用ssGSEA算法对CIBERSORT的免疫基因集进行分析
本文使用的数据在 GSE76250 可以下载,分析流程如下:

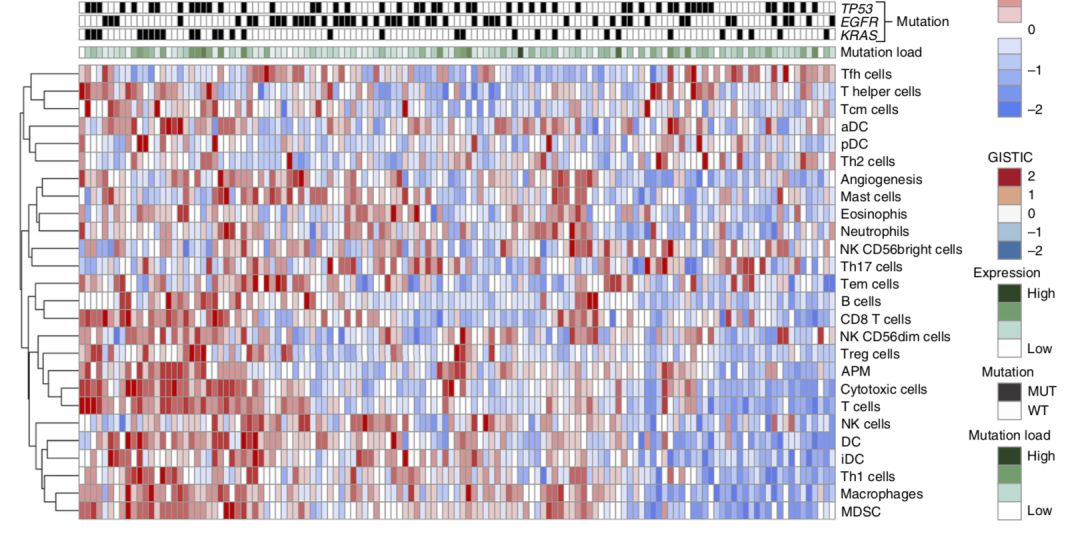
发表在:Nat Commun. 2019 Apr,是中国肺癌研究领域比较出名的吴一龙课题组文章图表:

使用ssGSEA算法计算26 immune cell types比例
这26个基因集来源于文章 Immunity. 2013 Oct , 分类如下;
11个是adaptive immunity
12个是 for innate immunity
3个是 for MDSC,angiogenesis, and antigen presentation machinery
使用GSVA包的ssGSEA算法,对z-score后的RNA-seq表达矩阵进行分析。有趣的是作者提供了RPKM矩阵哦,The RNA-seq FPKM data have been deposited at figshare (https://doi.org/10.6084/m9.figshare.7306364.v1). 所以理论上可以重现作者的分析。
可以把病人分成3组不同的免疫状态,主要是看 IFNG, PD-L1, PD-1, and CD8 基因的表达
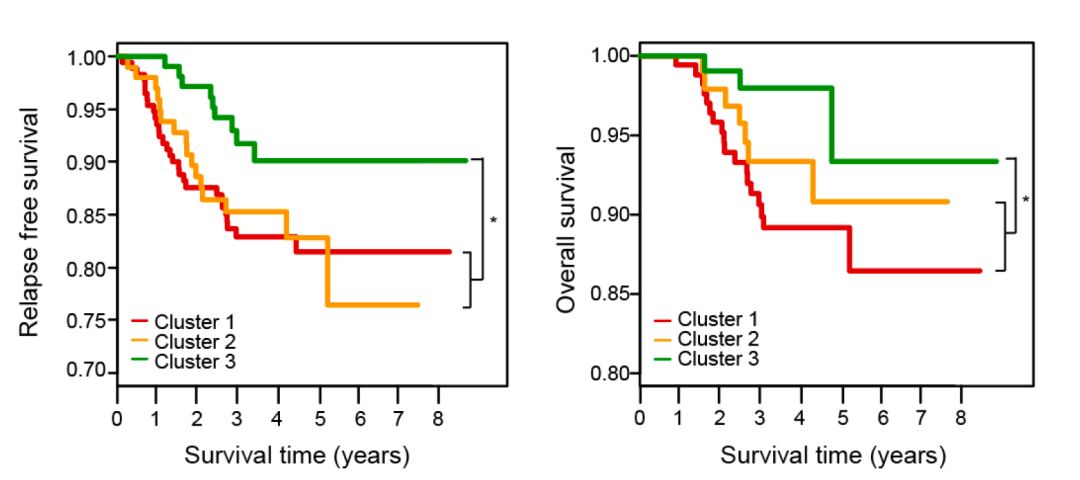
分型具有生存效果

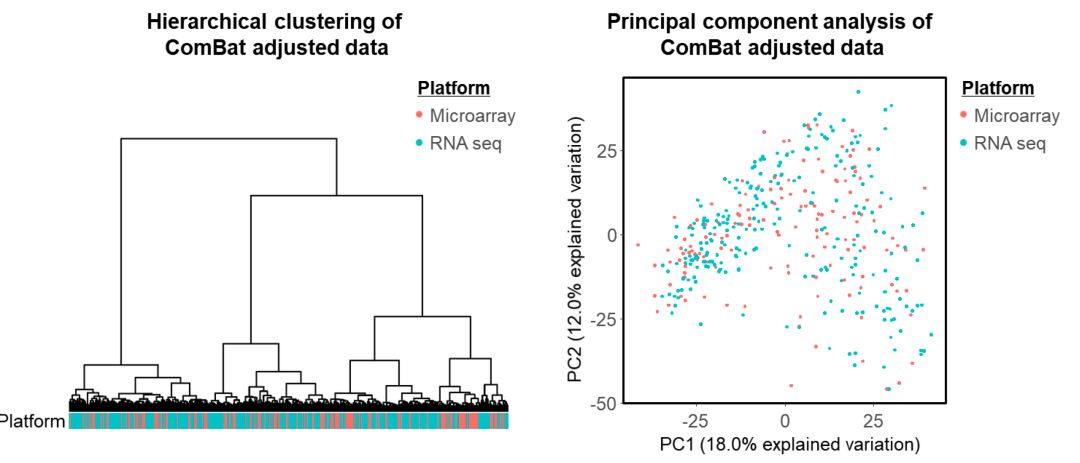
RNA-seq和HTA2.0芯片的表达数据的比较
这里使用ComBat算法抹去两个平台的差异

在TNBC队列验证
同样也是分成3类:
在METABRIC队列验证
也可以区分成为3类,图片在文章里面的附件!
附件图片
Supplementary Figure 1. Workflow of our research.
Supplementary Figure 2. Estimation of the optimal clustering numbers of triple-negative breast cancer microenvironment phenotypes.
Supplementary Figure 3. Validation of microenvironment phenotypes clustering in METABRIC cohort.
Supplementary Figure 4. Validation of microenvironment phenotypes clustering in TCGA cohort.
Supplementary Figure 5. Comparison of potential molecules involved in the initiation of innate immunity among microenvironment clusters in FUSCCTNBC cohort.
Supplementary Figure 6. SNV and indel neoantigen load of the three microenvironment clusters in triple-negative breast cancer.
Supplementary Figure 7. Chromosome instability of the three microenvironment clusters in triple-negative breast cancer.
Supplementary Figure 8. Cancer testis antigen landscape of triple-negative breast cancer.
Supplementary Figure 9. Gene set enrichment analysis of enriched pathways in each cluster.
Supplementary Figure 10. Batch effect evaluation after "Combat" of RNA-seq and HTA microarray datasets.
Supplementary Figure 11. Process and validation of mRNA clustering.
附件表格
Supplementary Table 1. The compendium of microenvironment cell subtypes in triple-negative breast cancer.
Supplementary Table 2. Correlation of estimated microenvironment cell numbers between our compendium and CIBERSORT or MCP-counter.
Supplementary Table 3. Clinicopathological characteristics of three microenvironment phenotypes in FUSCC, METABRIC and TCGA cohort.
Supplementary Table 4. Prognostic value of each cell subset by univariate Cox proportional hazards model for relapse free survival.
Supplementary Table 5. The signatures of ten oncogenic pathways.
Supplementary Table 6. Comparison of gene mutation frequency among clusters.
Supplementary Table 7. Comparison of somatic copy number alterations among clusters.
Supplementary Table 8. GO and KEGG annotation of genes in cluster-specific copy number variation peaks.
两个ssGSEA对免疫基因集的分析后的热图,任君选择!
■ ■ ■
全国巡讲约你
(已结束)
(已结束)
(已结束)
(已结束)
七月份我们不外出,只专注单细胞!
系统学习单细胞分析,报名生信技能树的线下培训,手慢无。
(已经结束)
以上是关于数据挖掘任务-根据前面教程复现ssGSEA热图的主要内容,如果未能解决你的问题,请参考以下文章