OpenCV在车道线查找中的使用
Posted 人人都是极客
tags:
篇首语:本文由小常识网(cha138.com)小编为大家整理,主要介绍了OpenCV在车道线查找中的使用相关的知识,希望对你有一定的参考价值。
本篇是自动驾驶系列的第二篇,在后台留言索取代码会提供源码链接。这次的目标是编写一个软件流水线来识别汽车前置摄像头的视频中的车道边界。摄像机标定图像,试验路图像和视频项目都可以在这里储存。
这次试验的目标/步骤如下:
计算相机校准矩阵和给定一组棋盘图像的失真系数。
对原始图像应用畸变校正。
使用颜色变换,渐变等创建阈值二值图像。
应用透视变换来纠正二值图像(“鸟瞰”)。
检测车道像素,找到车道边界。
确定车道和车辆相对于中心的曲率。
将检测到的车道边界转回到原始图像上。
输出车道边界的视觉显示和车道曲率和车辆位置的数值估计。
相机校准矩阵和失真系数
当照相机查看真实世界中的3D对象并将其转换为2D图像时,会发生图像失真; 这个转变并不完美。失真实际上改变了这些3D对象的形状和大小。因此,分析相机图像的第一步是消除这种失真,以便从中获得正确和有用的信息。
真实的相机使用弯曲的镜头来形成图像,而光线在这些镜头的边缘往往会弯曲得太多或太少。这会产生扭曲图像边缘的效果,使线条或物体看起来或多或少比实际弯曲。这被称为径向失真,这是最常见的失真类型。
另一种失真是切向失真。当相机的镜头没有完全平行于相机胶片或传感器所在的成像平面时,会发生这种情况。这使图像看起来倾斜,使一些物体看起来比实际距离或距离更近。
有三个系数需要校正径向失真:k1,k2和k3,以及2对于切向失真:p1,p2。在这个项目中,使用OpenCV和具有9×6角的棋盘面板来执行相机校准。
import os, glob, pickle
import numpy as np
import cv2
import matplotlib.pyplot as plt
class CameraCalibrator:
    '''Compute the camera calibration matrix and distortion coefficients given a set of chessboard images.'''
    def __init__(self, image_directory, image_filename, binary_filename, nx, ny):
        print ('Initializing CameraCalibrator ...')
        self.__image_directory = image_directory
        self.__image_filename = image_filename
        self.__binary_filename = binary_filename
        self.__nx = nx # the number of inside corners in x
        self.__ny = ny # the number of inside corners in y
        self.mtx = None
        self.dist = None
        self.rvecs = None
        self.tvecs = None
        self.__calibrated = False
    def __calibrate(self):
        # Read in and make a list of calibration images
        calibration_filenames = glob.glob(self.__image_directory+'/'+self.__image_filename)
        # Arrays to store object points and image points from all the images
        object_points = [] # 3D points in real world space
        image_points = [] # 2D points in image plane
        # Prepare object points, like (0,0,0), (1,0,0), (2,0,0), ...,(7,5,0)
        object_p = np.zeros((self.__ny*self.__nx,3),np.float32)
        object_p[:,:2] = np.mgrid[0:self.__nx,0:self.__ny].T.reshape(-1,2) # s,y coordinates
        # Extract the shape of any image
        image = cv2.imread(calibration_filenames[1])
        gray = cv2.cvtColor(image, cv2.COLOR_BGR2GRAY)
        shape = gray.shape[::-1] # (width,height)
        # Process each calibration image
        for image_filename in calibration_filenames:
            # Read in each image
            image = cv2.imread(image_filename)
            image = cv2.cvtColor(image, cv2.COLOR_BGR2RGB) # RGB is standard in matlibplot
            # Convert to grayscale
            gray = cv2.cvtColor(image, cv2.COLOR_RGB2GRAY)
            # Find the chessboard corners
            ret, corners = cv2.findChessboardCorners(gray, (self.__nx, self.__ny), None)
            # If found, draw corners
            if ret == True:
                # Store the corners found in the current image
                object_points.append(object_p) # how it should look like
                image_points.append(corners) # how it looks like
                # Draw and display the corners
                cv2.drawChessboardCorners(image, (self.__nx, self.__ny), corners, ret)
                plt.figure()
                plt.imshow(image)
                plt.show()
        # Do the calibration
        ret, mtx, dist, rvecs, tvecs = cv2.calibrateCamera(object_points, image_points, shape, None, None)
        #print(ret, mtx, dist, rvecs, tvecs)
        # Pickle to save time for subsequent runs
        binary = {}
        binary["mtx"] = mtx
        binary["dist"] = dist
        binary["rvecs"] = rvecs
        binary["tvecs"] = tvecs
        pickle.dump(binary, open(self.__image_directory + '/' + self.__binary_filename, "wb"))
        self.mtx = mtx
        self.dist = dist
        self.rvecs = rvecs
        self.tvecs = tvecs
        self.__calibrated = True
    def __load_binary(self):
        '''Load previously computed calibration binary data'''
        with open(self.__image_directory + '/' + self.__binary_filename, mode='rb') as f:
            binary = pickle.load(f)
        self.mtx = binary['mtx']
        self.dist = binary['dist']
        self.rvecs = binary['rvecs']
        self.tvecs = binary['tvecs']
        self.__calibrated = True
    def get_data(self):
        '''Getter for the calibration data. At the first call it gerenates it.'''
        if os.path.isfile(self.__image_directory + '/' + self.__binary_filename):
            self.__load_binary()
        else:
            self.__calibrate()
        return self.mtx, self.dist, self.rvecs, self.tvecs
    def undistort(self, image):
        if  self.__calibrated == False:
            self.get_data()
        return cv2.undistort(image, self.mtx, self.dist, None, self.mtx)
    def test_undistort(self, image_filename, plot=False):
        '''A method to test the undistort and to plot its result.'''
        image = cv2.imread(image_filename)
        image = cv2.cvtColor(image, cv2.COLOR_BGR2RGB) # RGB is standard in matlibplot
        image_undist = self.undistort(image)
        # Ploting both images Original and Undistorted
        f, (ax1, ax2) = plt.subplots(1, 2, figsize=(20,10))
        ax1.set_title('Original/Distorted')
        ax1.imshow(image)
        ax2.set_title('Undistorted')
        ax2.imshow(image_undist)
        plt.show()
开始准备“对象点”,这将是世界上棋盘角的(x,y,z)坐标。在这里,我假设棋盘固定在z = 0处的(x,y)平面上,使得每个校准图像的目标点是相同的。因此,objp只是一个复制的坐标数组,每当我成功检测到测试图像中的所有棋盘角时,objpoints都会附加一个副本。每个成功的棋盘检测将会在图像平面中的每个角落附加(x,y)像素位置。
然后,我使用输出对象和imgpoint来使用OpenCV cv2.calibrateCamera()函数来计算相机校准和失真系数。我使用cv2.undistort()函数将此畸变校正应用于测试图像,并获得了以下结果:
该步骤的代码包含在文件“./camera_calibration.py”中。将这一步应用于一个示例图像,你会得到这样的结果:

使用颜色变换,渐变等创建阈值二值图像
使用颜色和渐变阈值的组合来生成二进制图像,方法compute_binary_image()可以在lane_detection.py中找到。有各种颜色和梯度阈值的组合来生成车道线清晰可见的二值图像。
def compute_binary_image(self, color_image, plot=False):
        # Convert to HLS color space and separate the S channel
        # Note: img is the undistorted image
        hls = cv2.cvtColor(color_image, cv2.COLOR_RGB2HLS)
        s_channel = hls[:,:,2]
        # Grayscale image
        # NOTE: we already saw that standard grayscaling lost color information for the lane lines
        # Explore gradients in other colors spaces / color channels to see what might work better
        gray = cv2.cvtColor(color_image, cv2.COLOR_RGB2GRAY)
        # Sobel x
        sobelx = cv2.Sobel(gray, cv2.CV_64F, 1, 0) # Take the derivative in x
        abs_sobelx = np.absolute(sobelx) # Absolute x derivative to accentuate lines away from horizontal
        scaled_sobel = np.uint8(255*abs_sobelx/np.max(abs_sobelx))
        # Threshold x gradient
        thresh_min = 20
        thresh_max = 100
        sxbinary = np.zeros_like(scaled_sobel)
        sxbinary[(scaled_sobel >= thresh_min) & (scaled_sobel <= thresh_max)] = 1
        # Threshold color channel
        s_thresh_min = 170
        s_thresh_max = 255
        s_binary = np.zeros_like(s_channel)
        s_binary[(s_channel >= s_thresh_min) & (s_channel <= s_thresh_max)] = 1
        # Combine the two binary thresholds
        combined_binary = np.zeros_like(sxbinary)
        combined_binary[(s_binary == 1) | (sxbinary == 1)] = 1
        if (plot):
            # Ploting both images Original and Binary
            f, (ax1, ax2) = plt.subplots(1, 2, figsize=(20,10))
            ax1.set_title('Undistorted/Color')
            ax1.imshow(color_image)
            ax2.set_title('Binary/Combined S channel and gradient thresholds')
            ax2.imshow(combined_binary, cmap='gray')
            plt.show()
        return combined_binary
这是我为这一步输出的一个例子。

应用透视变换来纠正二值图像(“鸟瞰”)
接下来,我们要为透视变换确定四个源点。在这种情况下,我们可以假设道路是平面的。这不是严格的,但它可以作为这个项目的近似值。我们希望从上面俯瞰道路时,选取四个梯形(类似于区域遮挡)的点,这个梯形代表一个矩形。
要做到这一点,最简单的方法是调查车道线是直线的图像,并找到沿线的四个点,在透视变换之后,从鸟瞰视角使线看起来笔直且垂直。
我的透视变换的代码包括2个函数调用compute_perspective_transform()和apply_perspective_transform(),这出现在文件中lane_detection.py。所述compute_perspective_transform()构建的变换矩阵M通过使用apply_perspective_transform()变换的二进制图像。
def compute_perspective_transform(self, binary_image):
        # Define 4 source and 4 destination points = np.float32([[,],[,],[,],[,]])
        shape = binary_image.shape[::-1] # (width,height)
        w = shape[0]
        h = shape[1]
        transform_src = np.float32([ [580,450], [160,h], [1150,h], [740,450]])
        transform_dst = np.float32([ [0,0], [0,h], [w,h], [w,0]])
        M = cv2.getPerspectiveTransform(transform_src, transform_dst)
        return M
def apply_perspective_transform(self, binary_image, M, plot=False):
        warped_image = cv2.warpPerspective(binary_image, M, (binary_image.shape[1], binary_image.shape[0]), flags=cv2.INTER_NEAREST)  # keep same size as input image
        if(plot):
            # Ploting both images Binary and Warped
            f, (ax1, ax2) = plt.subplots(1, 2, figsize=(20,10))
            ax1.set_title('Binary/Undistorted and Tresholded')
            ax1.imshow(binary_image, cmap='gray')
            ax2.set_title('Binary/Undistorted and Warped Image')
            ax2.imshow(warped_image, cmap='gray')
            plt.show()
        return warped_image
以下面的方式选择硬编码的源和目标点:
transform_src = np.float32([ [580,450], [160,h], [1150,h], [740,450]])
transform_dst = np.float32([ [0,0], [0,h], [w,h], [w,0]])
这两个方法的输出如下所示:

检测车道像素,找到车道边界
现在有一个阈值扭曲的图像,我们准备绘制出车道线!有很多方法可以解决这个问题,但是在直方图中使用峰值效果很好。
在对道路图像进行校准,阈值处理和透视变换之后,我们应该有一个二值图像,车道线清晰可见。但是,我们仍然需要明确地确定哪些像素是线的一部分,哪些属于左边线,哪些属于右边线。
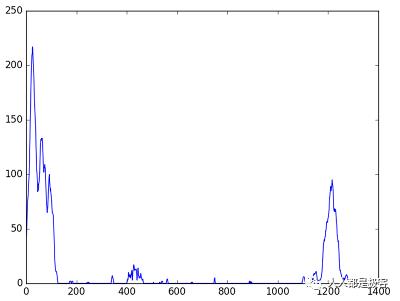
我首先沿着图像下半部分的所有列采用直方图,如下所示:
import numpy as np
histogram = np.sum(img[img.shape[0]/2:,:], axis=0)
plt.plot(histogram)

使用这个直方图,我将图像中每列的像素值相加。在我的阈值二进制图像中,像素是0或1,所以这个直方图中最突出的两个峰值将成为车道线底部x坐标的良好指标。我可以用它作为寻找线条的起点。从这一点上,我可以使用一个滑动的窗口,放置在线条中心周围,找到并遵循框架顶部的线条。
def extract_lanes_pixels(self, binary_warped):
        # Take a histogram of the bottom half of the image
        histogram = np.sum(binary_warped[binary_warped.shape[0]/2:,:], axis=0)
        #plt.plot(histogram)
        #plt.show()
        # Create an output image to draw on and  visualize the result
        out_img = np.dstack((binary_warped, binary_warped, binary_warped))*255
        # Find the peak of the left and right halves of the histogram
        # These will be the starting point for the left and right lines
        midpoint = np.int(histogram.shape[0]/2)
        leftx_base = np.argmax(histogram[:midpoint])
        rightx_base = np.argmax(histogram[midpoint:]) + midpoint
        # Choose the number of sliding windows
        nwindows = 9
        # Set height of windows
        window_height = np.int(binary_warped.shape[0]/nwindows)
        # Identify the x and y positions of all nonzero pixels in the image
        nonzero = binary_warped.nonzero()
        nonzeroy = np.array(nonzero[0])
        nonzerox = np.array(nonzero[1])
        # Current positions to be updated for each window
        leftx_current = leftx_base
        rightx_current = rightx_base
        # Set the width of the windows +/- margin
        margin = 100
        # Set minimum number of pixels found to recenter window
        minpix = 50
        # Create empty lists to receive left and right lane pixel indices
        left_lane_inds = []
        right_lane_inds = []
        # Step through the windows one by one
        for window in range(nwindows):
            # Identify window boundaries in x and y (and right and left)
            win_y_low = binary_warped.shape[0] - (window+1)*window_height
            win_y_high = binary_warped.shape[0] - window*window_height
            win_xleft_low = leftx_current - margin
            win_xleft_high = leftx_current + margin
            win_xright_low = rightx_current - margin
            win_xright_high = rightx_current + margin
            # Draw the windows on the visualization image
            cv2.rectangle(out_img,(win_xleft_low,win_y_low),(win_xleft_high,win_y_high),(0,255,0), 2)
            cv2.rectangle(out_img,(win_xright_low,win_y_low),(win_xright_high,win_y_high),(0,255,0), 2)
            # Identify the nonzero pixels in x and y within the window
            good_left_inds = ((nonzeroy >= win_y_low) & (nonzeroy < win_y_high) & (nonzerox >= win_xleft_low) & (nonzerox < win_xleft_high)).nonzero()[0]
            good_right_inds = ((nonzeroy >= win_y_low) & (nonzeroy < win_y_high) & (nonzerox >= win_xright_low) & (nonzerox < win_xright_high)).nonzero()[0]
            # Append these indices to the lists
            left_lane_inds.append(good_left_inds)
            right_lane_inds.append(good_right_inds)
            # If you found > minpix pixels, recenter next window on their mean position
            if len(good_left_inds) > minpix:
                leftx_current = np.int(np.mean(nonzerox[good_left_inds]))
            if len(good_right_inds) > minpix:
                rightx_current = np.int(np.mean(nonzerox[good_right_inds]))
        # Concatenate the arrays of indices
        left_lane_inds = np.concatenate(left_lane_inds)
        right_lane_inds = np.concatenate(right_lane_inds)
        # Extract left and right line pixel positions
        leftx = nonzerox[left_lane_inds]
        lefty = nonzeroy[left_lane_inds]
        rightx = nonzerox[right_lane_inds]
        righty = nonzeroy[right_lane_inds]
        return leftx, lefty, rightx, righty, left_lane_inds, right_lane_inds
def poly_fit(self, leftx, lefty, rightx, righty, left_lane_inds, right_lane_inds, binary_warped, plot:False):
        # Fit a second order polynomial to each
        left_fit = np.polyfit(lefty, leftx, 2)
        right_fit = np.polyfit(righty, rightx, 2)
        # Generate x and y values for plotting
        ploty = np.linspace(0, binary_warped.shape[0]-1, binary_warped.shape[0] )
        left_fitx = left_fit[0]*ploty**2 + left_fit[1]*ploty + left_fit[2]
        right_fitx = right_fit[0]*ploty**2 + right_fit[1]*ploty + right_fit[2]
        # Identify the x and y positions of all nonzero pixels in the image
        nonzero = binary_warped.nonzero()
        nonzeroy = np.array(nonzero[0])
        nonzerox = np.array(nonzero[1])
        out_img = np.dstack((binary_warped, binary_warped, binary_warped))*255
        out_img[nonzeroy[left_lane_inds], nonzerox[left_lane_inds]] = [255, 0, 0]
        out_img[nonzeroy[right_lane_inds], nonzerox[right_lane_inds]] = [0, 0, 255]
        if(plot):
            plt.imshow(out_img)
            plt.plot(left_fitx, ploty, color='yellow')
            plt.plot(right_fitx, ploty, color='yellow')
            plt.xlim(0, 1280)
            plt.ylim(720, 0)
            plt.show()
        return left_fit, right_fit, ploty, left_fitx, right_fitx
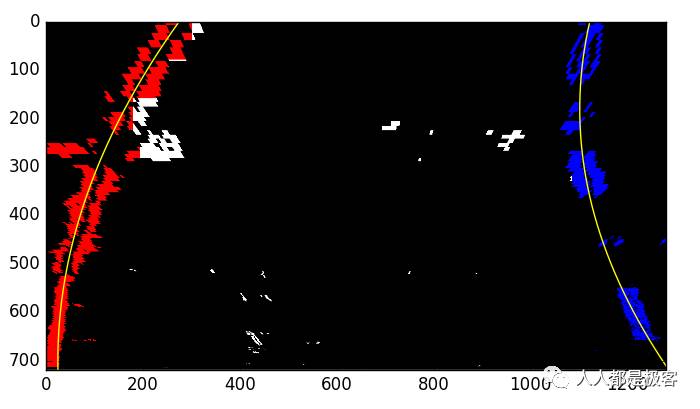
输出应该是这样的:

确定车道和车辆相对于中心的曲率
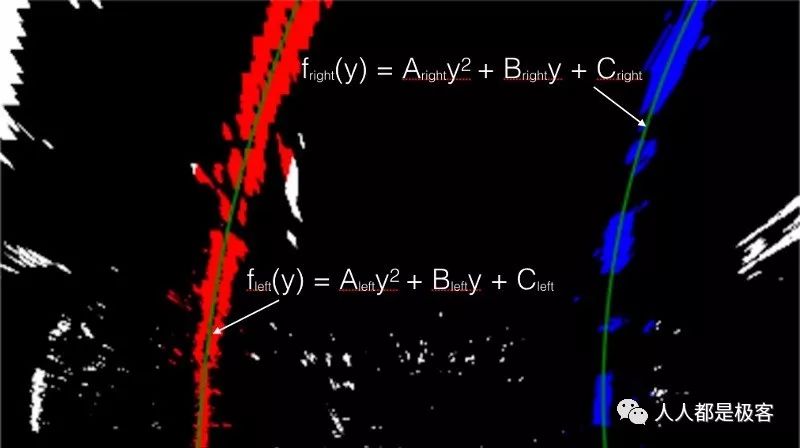
自驾车需要被告知正确的转向角度,左转或右转。如果我们知道汽车的速度和动力以及车道弯曲的程度,我们就可以计算出这个角度。计算车道线曲率的一种方法是将二次多项式拟合到该线上,由此我们可以容易地提取有用的信息。
对于接近垂线的车道线,我们可以用这个公式拟合一条直线:f(y)= Ay ^ 2 + By + C,其中A,B和C是系数。A给出了车道线的曲率,B给出了该线所指向的标题或方向,并且C根据距离图像的最左边多远来给出线的位置(y = 0 )。

执行:
def compute_curvature(self, left_fit, right_fit, ploty, left_fitx, right_fitx, leftx, lefty, rightx, righty):
        # Define conversions in x and y from pixels space to meters
        ym_per_pix = 30/720 # meters per pixel in y dimension
        xm_per_pix = 3.7/700 # meters per pixel in x dimension
        y_eval = np.max(ploty)
        fit_cr_left = np.polyfit(ploty * ym_per_pix, left_fitx * xm_per_pix, 2)
        curverad_left = ((1 + (2 * left_fit[0] * y_eval / 2. + fit_cr_left[1]) ** 2) ** 1.5) / np.absolute(2 * fit_cr_left[0])
        fit_cr_right = np.polyfit(ploty * ym_per_pix, right_fitx * xm_per_pix, 2)
        curverad_right = ((1 + (2 * left_fit[0] * y_eval / 2. + fit_cr_right[1]) ** 2) ** 1.5) / np.absolute(2 * fit_cr_right[0])
        return (curverad_left + curverad_right) / 2
输出车道边界的视觉显示和车道曲率和车辆位置的数值估计
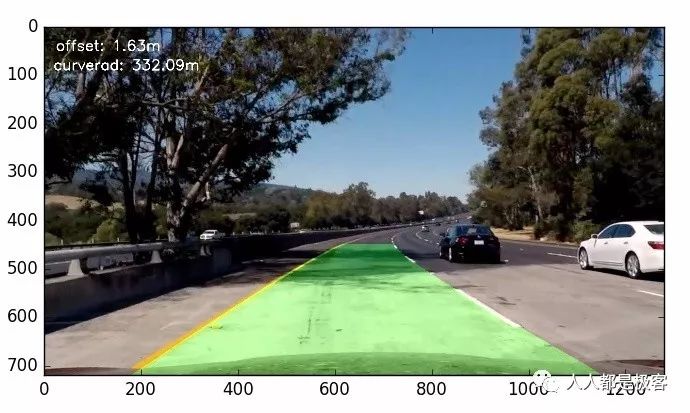
lane_detection.py中的函数render_curvature_and_offset用于将检测到的车道线返回到原始图像上,并使用填充的多边形绘制检测到的车道。它还绘制了图像或视频帧的左上角和底部的曲率和位置。

所有六个测试图像的结果:
轻轻一扫 欢迎关注~
以上是关于OpenCV在车道线查找中的使用的主要内容,如果未能解决你的问题,请参考以下文章