2018-10-31用R绘制散点图矩阵(成对的散点图)
Posted
tags:
篇首语:本文由小常识网(cha138.com)小编为大家整理,主要介绍了2018-10-31用R绘制散点图矩阵(成对的散点图)相关的知识,希望对你有一定的参考价值。
参考技术A 原文见 http://www.win-vector.com/blog/2018/10/scatterplot-matrices-pair-plots-with-cdata-and-ggplot2/散点图矩阵就是把数据集中的每个数值变量两两绘制散点图。基础的R包,绘图函数是pairs()。这是基础包绘制的iris数据集的一个例子:
另外的绘图方式还有几种。
用R包中cdata绘制一下散点矩阵图
首先是加载相关的R包
然后按照需求重塑数据
然后用facet_grid创建图形
R语言绘图:复杂散点图绘制
散点图用于描述两个连续性变量间的关系,三个变量之间的关系可以通过3D图形或气泡来展示,多个变量之间的两两关系可以通过散点图矩阵来展示。
1. 散点图矩阵
1.1 paris()函数
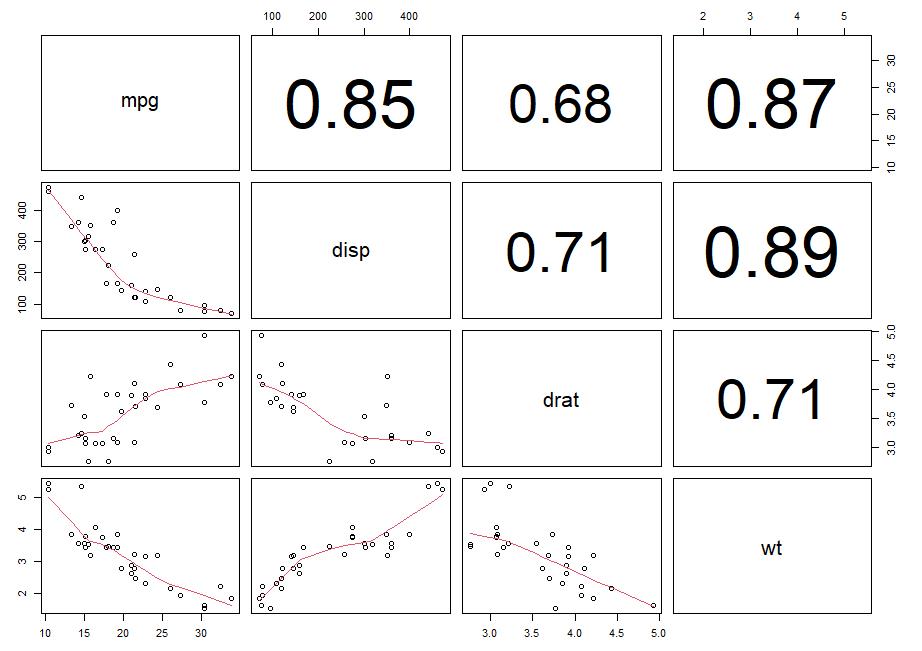
基础函数paris()函数用于创建散点图矩阵,panel.cor()函数是自定义的面板函数(panel function),用于在矩阵的上三角显示相关度;下三角使用系统预定义的平滑函数,用于在矩阵的下三角显示散点图和平滑曲线。
panel.cor <- function(x, y, digits = 2, prefix = "", cex.cor, ...)
{
  usr <- par("usr")
  on.exit(par(usr))
  par(usr = c(0, 1, 0, 1))
  r <- abs(cor(x, y))
  txt <- format(c(r, 0.123456789), digits = digits)[1]
  txt <- paste0(prefix, txt)
  if(missing(cex.cor)) cex.cor <- 0.8/strwidth(txt)
  text(0.5, 0.5, txt, cex = cex.cor * r)
}

pairs(~ mpg + disp + drat + wt, data = mtcars,
      lower.panel = panel.smooth,
      upper.panel = panel.cor)
1.2 scatterplotMatrix()函数
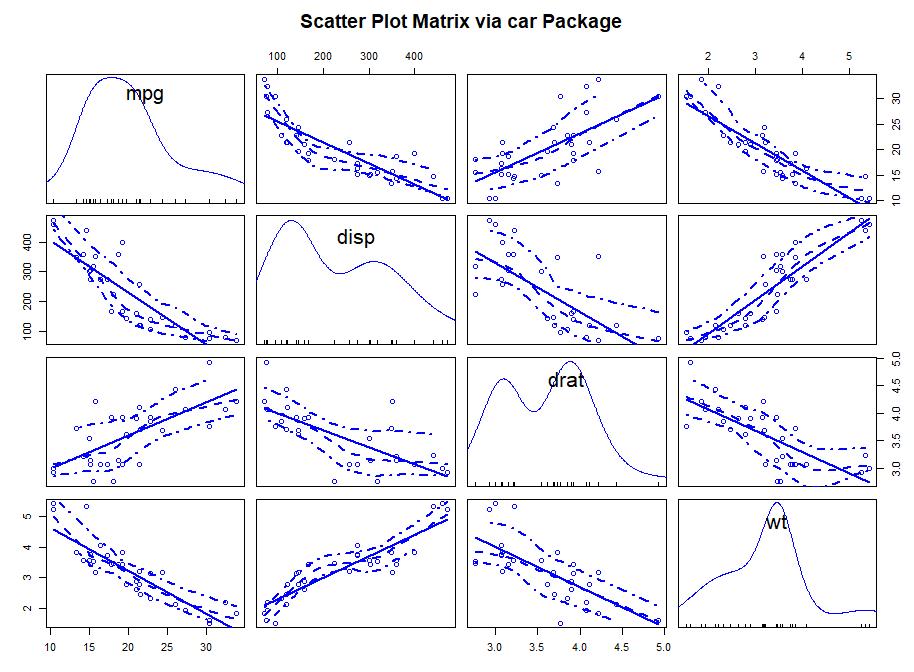
car包中的scatterplotMatrix()函数,用于生成散点图矩阵,实际上,该函数是pairs()的封装器,用于产生增强的散点图矩阵,spm是该函数的别名。
scatterplotMatrix(x,
    diagonal=c("density", "boxplot", "histogram", "oned", "qqplot", "none"), adjust=1, nclass,
    plot.points=TRUE, smoother=loessLine, smoother.args=list(), smooth, span,
    spread = !by.groups, reg.line=lm,
    transform=FALSE, family=c("bcPower", "yjPower"),
    ellipse=FALSE, levels=c(.5, .95), robust=TRUE,
    groups=NULL, by.groups=FALSE,
    use=c("complete.obs", "pairwise.complete.obs"),
    labels, id.method="mahal", id.n=0, id.cex=1, id.col=palette()[1], id.location="lr",
    col=if (n.groups == 1) palette()[3:1] else rep(palette(), length=n.groups),
    pch=1:n.groups, lwd=1, lty=1,
    cex=par("cex"), cex.axis=par("cex.axis"), cex.labels=NULL,
    cex.main=par("cex.main"),
    legend.plot=length(levels(groups)) > 1, legend.pos=NULL, row1attop=TRUE, ...)

## 参数注释:
diagonal # 对角线面板显示的内容,
adjust # 用于密度估计的相对带宽(relative bandwidth),传递给density()函数
nclass # 直方图的封箱的数量,传递给hist()函数
plot.points # 是否在非对角线绘制点,默认值是TRUE
smoother # 用于制定函数,用于绘制平滑曲线,默认值是gamLine()函数,其他有效值是:loessLine,quantregLine
smoother.args # 传递给smoother函数的参数,是一个list类型,
# 如smoother.args==list(lty=2) 表示设置平滑(loess)拟合曲线使用虚线,而不是实线
smooth, span # 这两个参数是为了向后兼容,如果该参数设置为TRUE(默认值),那么smooter设置为LoessLine,使用LoessLine()函数绘制平滑曲线。
# 如果设置span,那么该参数会被添加到smoother.args中。
spread # 是否添加用于展示分散度和对称信息的直线,默认值是by.groups参数值取反。
reg.line # 默认值是lm,用于制定绘制回归直线的函数
ellipse # 在非对角线绘制数据密度椭圆
groups # 对数据分组
by.groups # 如果设置为TRUE,那么回归直线按照分组来拟合(fit)
例如:使用mtcars数据集来绘制散点图:
library(car)
scatterplotMatrix( ~ mpg + disp + drat + wt, data = mtcars,
                  spread = FALSE, smoother.args = list(lty=2),
                  main='Scatter Plot Matrix via car Package')
2. 高密度散点图
2.1 smoothScatter()函数
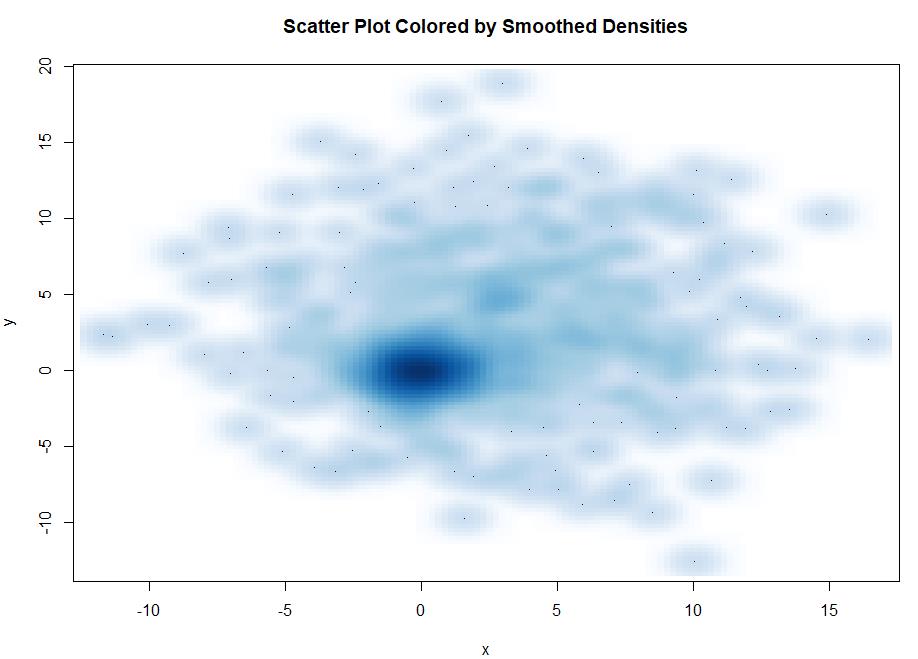
基础包中的smoothScatter()函数,可以利用核密度估计生成用颜色密度来表示点密度的散点图。
set.seed(1234)
n<-1000
c1 <- matrix(rnorm(n,mean=0,sd=1),ncol = 2)
c2 <- matrix(rnorm(n,mean=3,sd=5),ncol = 2)
mydata <- rbind(c1,c2)
mydata <- as.data.frame(mydata)
names(mydata) <- c('x','y')

with(mydata, smoothScatter(x, y,
main='Scatter Plot Colored by Smoothed Densities'))
2.2 hexbin()函数
hexbin包中hexbin()函数,把二元变量的封箱放到六边形单元格中,xbins是水平封箱的数量:
hexbin(x, y, xbins = 30)
该函数创建了一个hexbin对象,最基本的组成是一个cell和落入每个cell的点的数量count。
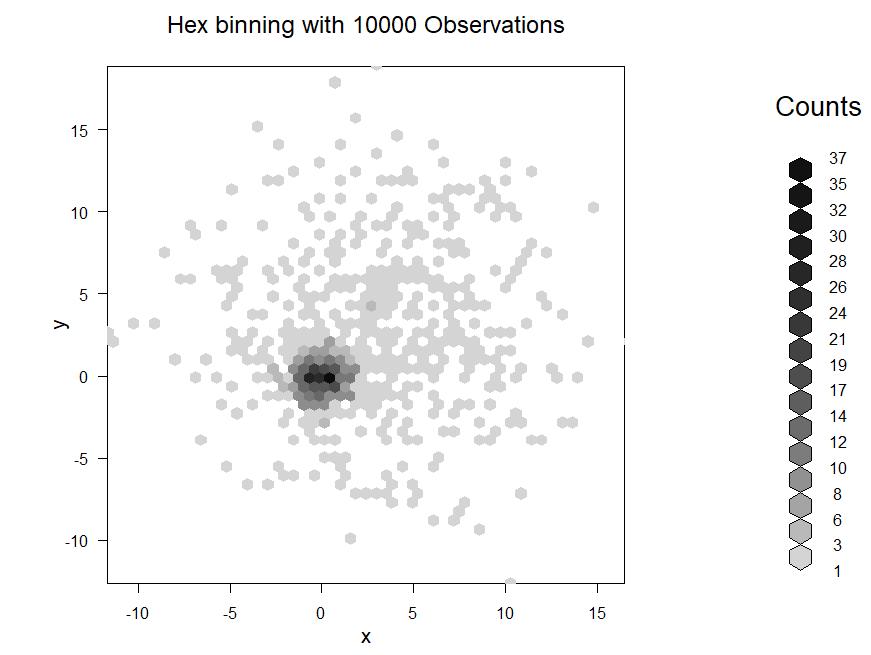
例如,使用hexbin()来绘制高密度散点图,六边形的颜色深度表示散点的密度。
install.packages("hexbin")
library(hexbin)
with(mydata,
     {bin <- hexbin(x,y,xbins=50)
     plot(bin,main='Hex binning with 10000 Observations')})
3. 三维散点图
三维散点图用于对三个变量之间的交互关系进行可视化,scatterplot3d包中的函数scatterplot3d(),可以用于绘制三维散点图:
scatterplot3d(x, y=NULL, z=NULL, color=par("col"), pch=par("pch"),
    main=NULL, sub=NULL, xlim=NULL, ylim=NULL, zlim=NULL,
    xlab=NULL, ylab=NULL, zlab=NULL, scale.y=1, angle=40,
    axis=TRUE, tick.marks=TRUE, label.tick.marks=TRUE,
    x.ticklabs=NULL, y.ticklabs=NULL, z.ticklabs=NULL,
    y.margin.add=0, grid=TRUE, box=TRUE, lab=par("lab"),
    lab.z=mean(lab[1:2]), type="p", highlight.3d=FALSE,
    mar=c(5,3,4,3)+0.1, bg=par("bg"), col.axis=par("col.axis"),
    col.grid="grey", col.lab=par("col.lab"),
    cex.symbols=par("cex"), cex.axis=0.8 * par("cex.axis"),
    cex.lab=par("cex.lab"), font.axis=par("font.axis"),
    font.lab=par("font.lab"), lty.axis=par("lty"),
    lty.grid=par("lty"), lty.hide=NULL, lty.hplot=par("lty"),
    log="", asp=NA, ...)

# 参数注释:
x,y,z # 图形的三个坐标
color # 点的颜色
main,sub # 主标题和小标题
xlim,ylim,zlim # 用于指定(min,max),用于限制坐标轴上点的范围。
xlab,ylab,zlab # 各个坐标轴的标签
scale.y # y轴相对于x和z的标度
angle # x和y轴之间的角度
axis # 是否绘制坐标轴
tick.marks, label.tick.marks, x.ticklabs, y.ticklabs, z.ticklabs # 刻度,刻度值
type # 用于指定点的类型,p是点,l是线,h是在x-y平面中的垂线
highlight.3d # 当type = "p" 或 type = "h" 时,根据y坐标把点绘制成不同的颜色;
# 其他情况下,使用color参数的值来绘制点的颜色。
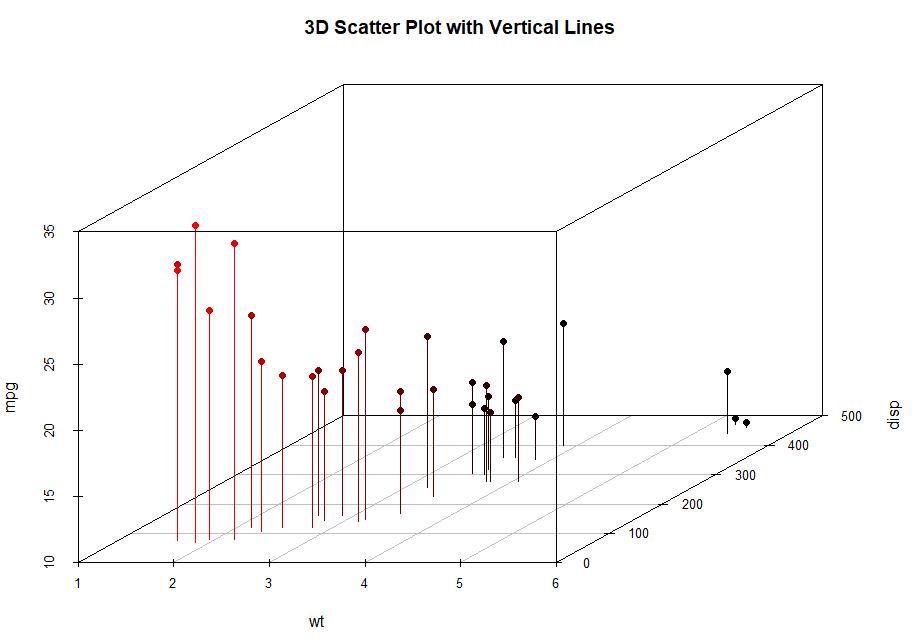
例如利用mtcars数据集,绘制wt,disp和mpg之间的三维散点图:
install.packages("scatterplot3d")
library(scatterplot3d)
with(mtcars, # 数据集
     scatterplot3d(wt,disp,mpg, # 绘制图形的三个变量
              pch=16, # 设置绘图符号
              highlight.3d = TRUE,
              type='h',
              main='3D Scatter Plot with Vertical Lines'))
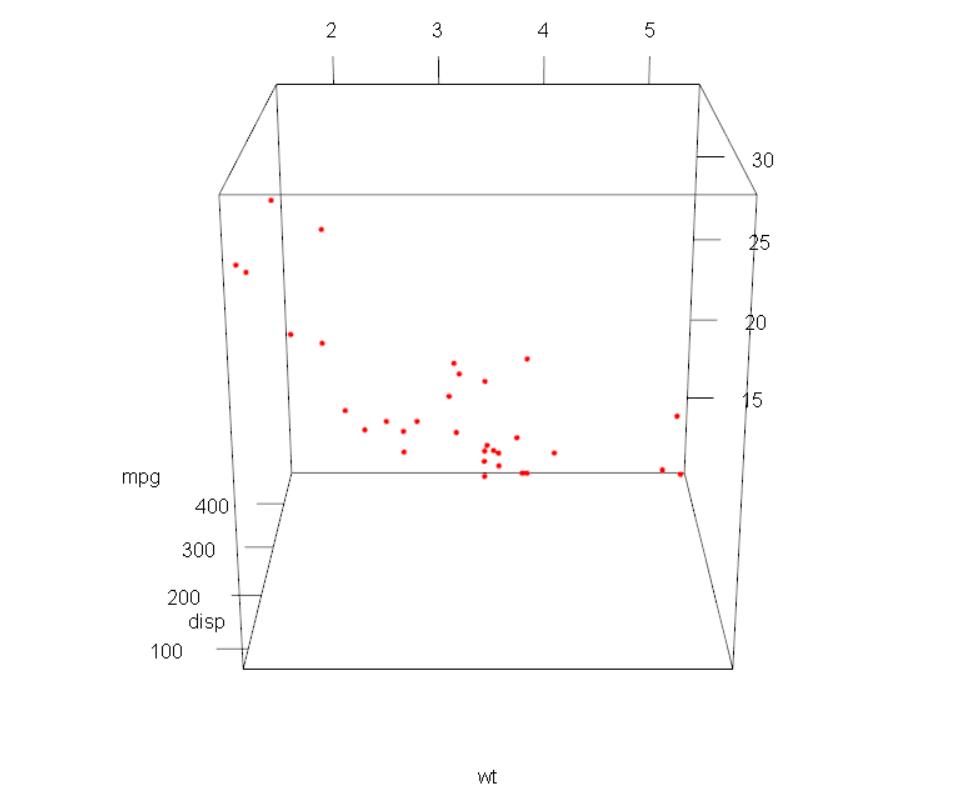
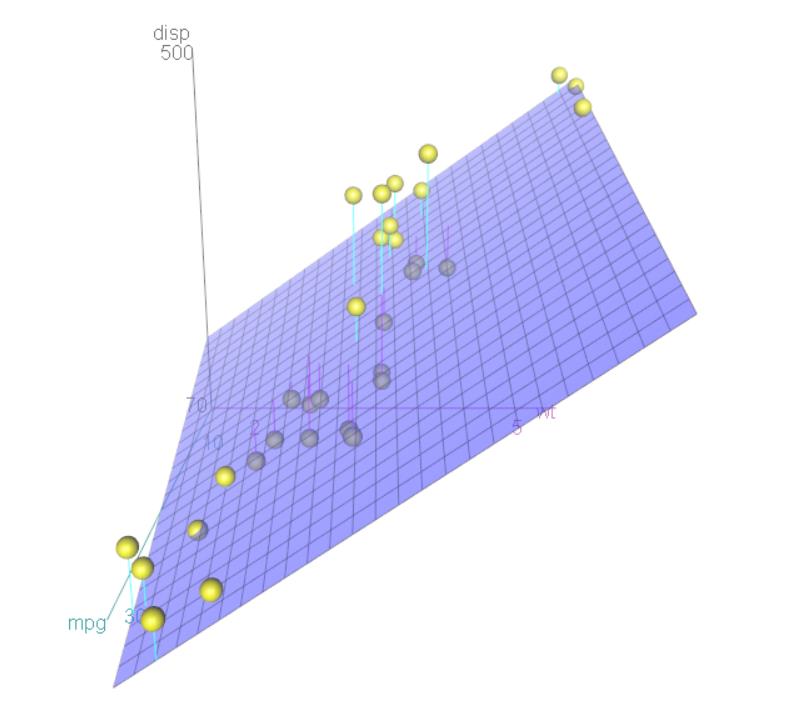
可旋转的3D散点图:
library(rgl)
with(mtcars,
     plot3d(wt,disp,mpg,col='red',size=5))

library(car)
with(mtcars,scatter3d(wt,disp,mpg))
4. 气泡图
使用气泡图来展示三个变量之间的关系,先创建一个二维散点图,然后用点的大小来代表第三个变量的值。
基础包中的symbols()函数用于绘制气泡图:
symbols(x, y = NULL, circles=radius, squares, rectangles, stars, inches = TRUE,
        fg = par("col"), bg = NA,
        xlab = NULL, ylab = NULL, main = NULL,
        xlim = NULL, ylim = NULL, ...)

## 参数注释:
x,y,circles # circles用于指定气泡的半径
inches # 比例因子,控制气泡的大小(默认最大圆圈为1 inch)
参考资料
-
https://www.rdocumentation.org/packages/car/versions/2.1-6/topics/scatterplotMatrix

独阅乐不如众阅乐
以上是关于2018-10-31用R绘制散点图矩阵(成对的散点图)的主要内容,如果未能解决你的问题,请参考以下文章
R语言ggplot2可视化散点图实战:绘制基础散点图为所有散点添加标签只为大于阈值的散点添加标签