开发工具Valgrind内存问题检测工具(valgrind)的使用
Posted Evan_ZGYF丶
tags:
篇首语:本文由小常识网(cha138.com)小编为大家整理,主要介绍了开发工具Valgrind内存问题检测工具(valgrind)的使用相关的知识,希望对你有一定的参考价值。
关键字:
【valgrind】、【内存泄露】、【内存越界】、【非法指针】、【】、【】、
获取更多相关的嵌入式开发工具,可收藏系列博文,持续更新中:
【开发工具】嵌入式常用开发工具汇总帖
安装Valgrind
下载Valgrind及其依赖库
1.安装glibc库(依赖库)、gawk、bison
glibc-2.31.tar.gz
https://ftp.gnu.org/gnu/glibc/glibc-2.31.tar.gz
bison-3.7.tar.xz
http://ftp.gnu.org/gnu/bison/bison-3.7.tar.xz
gawk-5.1.0.tar.xz
http://ftp.gnu.org/gnu/gawk/gawk-5.1.0.tar.xz

2.下载valgrind 3.16.1
https://sourceware.org/pub/valgrind/valgrind-3.16.1.tar.bz2
安装Valgrind及其依赖库
安装valgrind
解压缩
tar -vxjf valgrind-3.16.1.tar.bz2

注:小技巧:Linux下一般压缩文件后缀为.tar.bz2和.tar.gz,
它们解压命令有两三个选项是一致的:
xf(v),前者再加上j选项,后者再加上z选项。

进入目录
cd valgrind-3.16.1

配置
ax630a:
    CC=aarch64-linux-gnu-gcc ./configure --host=aarch64-linux-gnu --target=aarch64-linux-gnu --program-prefix=aarch64-linux-gnu- --prefix=$(pwd)/../output/ax630a
开发机:
	./configure --with-pcap=linux --prefix=$(pwd)/../output/pc

 编译参数说明:
1)	CC:编译gdb使用的交叉编译工具链,3536和3519的工具不一样
2)	--host:编译出来的gdb运行在什么机器上
3)	--target:要调试的目标板
4)	--program-prefix:编译生成可执行文件的前缀
5)	--prefix:make install的的位置
注:–target=arm-linux意思是说目标平台是运行于ARM体系结构的linux内核;–program-prefix=arm-linux-是指生成的可执行文件的前缀,
比如arm-linux-gdb,–prefix是指生成的可执行文件安装在哪个目录,这个目录需要根据实际情况作选择。如果该目录不存在,会自动创建,当然,权限足够的话。

编译、安装
make -j16

make install

运行valgrind
拷贝
/bin/xxx_valgrind
/lib/*
到设备上

需要导出VALGRIND_LIB路径,用法以下(假设valgrind已经被安装到/home/fw/lib/valgrind目录):
export VALGRIND_LIB=/home/fw/lib/valgrind

chmod 777 /home/fw/lib/valgrind

# ./valgrind
valgrind: no program specified
valgrind: Use --help for more information.
Valgrind使用说明
Valgrind工具简介
Valgrind是一套Linux下,开放源代码(GPL V2)的仿真调试工具的集合。
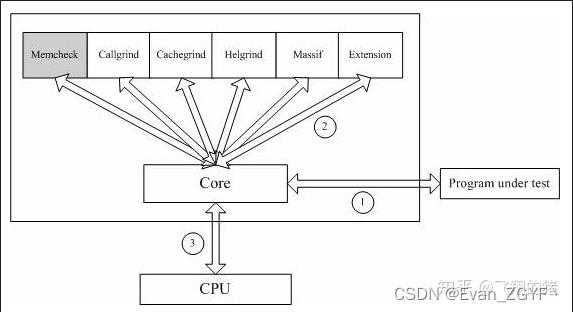
Valgrind由内核(core)以及基于内核的其他调试工具组成。
内核类似于一个框架(framework),它模拟了一个CPU环境,并提供服务给其他工具;
而其他工具则类似于插件 (plug-in),利用内核提供的服务完成各种特定的内存调试任务。
valgrind支持的工具:
memcheck
addrcheck
cachegrind
Cache分析器,它模拟CPU中的一级缓存I1,Dl和二级缓存,
能够精确地指出程序中cache的丢失和命中。
如果需要,它还能够为我们提供cache丢失次数,内存引用次数,
以及每行代码,每个函数,每个模块,整个程序产生的指令数。
这对优化程序有很大的帮助。
Massid
堆栈分析器,能测量程序在堆栈中使用了多少内存
helgrind
查找多线程中的竞争数据寻找内存中被多个线程访问,而又没有一贯加锁的区域,
这些区域往往是线程之间失去同步的地方,而且会导致难以发掘的错误。
Callgrind
收集程序运行时的一些数据,函数调用关系等信息,
可以有选择的进行cache模拟,在运行结束后,它会把分析数据写入一个文件,
callgrind_annotate可以吧这个文件的内容转化成可读的形式
运行时必须指明想用的工具,如果省略工具名,默认运行memcheckValgrind的体系结构如下图所示:
valgrind的原理
通过维护一张合法值表(Valid-value (V) bits),指示对应的bit是否已经被赋值。因为虚拟CPU可以捕获所有对内存的写指令,所以这张表很容易维护。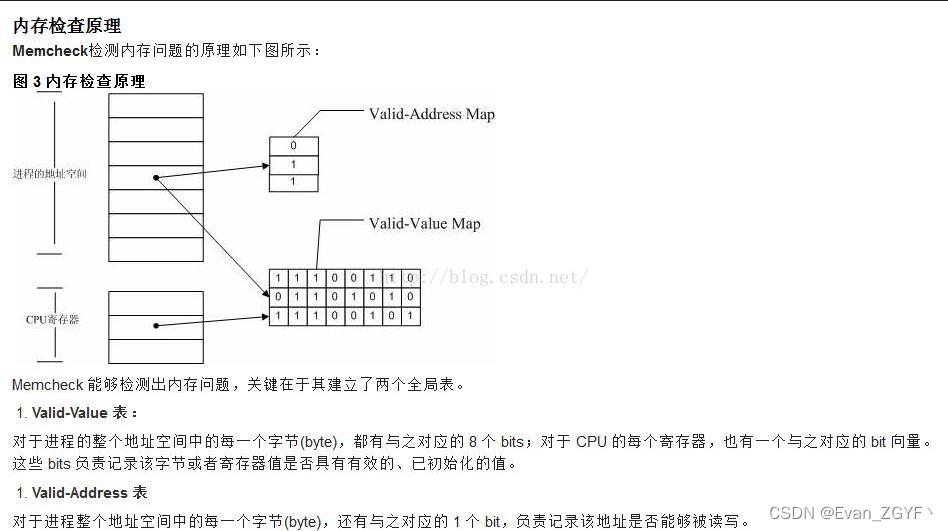
valgrind参数说明
valgrind命令的格式如下:
       valgrind  [valgrind-options]  your-prog  [your-prog options]
参数说明:
    --leak-check=<no|summary|yes|full> [default:summary]
         no,不检测内存泄漏;
        summary,仅报告总共泄漏的数量,不报告具体泄漏位置;
        yes/full,报告泄漏总数、泄漏的具体位置。
    --show-reachable=<yes|no> [default: no]
        用于控制是否检测控制范围之外的泄漏,比如全局指针、static指针等。
    --undef-value-errors=<yes|no> [default: yes]
        用于控制是否检测代码中使用未初始化变量的情况。
    --log-file=filename
        将结果输出到文件。
    --log-socket=192.168.0.1:12345 输出到网络。
    --trace-children=<yes|no> [default: no]
    --track-fds=<yes|no> [default: no]
    --log-fd=<number> [default: 2, stderr]
    --xml=<yes|no> [default: no]
    --num-callers=<number> [default: 12]
    --show-below-main=<yes|no> [default: no]


举例:
valgrind  --leak-check=full  --log-file=[file].log  --error-limit=no [bin]
参数说明:
    --leak-check=full 信息显示具体泄漏位置
        --leak-check=<no|summary|yes|full> [default:summary]
             no,不检测内存泄漏;
            summary,仅报告总共泄漏的数量,不报告具体泄漏位置;
            yes/full,报告泄漏总数、泄漏的具体位置。
    --log-file=leak.log 将检测信息输入到日志file.log中
    [bin] 需要检测的程序
valgrind错误类型
valgrind(memcheck)包含7类错误

1,illegal read/illegal write errors
    提示信息:[invalid read of size 4]
2,use of uninitialised values
    提示信息:[Conditional jump or move depends on uninitialised value]
3,use of uninitialised or unaddressable values in system calls
    提示信息:[syscall param write(buf) points to uninitilaised bytes]
4,illegal frees
    提示信息:[invalid free()]
5,when a heap block is freed with an inappropriate deallocation function
    提示信息:[Mismatched free()/delete/delete[]]
6,overlapping source and destination blocks
    提示信息:[source and destination overlap in memcpy(,)]
7,memory leak detection
    1),still reachable
    内存指针还在还有机会使用或释放,指针指向的动态内存还没有被释放就退出了
    2),definitely lost
    确定的内存泄露,已经不能访问这块内存
    3),indirectly lost
    指向该内存的指针都位于内存泄露处
    4),possibly lost
    可能的内存泄露,仍然存在某个指针能够快速访问某块内存,但该指针指向的已经不是内存首位置

Invalid write of size 1 : 堆内存越界访问
Invalid read of size 1 : 堆内存越界访问
Source and destination overlap in memcpy : 内存重叠
Invalid free() / delete / delete[]  : 重复释放
Use of uninitialised value of size 4 : 非法指针
HEAP SUMMARY:堆内存使用摘要
LEAK SUMMARY : 泄露摘要
ERROR SUMMARY: 错误总数
valgrind检测举例
出现内存泄漏
#include <stdlib.h>
#include <stdio.h>

int main(void)

       char *ptr;
       ptr = (char *)malloc(10);
       return 0;
保存为memleak.c并编译,然后用valgrind检测。
$ gcc -o memleak memleak.c
我们得到如下错误信息:
$ valgrind ./memleak
==29646== Memcheck, a memory error detector.
==29646== Copyright (C) 2002-2007, and GNU GPL'd, by Julian Seward et al.
==29646== Using LibVEX rev 1732, a library for dynamic binary translation.
==29646== Copyright (C) 2004-2007, and GNU GPL'd, by OpenWorks LLP.
==29646== Using valgrind-3.2.3, a dynamic binary instrumentation framework.
==29646== Copyright (C) 2000-2007, and GNU GPL'd, by Julian Seward et al.
==29646== For more details, rerun with: -v
==29646==
==29646== ERROR SUMMARY: 0 errors from 0 contexts (suppressed: 15 from 1)
==29646== malloc/free: in use at exit: 10 bytes in 1 blocks.   //指示在程序退出时,还有多少内存没有释放。
==29646== malloc/free: 1 allocs, 0 frees, 10 bytes allocated. // 指示该执行过程malloc和free调用的次数。
==29646== For counts of detected errors, rerun with: -v // 提示如果要更详细的信息,用-v选项。
==29646== searching for pointers to 1 not-freed blocks.
==29646== checked 56,164 bytes.
==29646==
==29646== LEAK SUMMARY:
==29646==    definitely lost: 10 bytes in 1 blocks.
==29646==      possibly lost: 0 bytes in 0 blocks.
==29646==    still reachable: 0 bytes in 0 blocks.
==29646==         suppressed: 0 bytes in 0 blocks.
==29646== Rerun with --leak-check=full to see details of leaked memory.
以上结果中,红色的是手工添加的说明信息,其他是valgrind的输出。可以看到,如果我们仅仅用默认方式执行,valgrind只报告内存泄漏,但没有显示具体代码中泄漏的地方。
因此我们需要使用 “--leak-check=full”选项启动 valgrind,我们再执行一次:
$ valgrind --leak-check=full ./memleak
==29661== Memcheck, a memory error detector.
==29661== Copyright (C) 2002-2007, and GNU GPL'd, by Julian Seward et al.
==29661== Using LibVEX rev 1732, a library for dynamic binary translation.
==29661== Copyright (C) 2004-2007, and GNU GPL'd, by OpenWorks LLP.
==29661== Using valgrind-3.2.3, a dynamic binary instrumentation framework.
==29661== Copyright (C) 2000-2007, and GNU GPL'd, by Julian Seward et al.
==29661== For more details, rerun with: -v
==29661==
==29661==
==29661== ERROR SUMMARY: 0 errors from 0 contexts (suppressed: 15 from 1)
==29661== malloc/free: in use at exit: 10 bytes in 1 blocks.
==29661== malloc/free: 1 allocs, 0 frees, 10 bytes allocated.
==29661== For counts of detected errors, rerun with: -v
==29661== searching for pointers to 1 not-freed blocks.
==29661== checked 56,164 bytes.
==29661==
==29661== 10 bytes in 1 blocks are definitely lost in loss record 1 of 1
==29661==    at 0x401A846: malloc (vg_replace_malloc.c:149)
==29661==    by 0x804835D: main (memleak.c:6)
==29661==
==29661== LEAK SUMMARY:
==29661==    definitely lost: 10 bytes in 1 blocks.
==29661==      possibly lost: 0 bytes in 0 blocks.
==29661==    still reachable: 0 bytes in 0 blocks.
==29661==         suppressed: 0 bytes in 0 blocks.
和上次的执行结果基本相同,只是多了上面蓝色的部分,指明了代码中出现泄漏的具体位置。
以上就是用valgrind检查内存泄漏的方法,用到的例子比较简单,复杂的代码最后结果也都一样。
出现其他内存问题
我们下面的例子中包括常见的几类内存问题:堆中的内存越界、踩内存、栈中的内存越界、非法指针使用、重复free。
#include <stdlib.h>
#include <stdio.h>

int main(void)

    char *ptr = malloc(10);

    ptr[12] = 'a'; // 内存越界
    memcpy(ptr +1, ptr, 5); // 踩内存
    char a[10];
    a[12] = 'i'; // 数组越界
     free(ptr); // 重复释放
       free(ptr);
    char *p1;
    *p1 = '1'; // 非法指针

    return 0;
编译: gcc -o invalidptr invalidptr.c -g
执行:valgrind --leak-check=full ./invalidptr
结果如下:
$ valgrind --leak-check=full ./invalidptr
==29776== Memcheck, a memory error detector.
==29776== Copyright (C) 2002-2007, and GNU GPL'd, by Julian Seward et al.
==29776== Using LibVEX rev 1732, a library for dynamic binary translation.
==29776== Copyright (C) 2004-2007, and GNU GPL'd, by OpenWorks LLP.
==29776== Using valgrind-3.2.3, a dynamic binary instrumentation framework.
==29776== Copyright (C) 2000-2007, and GNU GPL'd, by Julian Seward et al.
==29776== For more details, rerun with: -v
==29776==
==29776== Invalid write of size 1 //堆内存越界被查出来
==29776==    at 0x80483D2: main (invalidptr.c:7)
==29776== Address 0x4159034 is 2 bytes after a block of size 10 alloc'd
==29776==    at 0x401A846: malloc (vg_replace_malloc.c:149)
==29776==    by 0x80483C5: main (invalidptr.c:6)
==29776==
==29776== Source and destination overlap in memcpy(0x4159029, 0x4159028, 5) //踩内存
==29776==    at 0x401C96D: memcpy (mc_replace_strmem.c:116)
==29776==    by 0x80483E6: main (invalidptr.c:9)
==29776==
==29776== Invalid free() / delete / delete[] //重复释放
==29776==    at 0x401B3FB: free (vg_replace_malloc.c:233)
==29776==    by 0x8048406: main (invalidptr.c:16)
==29776== Address 0x4159028 is 0 bytes inside a block of size 10 free'd
==29776==    at 0x401B3FB: free (vg_replace_malloc.c:233)
==29776==    by 0x80483F8: main (invalidptr.c:15)
==29776==
==29776== Use of uninitialised value of size 4
==29776==    at 0x804840D: main (invalidptr.c:19)
==29776== //非法指针,导致coredump
==29776== Process terminating with default action of signal 11 (SIGSEGV): dumping core
==29776== Bad permissions for mapped region at address 0x80482AD
==29776==    at 0x804840D: main (invalidptr.c:19)
==29776==
==29776== ERROR SUMMARY: 4 errors from 4 contexts (suppressed: 15 from 1)
==29776== malloc/free: in use at exit: 0 bytes in 0 blocks.
==29776== malloc/free: 1 allocs, 2 frees, 10 bytes allocated.
==29776== For counts of detected errors, rerun with: -v
==29776== All heap blocks were freed -- no leaks are possible.
Segmentation fault
使用了未初始化的内存
程序中我们定义了一个指针p,但并未给他分配空间,但我们却使用它了。
程序示例:
#include <stdio.h>
#include <string.h>
#include <stdlib.h>

int main(void)

    char ch;
    char *p;

    ch = *p;

    printf("ch = %c\\n", ch);

    return 0;
valgrind检测出到我们的程序使用了未初始化的变量。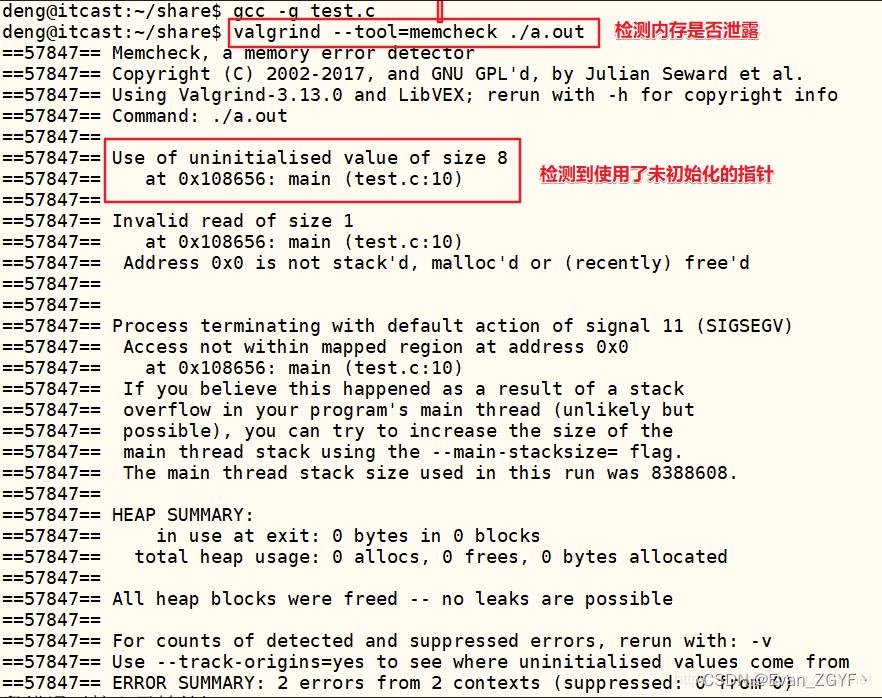
使用了野指针
p所指向的内存被释放了,p变成了野指针,但是我们却继续使用这片内存。
程序示例:
#include <stdio.h>
#include <string.h>
#include <stdlib.h>

int main(void)

    int *p = NULL;

    p = malloc(sizeof(int));
    if (NULL == p)

        printf("malloc failed...\\n");
        return 1;

    memset(p, 0, sizeof(int));
    *p = 88;
    printf("*p = %d\\n", *p);
    //释放内存
    free(p);
    printf("*p = %d\\n", *p);

    return 0;
valgrind检测到我们使用了已经free的内存,并给出这片内存是哪里分配和哪里释放的。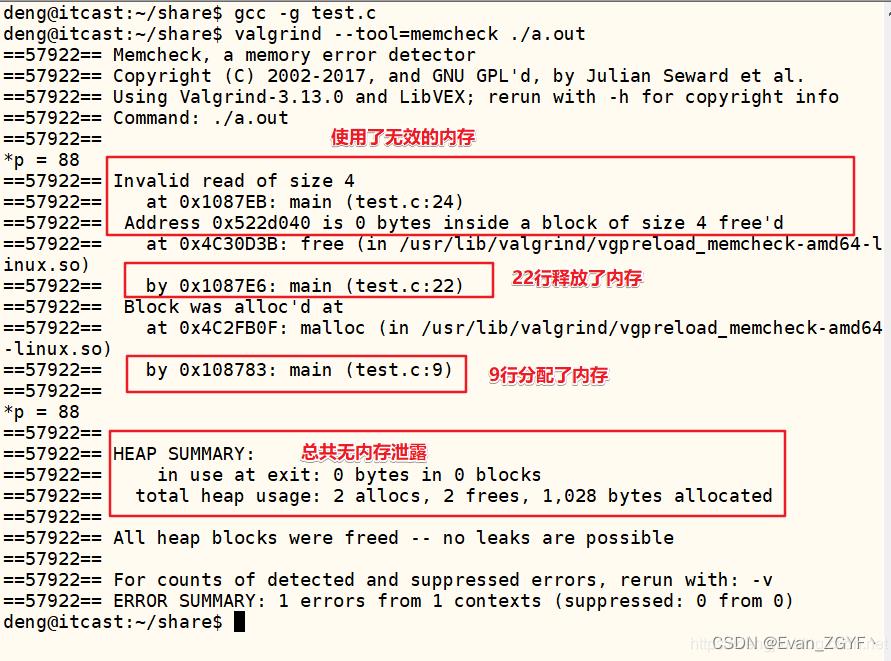
动态内存越界访问
我们动态地分配了一片连续的存储空间,但我们在访问个数组时发生了越界访问。
程序示例:
#include <stdio.h>
#include <string.h>
#include <stdlib.h>

int main(void)

    int i = 0;
    int *p = NULL;

    p = malloc(5 * sizeof(int));
    if (NULL == p)

        printf("malloc failed...\\n");
        return 1;

    memset(p, 0, 10 * sizeof(int));
    for (int i = 0; i <= 5; i++)

        p[i] = i + 1;

    for (int i = 0; i <= 5; i++)

        printf("p[%d]: %d\\n", i, p[i]);

    return 0;
valgrind检测出越界信息如下。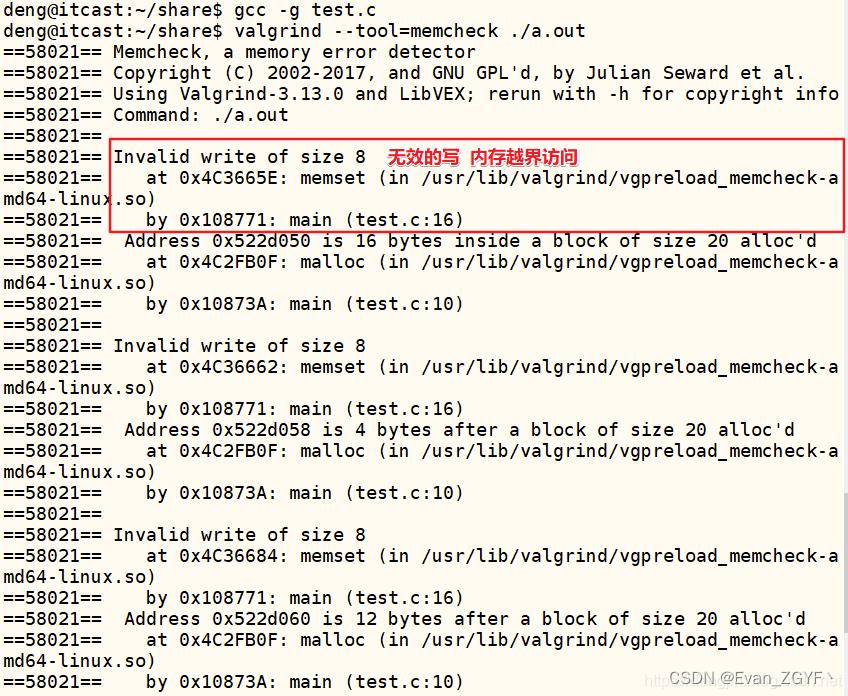
分配空间后没有释放
内存泄漏的原因在于我们使用free或者new分配空间之后,没有使用free或者delete释放内存。
程序示例:
#include <stdio.h>
#include <string.h>
#include <stdlib.h>

int main(void)

    int *p = NULL;

    p = malloc(sizeof(int));

    *p = 88;

    printf("*p = %d\\n", *p);

    return 0;
valgrind的记录显示上面的程序用了1次malloc,却调用了0次free。
可以使用–leak-check=full进一步获取内存泄漏的信息,比如malloc具体行号。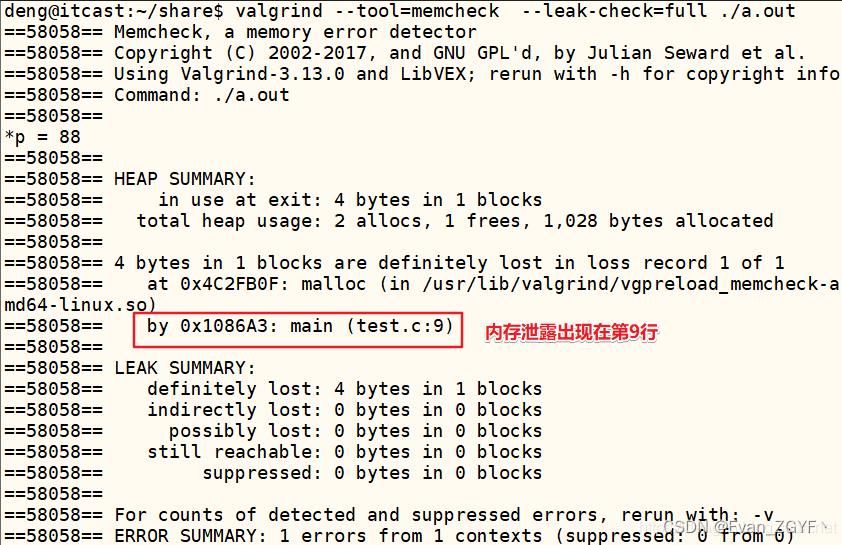
不匹配使用delete或者free
一般我们使用malloc分配的空间,必须使用free释放内存。使用new分配的空间,使用delete释放内存。
程序示例:
#include <stdio.h>
#include <string.h>
#include <stdlib.h>

int main(void)

    int *p = NULL;

    p = (int *)malloc(sizeof(int));
    *p = 88;
    printf("*p = %d\\n", *p);
    delete p;
    return 0;
不匹配地使用malloc/new/new[] 和 free/delete/delete[]则会被提示mismacth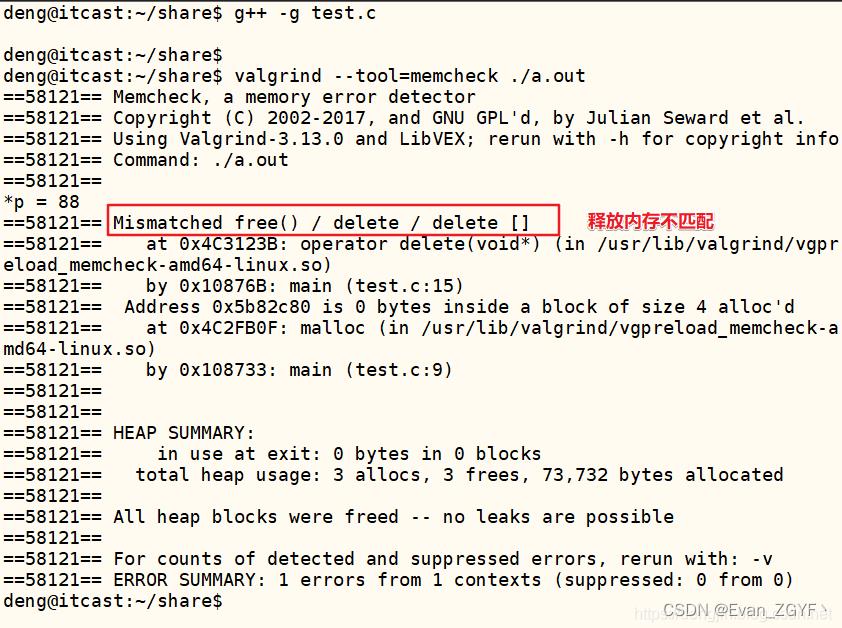
两次释放同一块内存
一般情况下,内存分配一次,只释放一次。如果多次释放,可能会出现double free。
程序示例:
#include <stdio.h>
#include <string.h>
#include <stdlib.h>

int main(void)

    int *p = NULL;

    p = (int *)malloc(sizeof(int));
    *p = 88;
    printf("*p = %d\\n", *p);
    free p;
	free p;
    return 0;
多次释放同一内存,出现非法释放内存。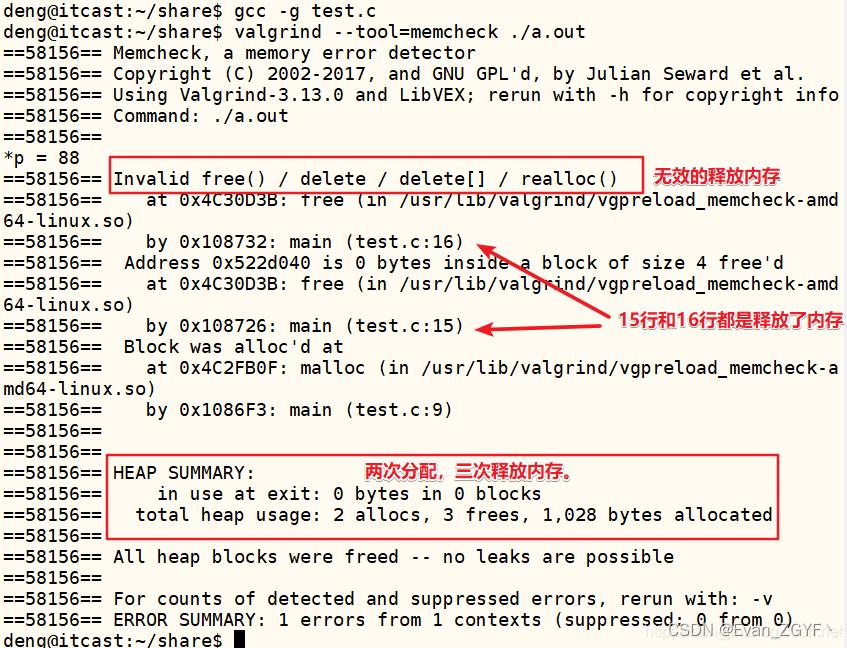
获取更多相关的嵌入式开发工具,可收藏系列博文,持续更新中:
【开发工具】嵌入式常用开发工具汇总帖
以上是关于开发工具Valgrind内存问题检测工具(valgrind)的使用的主要内容,如果未能解决你的问题,请参考以下文章
开发工具Valgrind内存问题检测工具(valgrind)的使用
开发工具Valgrind内存问题检测工具(valgrind)的使用