图像梯度—SobelScharr和Laplacian算子
Posted 小龙呀
tags:
篇首语:本文由小常识网(cha138.com)小编为大家整理,主要介绍了图像梯度—SobelScharr和Laplacian算子相关的知识,希望对你有一定的参考价值。
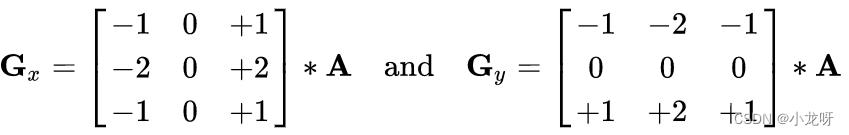
图像梯度-Sobel算子
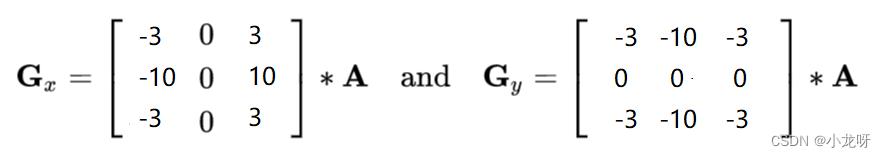
图像梯度-Scharr算子
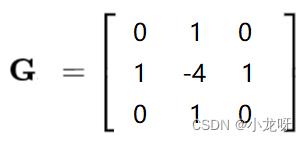
图像梯度-Laplacian算子
整体代码:
import cv2
import matplotlib.pyplot as plt

img = cv2.imread('XTU.jpg',cv2.IMREAD_GRAYSCALE)

#Sobel算子
sobelx = cv2.Sobel(img,cv2.CV_64F,1,0,ksize=3)
sobely = cv2.Sobel(img,cv2.CV_64F,0,1,ksize=3)
sobelx = cv2.convertScaleAbs(sobelx)
sobely = cv2.convertScaleAbs(sobely)
sobelxy =  cv2.addWeighted(sobelx,0.5,sobely,0.5,0)

#Scharr算子
scharrx = cv2.Scharr(img,cv2.CV_64F,1,0)
scharry = cv2.Scharr(img,cv2.CV_64F,0,1)
scharrx = cv2.convertScaleAbs(scharrx) #先计算x方向梯度
scharry = cv2.convertScaleAbs(scharry) #再计算y方向梯度
scharrxy =  cv2.addWeighted(scharrx,0.5,scharry,0.5,0) #加权求和

#Laplacian算子
laplacian = cv2.Laplacian(img,cv2.CV_64F)
laplacian = cv2.convertScaleAbs(laplacian)

plt.figure(figsize=(10,5))
plt.subplot(131)
plt.imshow(sobelxy,cmap='gray')
plt.title('Sobel')
plt.xticks([]),plt.yticks([])

plt.subplot(132)
plt.imshow(scharrxy,cmap='gray')
plt.title('Scharr')
plt.xticks([]),plt.yticks([])

plt.subplot(133)
plt.imshow(laplacian,cmap='gray')
plt.title('laplacian')
plt.xticks([]),plt.yticks([])

plt.show()
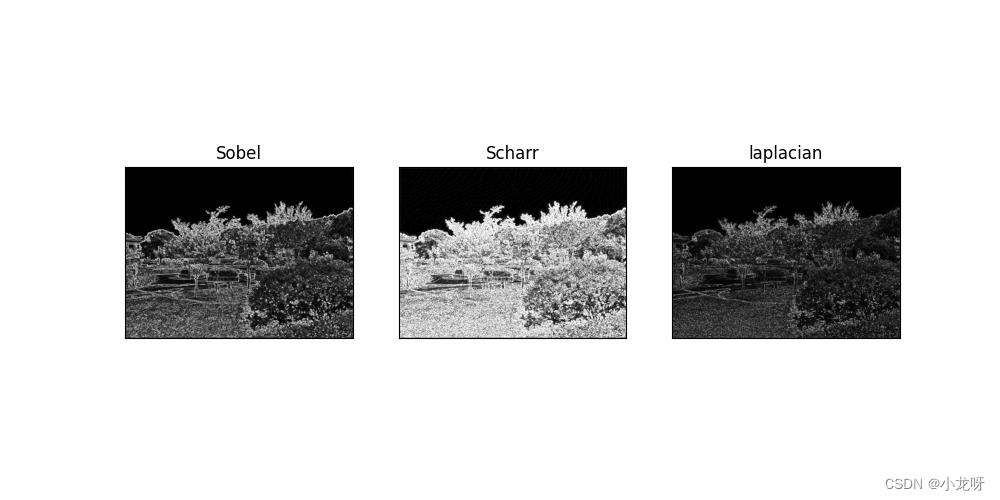
运行结果:

本文为学习笔记:b站网课链接
如有错误或者不足之处,欢迎大家留言指正!
以上是关于图像梯度—SobelScharr和Laplacian算子的主要内容,如果未能解决你的问题,请参考以下文章