vue中引入高德地图Loca数据可视化
Posted 尔嵘
tags:
篇首语:本文由小常识网(cha138.com)小编为大家整理,主要介绍了vue中引入高德地图Loca数据可视化相关的知识,希望对你有一定的参考价值。
目录
引言:
前面我的文章介绍了vue中引入高德地图实例的,详情可以去参考,由于需求增加,地图要做的更加美观、数据更加符合真实的空间数据呈现,依旧选择高德地图的API,这里我们选择引入高德地图 在vue中加载 数据可视化 Loca api 2.0版本。
关键词:
vue、高德地图、LOCA、数据可视化
正文:
Loca 数据可视化 API 2.0(以下简称为LOCA API 2.0)是一个基于高德地图JS API 2.0的高性能地图数据可视化库。其中Loca 2.x版本的要比1.3版本的相比,性能提升了和渲染效果更好,这是因为它们不同的架构模式和渲染管线;而且,2.0版本还引入了自定义镜头动画、图层动效、光照和材质等能力。此处注意一下你的版本兼容性!

一、如何安装或者引入:
方式一:
通过npm引入:
npm i @amap/amap-jsapi-loader --save方式二:
通过标签CDN引入:
<script src="https://webapi.amap.com/maps?v=2.0&key=您申请的key值"></script>
<script src="https://webapi.amap.com/loca?v=2.0.0&key=您申请的key值"></script>
二、如何引入:
通过npm安装的依赖引入,如下:
import AMapLoader from '@amap/amap-jsapi-loader';三、如何使用:
注意版本号要选择 2.0!
AMapLoader.load(
    "key": "ec5517c7d9a73dae44xxxxxxxxxxx", //申请好的Web端开发者Key,首次调用load时必填
    "version": "2.0",  //指定要加载的JSAPI的版本,缺省时默认为1.4.15
    "plugins": ['AMap.Autocomplete', 'AMap.PlaceSearch', 'AMap.Scale', 'AMap.OverView', 'AMap.ToolBar', 'AMap.MapType', 'AMap.PolyEditor', 'AMap.CircleEditor'],
    "Loca":  //是否加载 Loca,缺省不加载
        "version": '2.0.0'  //Loca 版本,缺省1.3.2

).then((AMap)=>
    this.map = new AMap.Map('container',
        zoom: 15.82,
        center: [81.214768,43.836157],
        pitch: 80,
        rotation: 205,
        showLabel: true, //不显示地名
        showBuildingBlock: true, //显示建筑物
        viewMode: '3D', //查看视野
   );

    this.loca = new Loca.Container(
        map: this.map
    );

    //....其他配置代码,参考下文全量代码

)
四、完整代码:
<template>
    <div>
        <div id="container" style="width:100%;height:90vh" />
    </div>
</template>
<script>
    import AMapLoader from '@amap/amap-jsapi-loader';

    export default
        name: "home",
        data()
            return
                mapStyle: "amap://styles/normal", //地图背景模式
                loca: null,
                map: null,
                featuresDataTest: [

                        type: 'Feature',
                        geometry:
                        type: 'Point',
                        coordinates: [81.218792, 43.841619],
                        ,
                        properties:
                        name: '一号灌溉区',
                        price: 65000,
                        count: 92

                    ,

                        type: 'Feature',
                        geometry:
                        type: 'Point',
                        coordinates: [81.20927,43.836963],
                        ,
                        properties:
                        name: '2号灌溉区',
                        price: 65000,
                        count: 52

                    ,

                        type: 'Feature',
                        geometry:
                        type: 'Point',
                        coordinates: [81.20927,43.836963],
                        ,
                        properties:
                        name: '3号灌溉区',
                        price: 49000,
                        count: 53,
                        ,
                    ,

                        type: 'Feature',
                        geometry:
                        type: 'Point',
                        coordinates: [81.190621,43.838342],
                        ,
                        properties:
                        name: '4号灌溉区',
                        price: 62000,
                        count: 639,
                        ,
                    ,

                        type: 'Feature',
                        geometry:
                        type: 'Point',
                        coordinates: [81.203593,43.83431],
                        ,
                        properties:
                        name: '5号灌溉区',
                        price: 48000,
                        count: 651,
                        ,
                    ,
                ]

        ,

        methods:
            //获取当前时间看是白天还是晚上
            getCurrentTime()
                let currentDate = new Date(),
                    hours = currentDate.getHours();
                if (hours >= 19)
                    this.mapStyle = "amap://styles/darkblue";
                 else
                    this.mapStyle = "amap://styles/normal";

            ,

            //初始化地图
            initMap()
               AMapLoader.load(
                   "key": "ec5517c7d9a73dae44xxxxxxxxxxx", //申请好的Web端开发者Key,首次调用load时必填
                   "version": "2.0",  //指定要加载的JSAPI的版本,缺省时默认为1.4.15
                   "plugins": ['AMap.Autocomplete', 'AMap.PlaceSearch', 'AMap.Scale', 'AMap.OverView', 'AMap.ToolBar', 'AMap.MapType', 'AMap.PolyEditor', 'AMap.CircleEditor'],
                   "Loca":  //是否加载 Loca,缺省不加载
                       "version": '2.0.0'  //Loca 版本,缺省1.3.2

               ).then((AMap)=>
                   this.map = new AMap.Map('container',
                       zoom: 15.82,
                       center: [81.214768,43.836157],
                       pitch: 80,
                       rotation: 205,
                       showLabel: true, //不显示地名
                       showBuildingBlock: true, //显示建筑物
                       viewMode: '3D', //查看视野
                   );

                   this.loca = new Loca.Container(
                       map: this.map
                   );

                   var geo = new Loca.GeoJSONSource(
                        data:
                            "type": "FeatureCollection",
                            "features": this.featuresDataTest

                    );

                    // 文字主体图层
                    var zMarker = new Loca.ZMarkerLayer(
                        loca: this.loca,
                        zIndex: 120,
                        depth: false
                    );
                    zMarker.setSource(geo);
                    zMarker.setStyle(
                        content: (i, feat) =>
                            var props = feat.properties;
                            var leftColor = props.price < 60000 ? 'rgba(0, 28, 52, 0.6)' : 'rgba(33,33,33,0.6)';
                            var rightColor = props.price < 60000 ? '#038684' : 'rgba(172, 137, 51, 0.3)';
                            var borderColor = props.price < 60000 ? '#038684' : 'rgba(172, 137, 51, 1)';
                            return (
                                '<div style="width: 490px; height: 228px; padding: 0 0;">' +
                                '<p style="display: block; height:80px; line-height:80px;font-size:40px;background-image: linear-gradient(to right, '
                                + leftColor + ',' + leftColor + ',' + rightColor + ',rgba(0,0,0,0.4)); border:4px solid '
                                + borderColor + '; color:#fff; border-radius: 15px; text-align:center; margin:0; padding:5px;">' +
                                props['name'] +
                                ': ' +
                                (props['price'] / 10000) + `m<sup>3</sup>` +
                                '</p><span style="width: 130px; height: 130px; margin: 0 auto; display: block; background: url(https://a.amap.com/Loca/static/loca-v2/demos/images/prism_'
                                + (props['price'] < 60000 ? 'blue' : 'yellow') + '.png);"></span></div>'
                            );
                        ,
                        unit: 'meter',
                        rotation: 0,
                        alwaysFront: true,
                        size: [490/2, 222/2],
                        altitude: 0
                    );

                    // 浮动三角
                    var triangleZMarker = new Loca.ZMarkerLayer(
                        loca: this.loca,
                        zIndex: 119,
                        depth: false
                    );
                    triangleZMarker.setSource(geo);
                    triangleZMarker.setStyle(
                        content: (i, feat) =>
                            return (
                                '<div style="width: 120px; height: 120px; background: url(https://a.amap.com/Loca/static/loca-v2/demos/images/triangle_'
                                + (feat.properties.price < 60000 ? 'blue' : 'yellow')
                                + '.png);"></div>'
                            );
                        ,
                        unit: 'meter',
                        rotation: 0,
                        alwaysFront: true,
                        size: [60, 60],
                        altitude: 15
                    );
                    triangleZMarker.addAnimate(
                        key: 'altitude',
                        value: [0, 1],
                        random: true,
                        transform: 1000,
                        delay: 2000,
                        yoyo: true,
                        repeat: 999999
                    );

                    // 呼吸点 蓝色
                    var scatterBlue = new Loca.ScatterLayer(
                        loca: this.loca,
                        zIndex: 110,
                        opacity: 1,
                        visible: true,
                        zooms: [2, 26],
                        depth: false
                    );

                    scatterBlue.setSource(geo);
                    scatterBlue.setStyle(
                        unit: 'meter',
                        size: function (i, feat)
                            return feat.properties.price < 60000 ? [90, 90] : [0, 0];
                        ,
                        texture: 'https://a.amap.com/Loca/static/loca-v2/demos/images/scan_blue.png',
                        altitude: 20,
                        duration: 2000,
                        animate: true
                    );

                    // 呼吸点 金色
                    var scatterYellow = new Loca.ScatterLayer(
                        loca: this.loca,
                        zIndex: 110,
                        opacity: 1,
                        visible: true,
                        zooms: [2, 26],
                        depth: false
                    );

                    scatterYellow.setSource(geo);
                    scatterYellow.setStyle(
                        unit: 'meter',
                        size: function (i, feat)
                            return feat.properties.price > 60000 ? [90, 90] : [0, 0];
                        ,
                        texture: 'https://a.amap.com/Loca/static/loca-v2/demos/images/scan_yellow.png',
                        altitude: 20,
                        duration: 2000,
                        animate: true
                    );

                    // 启动帧
                    this.loca.animate.start();

               )
            ,

        ,

        mounted()
            if(!this.map)
                this.initMap();


</script>
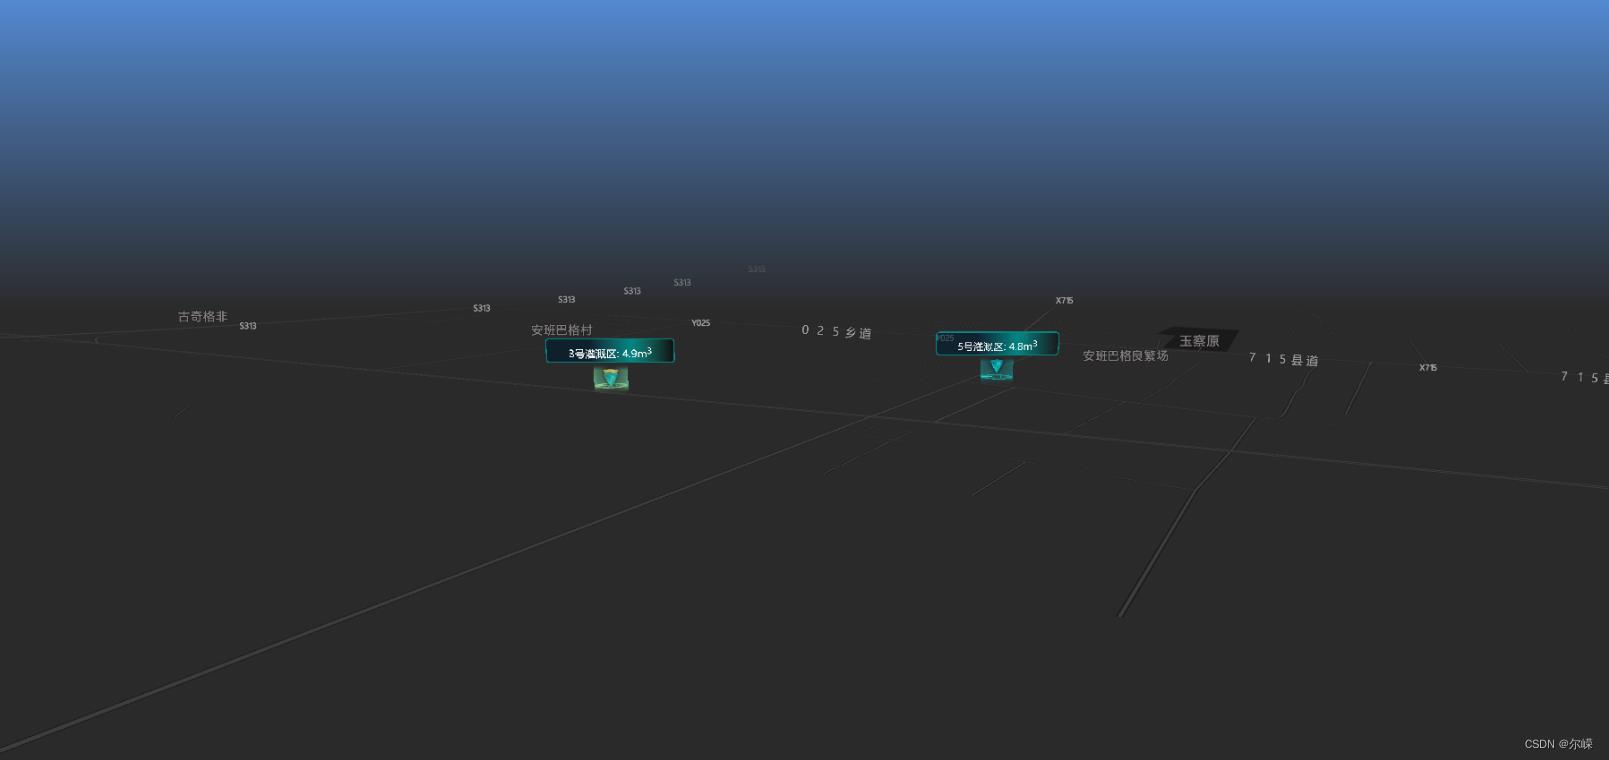
五、效果图

参考:
1.、参考手册-LOCA 数据可视化 API 2.0 | 高德地图API
2.、某片区房价信息-标牌点-示例详情-Loca API 2.0 | 高德地图API
以上是关于vue中引入高德地图Loca数据可视化的主要内容,如果未能解决你的问题,请参考以下文章