柱状图 bar
Posted smile-yan
tags:
篇首语:本文由小常识网(cha138.com)小编为大家整理,主要介绍了柱状图 bar相关的知识,希望对你有一定的参考价值。
2.1 快速开始——第一个例子
import matplotlib.pyplot as plt


if __name__ == '__main__':
    fruits = ['apple', 'blueberry', 'cherry', 'orange']
    counts = [40, 100, 30, 55]
    bar_colors = ['tab:red', 'tab:blue', 'tab:gray', 'tab:orange']
    plt.bar(fruits, counts, color=bar_colors)
    plt.ylabel('fruit supply')
    plt.title('Fruit supply by kind and color')
    plt.show()
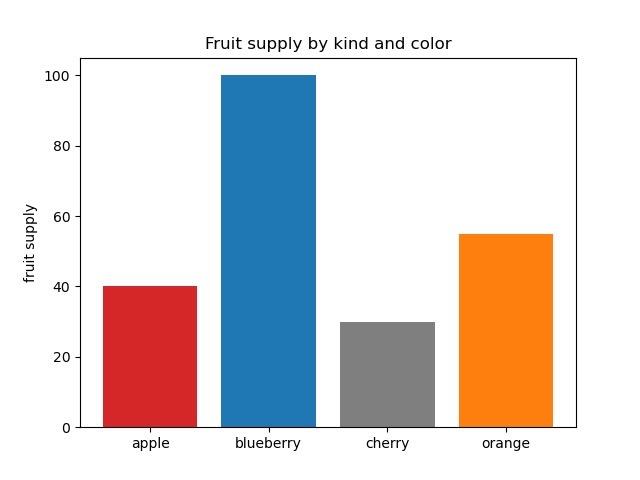
效果如图所示:

2.2 添加网格
import matplotlib.pyplot as plt


if __name__ == '__main__':
    fruits = ['apple', 'blueberry', 'cherry', 'orange']
    counts = [40, 100, 30, 55]
    bar_colors = ['tab:red', 'tab:blue', 'tab:gray', 'tab:orange']
    plt.bar(fruits, counts, color=bar_colors, width=1, edgecolor="white", linewidth=0.7)
    plt.ylabel('fruit supply')
    plt.title('Fruit supply by kind and color')
    plt.show()
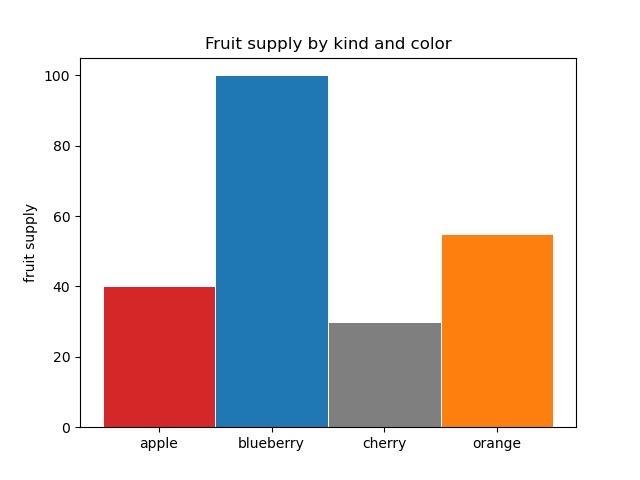
效果如下:

2.3 添加标准差 std
假设这些数据的标准差分别为 20,40,10,20,设置的参数主要包括
yerr: 数组,一般用来表示 偏差或者数据分布的标准差;capsize:绘制横线的宽度。
import matplotlib.pyplot as plt


if __name__ == '__main__':
    fruits = ['apple', 'blueberry', 'cherry', 'orange']
    counts = [40, 100, 30, 55]
    stds = [20, 30, 10, 20]
    bar_colors = ['tab:red', 'tab:blue', 'tab:gray', 'tab:orange']
    plt.bar(fruits, counts, yerr=stds, capsize=10,
            color=bar_colors, width=1, edgecolor="white", linewidth=0.7)
    plt.ylabel('fruit supply')
    plt.title('Fruit supply by kind and color')
    plt.show()
结果如下所示:

2.4 柱上显示数值
import matplotlib.pyplot as plt


if __name__ == '__main__':
    fruits = ['apple', 'blueberry', 'cherry', 'orange']
    counts = [40, 100, 30, 55]
    stds = [20, 30, 10, 20]
    bar_colors = ['tab:red', 'tab:blue', 'tab:gray', 'tab:orange']
    rect1 = plt.bar(fruits, counts,
                    color=bar_colors, width=1, edgecolor="white", linewidth=0.7)
    plt.bar_label(rect1)
    plt.ylabel('fruit supply')
    plt.title('Fruit supply by kind and color')
    plt.show()
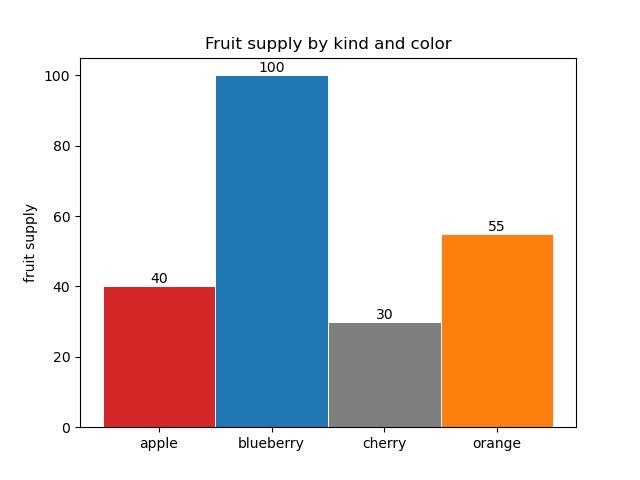
效果如下:

2.5 分组对比
import matplotlib.pyplot as plt
import numpy as np


if __name__ == '__main__':
    labels = ['G1', 'G2', 'G3', 'G4', 'G5']
    men_means = [20, 34, 30, 35, 27]
    women_means = [25, 32, 34, 20, 25]

    x = np.arange(len(labels))  # the label locations
    width = 0.35  # the width of the bars

    rects1 = plt.bar(x - width/2, men_means, width, label='Men')
    rects2 = plt.bar(x + width/2, women_means, width, label='Women')

    # Add some text for labels, title and custom x-axis tick labels, etc.
    plt.ylabel('Scores')
    plt.title('Scores by group and gender')
    plt.xticks(x, labels)
    plt.legend()

    plt.bar_label(rects1, padding=3)
    plt.bar_label(rects2, padding=3)

    plt.tight_layout()

    plt.show()
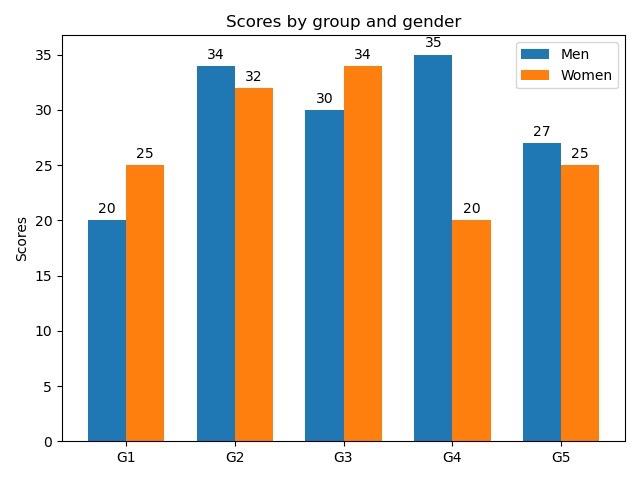
效果如下:

以上是关于柱状图 bar的主要内容,如果未能解决你的问题,请参考以下文章
R语言可视化包ggplot2绘制分组的条形图(bar plot柱状图)实战:多变量柱状图
python使用matplotlib可视化柱状图(bar plot)自定义柱状图的填充色柱状图柱体的边缘色配置字体使用中文轴标签