matplotlib之legend
Posted suonikeyinsu
tags:
篇首语:本文由小常识网(cha138.com)小编为大家整理,主要介绍了matplotlib之legend相关的知识,希望对你有一定的参考价值。
在《matplotlib极坐标系应用之雷达图》 中,我们提出了这个问题“图例中每种成员的颜色是怎样和极坐标相应的成员的颜色相对应的呢”,那么接下来我们说说legend的一般使用和设置。
调用legend()一般有三种方式:
方式1. 自动检测,直接调用legend();
在plot()时就指定图例labels,再直接调用legend()就好了,或者在plot中指定plot elements,然后通过set_label函数指定图例labels
1 plt.plot([1, 2, 3], label=\'Inline label\')
2 plt.legend()
3
4 line, = plt.plot([1, 2, 3])#此处的逗号非常重要,如果没有的话line是一个list对象;加上的话line是一个matplotlib.lines.Line2D对象,才能调用set_label()函数
5 line.set_label(\'Label via method\')
6 plt.legend()


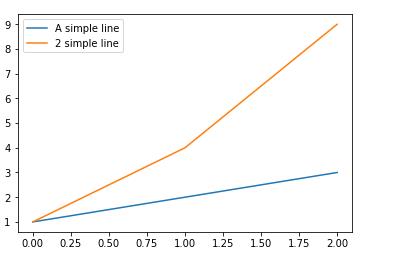
方式2. 显示指定labels,调用legend(labels);
但是,这种方式会使plot elements 和 labels的对应关系不明显,所以并不建议使用这种方式。
Note: This way of using is discouraged, because the relation between plot elements and labels is only implicit by their order and can easily be mixed up.
1 plt.plot([1, 2, 3])
2 plt.plot([1, 4, 9])
3 plt.legend([\'A simple line\',\'2 simple line\'])
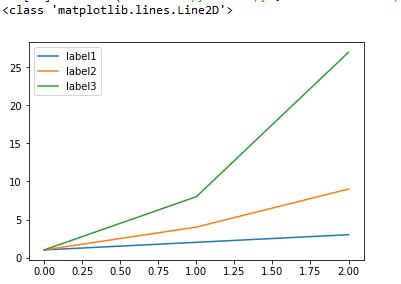
方式3. 显示指定plot elements 和 labels,调用legend(handles, labels)
handles : sequence of Artist/lines/patches
A list of Artists (lines, patches) to be added to the legend. Use this together with labels, if you need full control on what is shown in the legend and the automatic mechanism described above is not sufficient.
The length of handles and labels should be the same in this case. If they are not, they are truncated to the smaller length.
labels : sequence of strings, optional
A list of labels to show next to the artists. Use this together with handles, if you need full control on what is shown in the legend and the automatic mechanism described above is not sufficient.
1 line1, = plt.plot([1,2,3])
2 print(type(line1))
3 line2, = plt.plot([1,4,9])
4 line3, = plt.plot([1,8,27])
5 handles = (line1, line2, line3)
6 labels = (\'label1\', \'label2\', \'label3\')
7 plt.legend(handles, labels)
legend()的返回值:class:`matplotlib.legend.Legend` instance
其他参数说明:
loc : int or string or pair of floats, default: ‘upper right’
| Location String | Location Code |
| ‘best’ | 0 |
| ‘upper right’ | 1 |
| ‘upper left’ | 2 |
| ‘lower left’ | 3 |
| ‘lower right’ | 4 |
| ‘right’ | 5 |
| ‘center left’ | 6 |
| ‘center right’ | 7 |
| ‘lower center’ | 8 |
| ‘upper center’ | 9 |
| ‘center’ | 10 |
ncol : integer(设置图例显示列数)
The number of columns that the legend has. Default is 1.
prop : None or matplotlib.font_manager.FontProperties or dict(设置图例字体)
The font properties of the legend. If None (default), the current matplotlib.rcParams will be used.
references:
https://matplotlib.org/api/_as_gen/matplotlib.pyplot.legend.html?highlight=legend#matplotlib.pyplot.legend
https://matplotlib.org/tutorials/intermediate/legend_guide.html#sphx-glr-tutorials-intermediate-legend-guide-py
以上是关于matplotlib之legend的主要内容,如果未能解决你的问题,请参考以下文章