highCharts 转svg 导出excel
Posted
tags:
篇首语:本文由小常识网(cha138.com)小编为大家整理,主要介绍了highCharts 转svg 导出excel相关的知识,希望对你有一定的参考价值。
具体的需求是这样的:
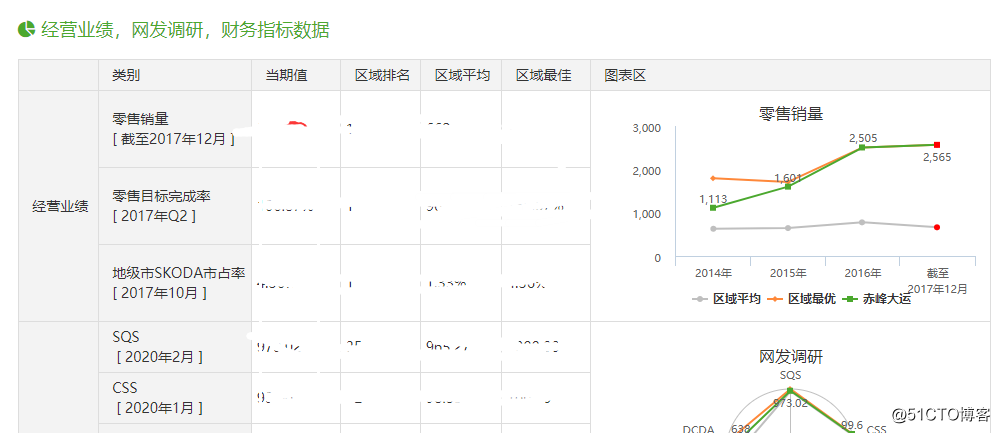
前台要将查出来的数据用highcharts 展示,包括数据封装到table中,table 中展示hightchart的图标,例如这样

这个应该不难实现,那么这个页面下面有一个导出按钮,要将这些数据(table +hightcharts 的图标)到处成excel 到本地,问题是怎么将hightcharts 显示在excel中,理论上报图标保存为图片,在workbook中调用图片也不难,但是现在需要点导出的时候就要生成excel ,这就有点复杂。
具体点的实现是这样的:在前台将highchart的数据生成svg ,在后台将svg 在生成字节流,然后将字节流写到workbook 中。
代码如下
前台的hightcharts 是这样的:
var dailyChartObjOption = {
chart: {
renderTo: 'div_survey',
margin: [ 50, 10, 40,10],
polar: true,
type: 'line'
},
title: {
text: ("网发调研"),
floating: true,
style: { fontFamily: '上海大众l,Microsoft YaHei, Verdana, Arial',minWidth:'1170px',fontSize:'16px'}
},
pane: {
size: '100%'
},
xAxis: {
categories:['<%=EnumSurveyType.SQS.getName() %>','<%=EnumSurveyType.CSS.getName() %>','<%=EnumSurveyType.MS.getName() %>','<%=EnumSurveyType.OIC.getName() %>','<%=EnumSurveyType.DCDA.getName() %>'],
labels: {
style: {
fontFamily: 'xxxx,Microsoft YaHei, Verdana, Arial',minWidth:'1170px'
}
},
tickmarkPlacement: 'on',
lineWidth: 0
},
yAxis: {
min: 0,
max:100,
labels: {
enabled:false,
style: {
fontFamily: 'xxxx,Microsoft YaHei, Verdana, Arial',minWidth:'1170px'
}
}
},
tooltip: {
valueSuffix: '',
style: { fontFamily: 'xxxxx,Microsoft YaHei, Verdana, Arial',minWidth:'1170px'},
formatter: function() {
var y = this.y;
if (this.x == "<%=EnumSurveyType.SQS.getName() %>") {
y = Math.round(parseFloat(this.y) * 1000)/100;
}
else if(this.x == "<%=EnumSurveyType.DCDA.getName() %>"){
if (this.series.name == "区域平均") {
y = Math.round(parseFloat(${dcnAvgScore}) * 100)/100;
}
else if (this.series.name == "区域最优") {
y = Math.round(parseFloat(${dcnTopScore}) * 100)/100;
}
else{
y = Math.round(parseFloat(${dcnScore}) * 100)/100;
}
}
var color_this = color;
if (this.series.name == "区域平均") {
color_this = colorAvg;
}
else if (this.series.name == "区域最优") {
color_this = colorTop;
}
return '<span style="color:'+ color_this +';">' + this.x + '</span><span>:</span><b>' + y + '</b>';
}
},
exporting: {
enabled: false
},
credits: {
enabled: false
},
margin: [0, 0, 0, 0],
backgroundColor: "#FFF",
series: [{
pointPlacement: 'on',
color:colorAvg,
name:"区域平均",
data: [${sqsAvgScore},${qsssAvgScore},${msAvgScore},${hicAvgScore},${dcnAvgScore}/8]
},{
pointPlacement: 'on',
color:colorTop,
name:"区域最优",
data: [${sqsTopScore},${qsssTopScore},${msTopScore},${hicTopScore},${dcnTopScore}/8]
},{dataLabels: {
enabled: true
},
pointPlacement: 'on',
color:color,
name:"${dealerBase.nickName}",
data: [${sqsScore},${qsssScore},${msScore},${hicScore},${dcnScore}/8]
}],
plotOptions: {
line: {
marker: {
radius: 3
},
dataLabels: {
enabled:false,
formatter: function() {
var y = this.y;
if (this.x == "<%=EnumSurveyType.SQS.getName() %>") {
y = Math.round(parseFloat(this.y) * 1000)/100;
}
else if(this.x == "<%=EnumSurveyType.DCDA.getName() %>"){
y = Math.round(parseFloat(this.y) * 800)/100;
}
return y ;
},
style: { fontFamily: 'xxxx,Microsoft YaHei, Verdana, Arial',minWidth:'1170px'}
},
enableMouseTracking: true
}
},
legend: {
enabled :true,
itemWidth:itemWidth,
borderWidth:0,
y:5,
style: { fontFamily: 'xxxxx,Microsoft YaHei, Verdana, Arial',minWidth:'1170px'}
}
};
var dailyChartObjOptionEn = {
chart: {
renderTo: 'div_survey_en',
margin: [ 50, 10, 40,10],
polar: true,
type: 'line'
},
title: {
text: ("SKN Survey"),
floating: true,
style: { fontFamily: 'xxxxx,Microsoft YaHei, Verdana, Arial',minWidth:'1170px',fontSize:'16px'}
},
pane: {
size: '100%'
},
xAxis: {
categories:['<%=EnumSurveyType.SQS.getName() %>','<%=EnumSurveyType.CSS.getName() %>','<%=EnumSurveyType.MS.getName() %>','<%=EnumSurveyType.OIC.getName() %>','<%=EnumSurveyType.DCDA.getName() %>'],
labels: {
style: {
fontFamily: 'xxxxx,Microsoft YaHei, Verdana, Arial',minWidth:'1170px'
}
},
tickmarkPlacement: 'on',
lineWidth: 0
},
yAxis: {
min: 0,
max:100,
labels: {
enabled:false,
style: {
fontFamily: 'xxxx,Microsoft YaHei, Verdana, Arial',minWidth:'1170px'
}
}
},
tooltip: {
valueSuffix: '',
style: { fontFamily: 'xxxx,Microsoft YaHei, Verdana, Arial',minWidth:'1170px'},
formatter: function() {
var y = this.y;
if (this.x == "<%=EnumSurveyType.SQS.getName() %>") {
y = Math.round(parseFloat(this.y) * 1000)/100;
}
else if(this.x == "<%=EnumSurveyType.DCDA.getName() %>"){
if (this.series.name == "Average") {
y = Math.round(parseFloat(${dcnAvgScore}) * 100)/100;
}
else if (this.series.name == "Best") {
y = Math.round(parseFloat(${dcnTopScore}) * 100)/100;
}
else{
y = Math.round(parseFloat(${dcnScore}) * 100)/100;
}
}
var color_this = color;
if (this.series.name == "Average") {
color_this = colorAvg;
}
else if (this.series.name == "Best") {
color_this = colorTop;
}
return '<span style="color:'+ color_this +';">' + this.x + '</span><span>:</span><b>' + y + '</b>';
}
},
exporting: {
enabled: false
},
credits: {
enabled: false
},
margin: [0, 0, 0, 0],
backgroundColor: "#FFF",
series: [{
pointPlacement: 'on',
color:colorAvg,
name:"Average",
data: [${sqsAvgScore},${qsssAvgScore},${msAvgScore},${hicAvgScore},${dcnAvgScore}/8]
},{
pointPlacement: 'on',
color:colorTop,
name:"Best",
data: [${sqsTopScore},${qsssTopScore},${msTopScore},${hicScore},${dcnTopScore}/8]
},{dataLabels: {
enabled: true
},
pointPlacement: 'on',
color:color,
name:"${dealerBase.nickNameEn}",
data: [${sqsScore},${qsssScore},${msScore},${hicScore},${dcnScore}/8]
}],
plotOptions: {
line: {
marker: {
radius: 3
},
dataLabels: {
enabled:false,
formatter: function() {
var y = this.y;
if (this.x == "<%=EnumSurveyType.SQS.getName() %>") {
y = Math.round(parseFloat(this.y) * 1000)/100;
}
else if(this.x == "<%=EnumSurveyType.DCDA.getName() %>"){
y = Math.round(parseFloat(this.y) * 800)/100;
}
return y ;
},
style: { fontFamily: 'xxxx,Microsoft YaHei, Verdana, Arial',minWidth:'1170px'}
},
enableMouseTracking: true
}
},
legend: {
enabled :true,
itemWidth:itemWidth,
borderWidth:0,
y:5,
style: { fontFamily: 'xxx,Microsoft YaHei, Verdana, Arial',minWidth:'1170px'}
}
};然后在ajax 中将图标转成svg
RadaObj = new Highcharts.Chart(dailyChartObjOption);
RadaObjSVG = RadaObj.getSVG();
后台接收是这样子的
 HSSFPatriarch patriarch = (HSSFPatriarch) chineseSheet.createDrawingPatriarch();
        // 2进制流
        // 零售销量
        if (!StringUtils.isEmpty(retailSalesObjSvg)) {
            retailSalesOut = rasterizer.transcode(new ByteArrayOutputStream(), retailSalesObjSvg, MimeType.PNG, null);
            // 零售销量
            HSSFClientAnchor anchorOne = new HSSFClientAnchor(100, 50, 923, 205, (short) 9, (short) 15, (short) 12,
                (short) 17);
            patriarch.createPicture(anchorOne,
                wb.addPicture(retailSalesOut.toByteArray(), HSSFWorkbook.PICTURE_TYPE_PNG));

        }
SvgRasterizer svg 转换的公共类
public class SvgRasterizer {
    /**
     * <p>
     * Description:
     * </p>
     * Field INSTANCE:INSTANCE
     */
    private static final SvgRasterizer INSTANCE = new SvgRasterizer();

    public static final SvgRasterizer getInstance() {
        return INSTANCE;
    }

    /**
     * <p>
     * Description:svg转换
     * </p>
     *
     * @param stream 流
     * @param svg svg字符串
     * @param mime mime类型
     * @param width 宽度
     * @return ByteArrayOutputStream 返回值
     * @throws SvgRasterizerException 异常
     * @throws TranscoderException 异常
     * @throws UnsupportedEncodingException 异常
     */
    public synchronized ByteArrayOutputStream transcode(ByteArrayOutputStream stream, String svg, MimeType mime,
        Float width) throws SvgRasterizerException, TranscoderException, UnsupportedEncodingException {
        //TranscoderInput input = new TranscoderInput(new StringReader(svg));
        TranscoderInput input = new TranscoderInput(new ByteArrayInputStream(svg.getBytes("utf-8")));
        TranscoderOutput transOutput = new TranscoderOutput(stream);

        SVGAbstractTranscoder transcoder = getTranscoder(mime);
        if (width != null) {
            transcoder.addTranscodingHint(SVGAbstractTranscoder.KEY_WIDTH, width);
        }

        transcoder.transcode(input, transOutput);
        return stream;
    }

    /**
     * <p>
     * Description:获取转换器
     * </p>
     *
     * @param mime mime类型
     * @return SVGAbstractTranscoder 返回值
     * @throws SvgRasterizerException 异常
     */
    public static SVGAbstractTranscoder getTranscoder(MimeType mime) throws SvgRasterizerException {
        SVGAbstractTranscoder transcoder = null;

        switch (mime.ordinal()) {
            case 0:
                transcoder = new PNGTranscoder();
                break;
            case 1:
                transcoder = new JPEGTranscoder();
                transcoder.addTranscodingHint(JPEGTranscoder.KEY_QUALITY, new Float(0.9D));

                break;
            case 2:
                transcoder = new PDFTranscoder();
                break;
            default:
                break;
        }

        if (transcoder == null) {
            throw new SvgRasterizerException("MimeType not supported");
        }

        return transcoder;
    }
}
这样就可以了
以上是关于highCharts 转svg 导出excel的主要内容,如果未能解决你的问题,请参考以下文章